Parametric studies of cosmic ray acceleration in supernova remnants
Abstract
We present a library of numerical models of cosmic-ray accelerating supernova remnants (SNRs) evolving through a homogeneous ambient medium. We analyze distributions of the different energy components and diffusive shock acceleration timescales for the models in various conditions. The library comprises a variety of SNR evolutionary scenarios and is used to map remnants with sufficiently known properties. This mapping constrains the respective ambient medium properties and the acceleration efficiency. Employing the library, we derive the ambient medium density, ambient magnetic field strength and the cosmic-ray acceleration efficiency for models of Tycho and SN 1006 remnants and refine the ages of SNR 0509-67.5 and SNR 0519-69.0.
keywords:
acceleration of particles – hydrodynamics – methods: numerical – cosmic rays – ISM: individual: Tycho – ISM: individual: SN1006 – ISM: individual: 0509-67.5 – ISM: individual: 0519-69.0 – ISM: supernova remnants.1 Introduction
Supernova remnants (SNRs) are believed to be the sites of particles acceleration and main contributors to the observed cosmic rays (CR) spectrum up to energies of eV (e.g. Arnett & Schramm 1973, Blandford & Eichler 1987, Berezhko & Völk 2007). However, a direct observational evidence showing that they can accelerate protons up to the CR spectrum “knee” was found only in the remnant of SN 1752 (G120.1+1.4, observed by Tycho Brahe, henceforth Tycho). The data from the Chandra X-ray observatory revealed the presence of eV protons (Eriksen et al. 2011). The first evidence of high-energy electrons accelerated by the forward shock (FS) of the remnant of SN 1006 (G329.6+14.6) was found by Koyama et al. (1995) in analysis of the non-thermal X-ray emission observed with ASCA. The detailed multi-wavelength study of Cassam-Chenaï et al. (2008) confirmed the acceleration of ions in this SNR.
Significant progress has been made in the last decades in developing the theory of nonlinear diffusive shock acceleration (NLDSA), allowing to accurately account for the CR feedback on the SNR evolution (Drury 1983, Blandford & Eichler 1987, Jones & Ellison 1991, Malkov & O’C Drury 2001). In spite of the substantial development in the detailed small-scale Fermi acceleration modeling (Bell et al. 2013) the self-consistent simulations of this process in SNRs still require parametrization (e.g. see the reviews of Schure et al. 2012, Helder et al. 2012, and the references therein).
The efficiency of the NLDSA acting in SNRs is affected by the ambient medium conditions such as density and magnetic field. Moreover, the properties of the CR spectrum strongly depend on the evolutionary stage of the remnant. On the other hand, the back-reaction of the accelerated CRs on the shock structure plays an important role in the SNR’s evolution, as a non-negligible part of the supernova kinetic energy escapes from the remnant in the form of the relativistic particles. To estimate the effect of this back-reaction on the SNR evolution in different conditions, a detailed modeling has to be performed. Thus, we created a library of numerical evolutionary models for SNRs based on a grid of the ambient density values, a parameter regulating the CR acceleration efficiency, and for different ambient magnetic field strengths. This library allows to study the evolution of the NLDSA properties in the models under different conditions.
Multi-wavelength observations of young SNRs and theoretical evolutionary scenarios suggest that the remnants of type II and Ib/c supernovae, results of the core collapse of massive stars, evolve through a non-homogeneous circumstellar medium modified by an outflow from the supernova progenitor. Type Ia supernovae, results of the thermonuclear explosions of white dwarfs, are usually located in a rather uniform medium, largely unaffected by the progenitor wind. In spite of general observational resemblance, young thermonuclear SNRs at the ejecta-dominated or Sedov stages (Chevalier 1982) evolving through a relatively homogeneous medium expose a substantial diversity of their morphologies and emission properties. The reason can be either different evolutionary stages of the remnants together with the different ambient conditions or, possibly, different explosion scenarios. It is often difficult to distinguish between the morphological irregularities caused by the supernova origin or by its interaction with the turbulent medium (Lopez 2014). Hence, in our simulations we fix the explosion mechanism (, power-law ejecta density distribution with index ) and study only the effects of the interaction with the ISM.
This set of SNRs evolutionary scenarios, covering a wide ranges of the ISM densities, magnetic fields, and diffusive shock acceleration (DSA) efficiencies can be used to constrain an allowed parameter space for an SNR with known properties. We considered two well-studied nearby type Ia SNRs, which are Tycho and SN 1006. We used the measured dynamical properties such as FS radius and expansion velocity to constrain the ambient medium density, and properties of the SNR shells to constrain the efficiency of the CR acceleration. We considered as well two SNRs in the Large Magellanic Cloud (LMC): SNR 0509-67.5 and SNR 0519-69.0. The FS radii and velocities were used to constrain the ambient medium densities and the ages for each of these remnants.
The structure of the paper is as follows. In Section 2 we describe our numerical code and the method. In Section 3 we present the grid of the initial parameters. We report the energy evolution profiles and timescales in Section 4. Section 5 contains the analysis of the Galactic SNRs and Section 6 presents models for the remnants in the LMC. We outline the results and discuss them in Section 7 and we conclude by Section 8.
2 Description of the method
The simulations of SNRs evolution are performed with the multidimensional hydrodynamical code ramses (Teyssier 2002) taking advantage of the adaptive mesh refinement (AMR) technique. The method was developed by Ferrand et al. (2010) where they coupled the detailed calculation of the NLDSA through a semi-analytic kinetic approach (introduced by Blasi 2002) with the ramses hydrodynamical solver.
Technical realization of the method is as follows (Ferrand et al. 2010). The NLDSA routine is executed at every time-step of the hydrodynamical simulation. Given the shock properties (velocity and upstream conditions) provided by the ramses hydrodynamical solver, Blasi’s model jointly solves the particle spectrum and the fluid velocity profile. We recall that Blasi’s model essentially connects any point in the upstream with the downstream, for both the relativistic particles and the fluid, and thus predicts the compression ratios (see Blasi 2002, Blasi et al. 2005). At the sub-shock, it uses the conservation of momentum, including the pressure of CRs and of magnetic field (MF) waves, where the general formula for the pressure jump is given by equation (10) of Caprioli et al. (2009). To get the overall compression, a hypothesis on the behaviour of the fluid in the precursor is necessary. The most common one is the Alfvén heating. It depends on the value of the parameter , which was introduced in Caprioli et al. (2009, equation 47). implies effective magnetic field amplification (MFA), and corresponds to the case where amplification of the magnetic field is severely damped due to the transfer of the magnetic energy in the form of waves into thermal energy of the plasma.111Note that the turbulent heating in the case of non-linear Landau damping is ineffective in the fast shocks expanding into not very hot medium, and relevant only for the remnants expanding into pre-supernova hot winds or in old SNRs (Caprioli et al. 2009, Volk & McKenzie 1981). The general formula that links and is given by equation (50) of Caprioli et al. (2009).
Thus with the Mach number provided by the hydro code and the total compression ratio from the Blasi model, using the equation (6) of Ellison et al. (2004) we calculate the effective adiabatic index at the shock , that is applied upstream of the shock front. Then the hydro solver naturally generates the shock predicted by the acceleration model, by integrating the usual conservation equations.
Note that it can only find stationary solutions, that we update after each time-step, given the current flow conditions and the maximum energy particles have reached at that time. The effective adiabatic index is applied to the gas equations in the ramses hydrodynamical scheme just upstream of the FS, in such a way that each fluid element retains its , advecting it inside the shocked region (the diffusion of the relativistic particles is not accounted for downstream of the shock). The NLDSA model is activated only at the FS of the remnant.
Injection of the relativistic particles from the downstream thermal pool is regulated by parameter (Blasi et al. 2005), where is the downstream thermal momentum of the Maxwellian distribution, and is the injection momentum, so that all particles with contribute to the acceleration process. Typically can be in the range thereby high values of correspond to the test-particle regime with weak back-reaction of the accelerated particles on the shock dynamics and low values of imply efficient DSA. The relation between the injection parameter and the fraction of the injected relativistic particles is given by (Blasi et al. 2005)
| (1) |
where is the compression ratio at the subshock.
In addition, we consider the effects of the efficiency of Alfvén waves heating in the precursor on the dynamics, or . Although the Alfvénic drift of the upstream CR scattering centers is parametrized in the code employing the recipe of Kang (2013), we do not investigate this effect in the current study.
3 Parametric grid
In the grid for the SNR evolutionary models the ambient density ranges from 0.01 to 7 . This range covers completely the typical values of the ambient densities, measured in the vicinity of type Ia SNRs (e.g. with for SN 1006 and for the 0519-69.0 SNRs). The CR injection momentum parameter runs from 3.1 to 4.1, spanning the typical range of values inferred for observed SNRs. We consider configurations with the ambient magnetic field G, which are typical for the SNR ambient medium. By default we set Alfvén wave damping efficiency in most of the simulations, however a few models with were analyzed additionally.
The analytical solution from Chevalier (1982, 1983) is used as the initial conditions for the runs. This condition is relevant for the remnants of type Ia supernova, evolving through the uniform ambient medium. Normally, we start the simulations at the age of 30 years. The explosion energy is set to erg, the mass of the ejecta of . We consider a warm ( K) hydrogen medium with the mean particle weight of the proton mass. The maximal resolution of the AMR numerical mesh is of cells. It corresponds to the minimal cell size of 0.04, 0.08, 0.16 pc for a remnant’s age of 200, 800, 2600 yr. For the detailed modeling of Tycho and SN 1006 we performed a few runs of higher spacial resolutions with minimal cell sizes of and pc correspondingly. The library comprises more than 300 hydrodynamical models.
4 Evolution of the DSA parameters
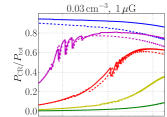
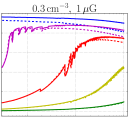
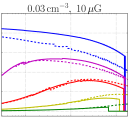
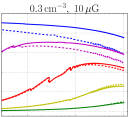
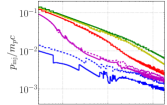
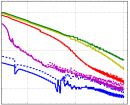
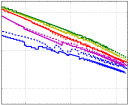
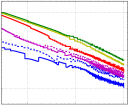
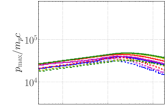
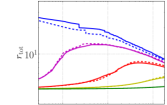
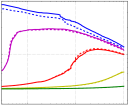
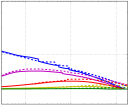
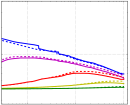
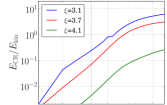
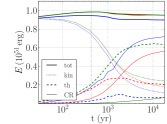
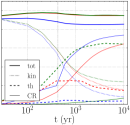
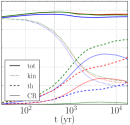
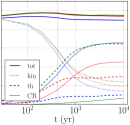
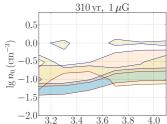
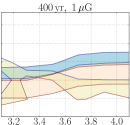
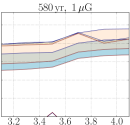
The evolution of the relevant DSA parameters for and G is presented in Figure 1. From top to bottom the quantities are as follows. The CR pressure immediately upstream of the shock normalized to the total pressure , the proton injection momentum (in units of , proton mass, speed of light), the proton maximum momentum (in units of ), the compression ratio at the subshock , the total compression ratio . The colours correspond to different values of . Models with are plotted with green, yellow, red, magenta and blue lines correspondingly. Solid lines are for , dashed lines correspond to . The plots with acceleration efficiency and the SNR energy evolution (total – thick solid line, kinetic – dotted, thermal – dashed, CR – thin solid) are presented in the two bottom rows, where only the models with are shown, and the cases for the are outlined with green, red and blue lines respectively. Note that the evolution of the total energy (thick solid line) deviates from the expected constant value of erg, due to effects of the numerical integration over the volume of the low-resolution models. These profiles are shown for comparison of the cases with various .
According to Berezhko & Ellison (1999) a fast shock becomes modified by the CRs when the following condition is met
| (2) |
where we assume a non-modified case of , all momenta are in units of , and is the FS speed (in km s-1). This expression yields the corresponding value for the injection momentum as
| (3) |
We recall that the injection momentum at the shock is defined as , where is thermal momentum of the plasma downstream of the FS. The shock starts to be CR-modified as soon as the injection momentum reaches . Hence, taking into account that ( Boltzman constant, downstream proton temperature) and using for a non-modified shock we conclude that the transition from test-particle regime to the NLDSA occurs when
| (4) |
The evolutionary plots in the top row of Figure 1 show that drastic increase of takes place earlier for the models with denser ambient medium and lower values of -parameter. According to the contour-plot in the right-hand side of Figure 2 the values of correspond to and consequently the respective critical velocities are km s-1. The first two cases can represent remnants of yr expanding through a medium. The irregular behaviour of can be due to uncertainties in estimating the FS location, which partially can be caused by numerical instabilities at the shock front (the presented profiles are already smoothed using a median filter). Note that this issue appears when the CR pressure starts to increase rapidly (top left plots of Figure 1), leading to strong shock modifications.
Comparison of the models with different ambient magnetic field reveals that the CR pressure is lower for the higher , where the amplification is more efficient and a considerable amount of energy is transferred to the amplified magnetic field. According to Berezhko & Ellison (1999) which yields . This dependence of the compression ratio on the FS velocity, ambient magnetic field and ambient density is reflected in the behaviors of . A more detailed investigation of how influences the NLDSA is reported in Ellison et al. (2005). We note that the models with with the efficient wave damping only slightly differ from the models with . The effect is visible only for the extremely high efficiencies of and reduces and only by a few percent. Similar effects of the wave heating on the shock properties were reported by Kang (2010).
For the over-magnetized tenuous plasma is small and leads to rather high . Hence, when drops considerably (at the age of a few thousands of years), the NLDSA mechanism switches off and results in the transition of the CR modified shock back to the un-modified regime. This is reflected in the energy evolution plots for the , G models (lower plots in the third column of Figure 1). Moreover, for the case of and G the situation with and is inverse, this is why the respective acceleration efficiency increases even after yrs (second column of Figure 1).
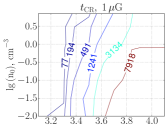
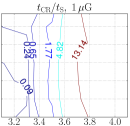
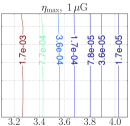
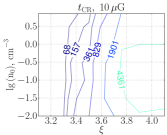
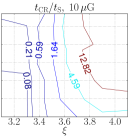
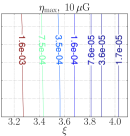
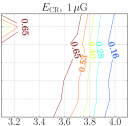
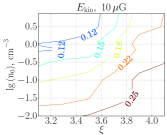
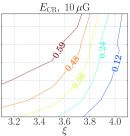
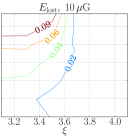
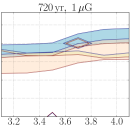
As was noted in Berezhko & Völk (2004) the efficiency of the acceleration gradually declines with time with the decrease of the Alfvén Mach number. They have pointed out that for yr the CR production does not play an important role in the SNR dynamics. To improve on this estimate we calculated the timescales when the CR pressure upstream of the FS reaches its maximum. The corresponding maps on the (, )-grid are presented in the left panel of Figure 2. The middle panel shows the values normalized by the Sedov timescale yr and the right panel shows the maps of maximum injection parameter. E.g. for , the age when DSA efficiency is still high but starts to fall off is of the order of a few thousands of years and is about of the radiative timescale.
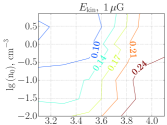
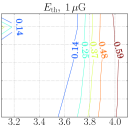
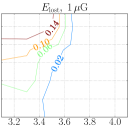
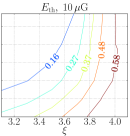
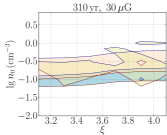
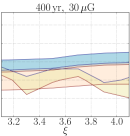
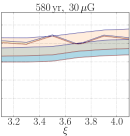
To estimate the amount of energy expelled into the ISM in our SNR models we calculated the kinetic, thermal, and trapped CR energy components at the age of a remnant a few of (end of the Sedov-Taylor stage). The corresponding maps are presented in Figure 3. The respective energy shares for the models with are summarized in table 1.
| ( erg) | ( erg) | ( erg) | ( yr) | |||
|---|---|---|---|---|---|---|
| 1.0 | ||||||
| 10 |
5 Maps for the Galactic supernova remnants
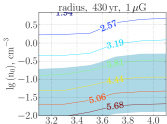
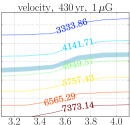
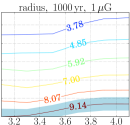
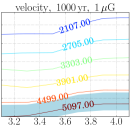
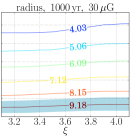
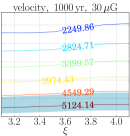
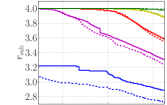
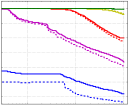
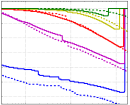
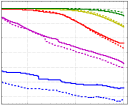
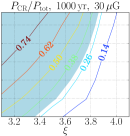
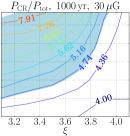
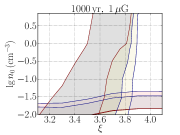
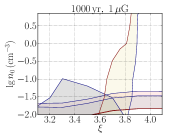
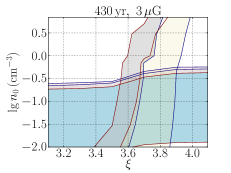
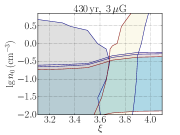
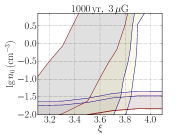
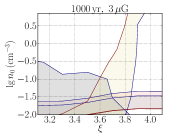
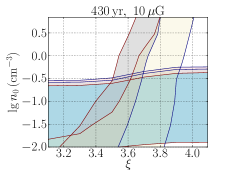
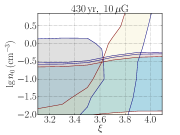
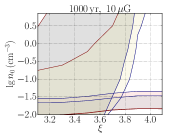
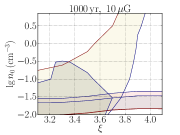
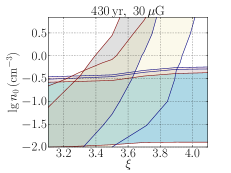
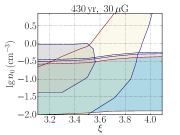
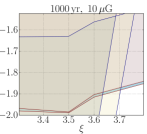
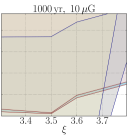
In what follows we show how the library can be used for the identification of SNRs properties. Maps for the FS radii and velocities with the regions of the allowed parameter space (blue shaded areas) for Tycho and SN 1006 remnants are presented in Figure 4, where we show plots with the values ambient magnetic field of G (top row) and G (bottom row).
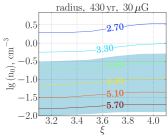
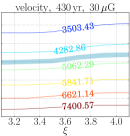
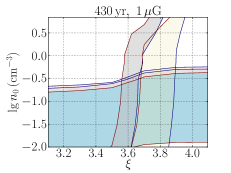
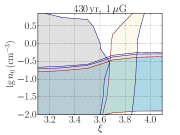
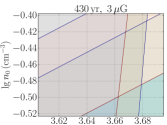
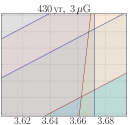
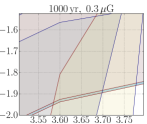
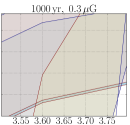
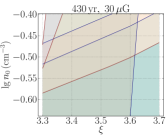
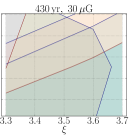
The first and the second columns of Figure 4 contain the models at the age of Tycho (430 year) with the forward shock radius (3.6 - 6.1 pc) derived from the angular measurements of Warren et al. (2005, FS location of 251”) and the distance measurements of Hayato et al. (2010, kpc). The FS velocity is estimated by Hayato et al. (2010, 4600 - 4800 km s-1) from the measurements of Si, S, and Ar emission lines broadening. The third and the forth columns are the maps for the models at the age of 1000 yr with the shaded region being the data of SN 1006 remnant. The FS radius is measured by Cassam-Chenaï et al. (2008, ) and the distance estimate is taken from Winkler et al. (2003, 2.2 kpc). The FS velocity of was derived by Katsuda et al. (2009, 2013) from Chandra proper motion measurements of the North East non-thermal dominated rim, assuming the distance of 2.2 kpc. Contour-maps with CR pressure () and compression ratio () at the FS for the ages of 430 and 1000 yr are presented on Figure 5. The shaded regions are the ranges of the CR pressure and the compression ratio estimated in Kosenko et al. (2010).
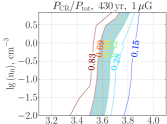
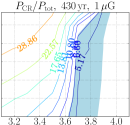
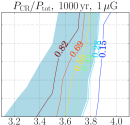
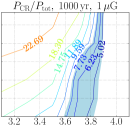
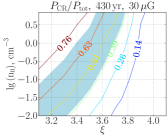
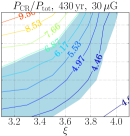
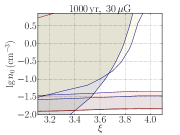
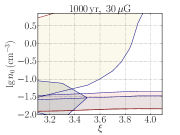
These properties are assembled together in Figure 6. The FS radius (blue), FS velocity (peach), compression ratio (beige) and the CR pressure (grey) for Tycho are presented in the first column. The second column contains the same data with the CR pressure replaced by the ratio (CD: contact discontinuity) with the corresponding measurements for Tycho of Warren et al. (2005). The third and the forth columns show the data corresponding to SN 1006 with the ratio derived by Miceli et al. (2009). The intersection of the all regions constrain the ranges of the allowed parameter space (, , ), which are summarized in table 2. Note that the CR pressure and ratio select approximately the same respective regions in almost all the maps.
| Tycho | SN 1006 | |||||
| ) | ||||||
| 0.3 | - | - | - | |||
| 1.0 | - | - | - | |||
| 3.0 | ||||||
| 10 | ||||||
| 30 | - | - | - | |||
For a more detailed study of the Galactic SNRs we performed simulations with higher AMR maximum mesh resolution of . Tycho models were zoomed out for G, , . SN 1006 was modeled with G, , . The corresponding contour-maps are presented in Figure 7. The plots show that the simulations with the increased resolution produce almost the same results. However, there are minor modifications of the regions (e.g. 430 yr, G case) of the order of a few per cent. We note that the higher resolution models of cells consume a factor of 20 more computational resources compared to the resolution of .
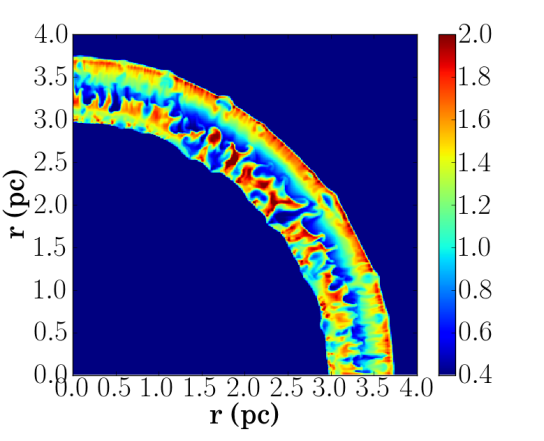
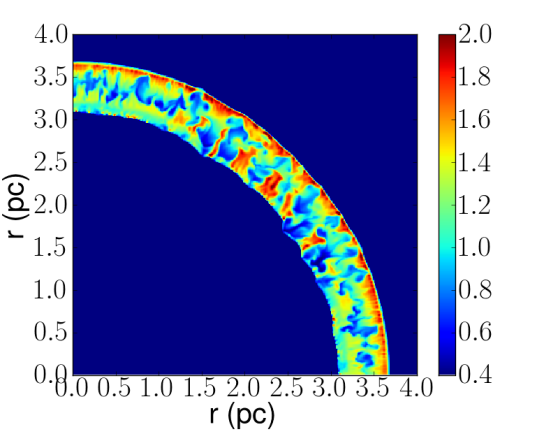
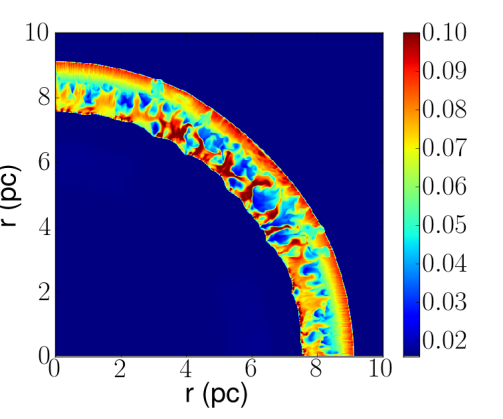
3D density slices of resolution runs for Tycho and SN 1006 are presented in Figure 8.222The non-uniform structure of the FS results from a numerical instability (discussed in Fraschetti et al. 2010). For these detailed simulations we selected the configurations from the central parts of the allowed parameter regions. From top to bottom the models are G, , and G, , for Tycho (left column), G, , and G, , for SN 1006 (right column). Although the typical magnetic field in the Galaxy is about G, formally the dynamical and morphological SNR parameters alone cannot exclude the cases with as high as G. The next step in the fine-tuning of the SNR properties and specifically pin-pointing the magnetic field will be the detailed modeling of the thermal X-ray and non-thermal broad-band (including -ray) emission. This functionality is implemented in the code and described in details in Ferrand et al. (2012, 2014).

6 Supernova remnants in the Large Magellanic Cloud
We also applied the library to the young SNRs located in the LMC: 0509-67.5 and 0519-69.0. Knowing the distance to the LMC ( kpc) from the angular sizes we unequivocally derive physical dimensions of the remnants. We use the FS velocity measurements reported by Ghavamian et al. (2007), estimated from the far-ultraviolet lines broadening at the FS, and the velocities of the plasma at the CD () derived by Kosenko et al. (2008), Kosenko et al. (2010) in the analysis of the soft X-ray spectra in XMM-Newton RGS data.
As before, we built contour-maps of FS radii and velocities for the 0509-67.5 and 0519-69.0 SNRs. During the ejecta-dominated or early Sedov stages of the remnant’s evolution, the main contribution to the emission line broadening is made by the expansion of the shocked material, rather than by the thermal motion of ions. Thus, we compare the measurements reported in Kosenko et al. (2008), Kosenko et al. (2010) with the maps of the dynamics of the ejecta in the vicinity of the CD. For each remnant, we selected the age limits when the measured FS radii and velocities are compatible. The corresponding contour-plots are presented in Figure 9. This technique yields the age of the SNR 0509-67.5 model of yr with and for the SNR 0519-69.0 of yr ( yr if the plasma velocity at the CD is not taken into account) with .
7 Discussion
The recent detailed modeling of Bell et al. (2013) showed that CR acceleration up to the knee in the Galactic spectrum is only possible if the magnetic field ahead of the shock is substantially amplified by the escaping CRs. As we described in Section 2, in our simulations we used the recipe of Caprioli et al. (2009) where MFA is provided entirely by the CR-induced streaming instability. However, it is not entirely clear which mechanism provides the most of amplification. MFA is an important ingredient, yet its modeling is still much uncertain. Nevertheless, in this study we investigate only dynamical properties of the remnants, where the details of the magnetic field structure and amplification ahead of the shock do not play such a crucial role: all the unknown relevant parameters are secondary to the injection efficiency . These aspects become important in the modeling of the non-thermal emission from a SNR, which is presented in Ferrand et al. (2014) together with a more comprehensive discussion of MFA. For a study of the impact of different MFA models for a type Ia SNR we also refer the reader to the study of Kang et al. (2013).
The approach used by Caprioli et al. (2009) is based on results valid for Alfvén wave dynamics in the case of a plane-parallel shock. Even though this may not be an exact description for a spherical shock, we assume that it is an acceptable approximation for the purpose of our parametric study. There could be some systematic bias here, however we believe that, when comparing with the observations, the uncertainties of the measurements are more important and we can apply here the parallel shock approach.
7.1 Cosmic-ray energy evolution
The maps with the CR energy (Figure 3) and with the DSA timescales (Figure 2) imply that a typical SNR during its lifespan can transfer up to of the explosion energy to the cosmic-ray particles. The acceleration of the relativistic particles falls-off after years of the SNR expansion, long before the transition to the radiative phase yr (Cioffi et al. 1988).
According to Li et al. (2011) the supernova rate in our galaxy is per century. Hence, our findings on the channeling of erg of the SNR energy to the relativistic particles result in ergs s-1 luminosity of the CRs in the Galaxy. This rough estimate is in general agreement with Dogiel et al. (2002) and Strong et al. (2010) calculations of the diffuse hard X-ray and -ray emission in the Galaxy, where they derive the CR luminosity of erg s-1. As suggested by Cristofari et al. (2013), our value can be overestimated as it does not account for the parts of the shells interacting with dense clouds, where CR acceleration is suppressed. A specific geometry of the magnetic field, as in the case of SN 1006, also affects the acceleration efficiency. Note that we focus here only on type Ia supernovae, whereas a remnant of type II supernova expanding in a low density cavity created by the progenitor wind may be a less effective accelerator. Besides, the uncertainties of the SN rate and the CR luminosity estimates referenced above can reach a factor of two.
The energy profiles in Figure 1 differ from those presented by Kang (2010, 2013). In our models of the initially cold fast ejecta, expanding into the warm ISM the kinetic energy is transferred into thermal and CR components, while in Kang (2010, 2013) the thermal energy is already dominating in the very beginning of the SNR evolution. However in both cases at about several thousand years the CR energy saturates around some critical value. The level of this saturation depends on the assumed ISM properties (warm or hot ISM in Kang 2010). In our simulations the saturation occurs for the balanced cases with , G and , G.
The range of the energy transferred to the CRs (table 1) covers the estimates of the previous studies (e.g. Berezhko & Völk 1997, Berezhko et al. 2009, Kang & Jones 2006) and is in agreement with values of Kang (2013), where it was found that without Alfvén drift reaches of the explosion energy and a few percent less if the drift is accounted for. In the efficient accelerating models of Kang (2013) the fraction of the CR escape energy ranges in , which corresponds in our maps to for and for models, as the plots in the last column of Figure 3 show.
7.2 Implications for observations
We demonstrated how the library can be used on the examples of four SNRs: Tycho, SN 1006, 0509-67.5 and 0509-69.0. Employing the available measured properties (such as FS velocity, the FS radius), the library allows to put constrains on the density of the ambient medium, the acceleration parameter and the ambient magnetic field. We compared the observations with 3D hydrodynamical models, assuming a warm homogeneous ambient medium (consisting of only hydrogen atoms), a power-law ejecta density profile, and a supernova explosion energy of erg.
7.2.1 Tycho
The mapping of the Tycho’s properties suggests an ambient magnetic field of G, density of , the acceleration parameter , injection fraction , compression ratio , with an assumed distance of kpc. The energy components are , , (in units of erg) for G. The effects of the turbulent wave heating were studied for the high-resolution simulations with the maximum number of cells of in the model with a magnetic field as high as G. In this case the dynamical parameters and energy distribution change only very slightly. For the model with and extreme value for the acceleration parameter we have found for .
The inferred ISM density of is higher that the upper limit , estimated by Katsuda et al. (2010) and considerably lower than the best matched value of derived from hydrodynamical and X-ray spectral modeling of Badenes et al. (2006) with an adopted explosion energy of erg. Nevertheless, there are indications of the non-trivial history of this remnant and it is possible that in the earlier stages the shell was interacting with the pre-supernova dense wind, created by the progenitor system (e.g. Chiotellis et al. 2013). In this case the homogeneous ISM models should be used with caution.
Völk et al. (2008) employed the nonlinear kinetic theory of cosmic ray acceleration (1D calculations with a correction of 1.05 for Rayleigh-Taylor instabilities), adopted an explosion of erg (MFA was not included in the theory) and found a model matching the mean ratio between the radii of the CD and the FS of the remnant and the observed -ray emission with , , compression ratio , and the distance kpc. With the SNR library we found similar injection fraction of . However, comparison of their compression ratio with the contour-maps in the second column of Figure 6 (the corresponding scales are provided in Figure 5) shows no intersection of the values with the allowed region for any and . This implies that, in our framework, no hydrodynamical model can accommodate both these values simultaneously. The CD location in the 3D models with the account for the Rayleigh-Taylor instability sets the lower limits of on the total compression ratio in the models for Tycho.
Our findings support the assumption made in the study of Morlino & Caprioli (2012), where they applied , and kpc, and considered a erg explosion with mass of ejecta. They modeled the -ray emission detected with the Fermi-LAT and VERITAS observatories employing a semi-analytical approach to the NLDSA accounting for MFA due to resonant streaming instability and the back-reaction on the shock from both the CR and the self-generated magnetic turbulence. It was found that at the present epoch the remnant channels 10% of its kinetic energy into CRs. Further, comparison of the measurements (RS: reverse shock) with spherically-symmetrical 1D hydrodynamical models obtained with a two-fluid treatment for CRs and assuming a 1.4 erg explosion (Kosenko et al. 2011) results in at the FS for Tycho. These ranges are somewhat lower than our findings derived from the same measurements.
In the latter case the explosion energy plays an important role. Assuming a more energetic model would imply a higher ISM density and a higher kinetic energy with the absolute CR energy deposited unchanged (as DSA depends strongly on the FS Mach number), thus reducing the acceleration efficiency estimate. On the other hand, Morlino & Caprioli (2012) used erg models to fit the emission and this argument does not hold, although their approach of modeling -ray spectra was contested by Berezhko et al. (2013). Note that the low resolution models (e.g. the fourth column of Figure 1 with ) at the age of Tycho produce more conservative values of erg and . This can imply that the 3D instabilities in the shell affect the final results.
Recently, Slane et al. (2014) performed a 1D spherically symmetric modeling of Tycho. They adopted erg, and found a best fit for , with . They found a downstream magnetic field of G, with an unperturbed ISM value of G. In their modeling Morlino & Caprioli (2012) found a best-fitting downstream magnetic field of G, with the same unperturbed ISM value of G. Völk et al. (2008) determined the downstream magnetic field value from the observed linear thickness of X-ray filaments of G. The mapping of Tycho’s dynamical properties reported here suggests the values of G for G correspondingly and for in the latter case. In our grid the measured downstream magnetic field of G can be associated with the cases of G and possibly with effective turbulent heating.
7.2.2 SN 1006
The mapping of SN 1006 properties yields an ambient medium density of , and an acceleration parameter of . The energy distribution in the remnant is as follows (in units of erg): , , for G.
The allowed range found for the ISM density is lower than the results of Berezhko et al. (2009) derived from the TeV (H.E.S.S., Acero et al. 2010) flux , and Acero et al. (2007) value, based on the X-ray emission from the South East rim of the remnant, of assuming a supernova explosion energy of and erg respectively. Moreover, compression ratios of 4.9 and 4.7 for and (Berezhko et al. 2009) are somewhat lower than our findings of restricted by the measurements (the rightmost column of Figure 6). Yet the spatially resolved spectral analysis of XMM-Newton spectra by Miceli et al. (2012) implies a compression ratio of in the regions of the strongest non-thermal emission. Note that basing the hydrodynamical models on a 2 erg explosion would increase the estimate by a factor of two, changing it to , which is still lower than the value of of Katsuda et al. (2009).
In the revision of the TeV emission analysis with non-linear kinetic theory, Berezhko et al. (2012) updated the circumstellar hydrogen density to with a share of the CR energy of of the explosion energy (of erg). The latter is in agreement with our estimate erg. Their best fit injection parameter is close enough to our estimate of for G. In the fitting of the spatially-integrated synchrotron emission, Berezhko et al. (2012) found a downstream magnetic field of G. In our high-resolution models for SN 1006 with the amplified magnetic field behind the FS is G for G and . This comparison suggests that the ambient magnetic field around SN 1006 can reach G without Alfvén wave damping.
However, in the detailed analysis of the X-ray radial profile reported by Morlino et al. (2010), they fixed , (G, downstream magnetic field G) and found the best fit to the observed radial profile with and the CR acceleration efficiency of . We have found the lower limit for G case and respective . On the other hand, Petruk et al. (2011) in their analysis of the radio, hard X-ray, and -ray data also found G and the magnetic field inside the remnant of G, which is in agreement with “leptonic” model parameters of Acero et al. (2010). According to our models, such a configuration corresponds to the efficient turbulent heating acting in the precursor.
7.2.3 LMC SNRs
Although SNR 0509-67.5 was examined by many authors, its physical properties remain much uncertain. Studies of the light echo by Rest et al. (2005) derived the age limits of yr, thermal X-ray modeling by Badenes et al. (2008) implies 400 yr, and the analysis of Ghavamian et al. (2007) yields yr. The determination of the ISM density is also somewhat problematic. In the spectral fitting of the Chandra data with the non-thermal dominated X-ray continuum model, Warren & Hughes (2004) found . The best matched ambient density in the hydrodynamical simulations coupled with X-ray spectral modeling of Badenes et al. (2008) was found to be . The detailed analysis of the XMM-Newton spectra reported by Kosenko et al. (2008) revealed and they used for the hydrodynamical models.
The range of mapped in the SNR model grid presented here can reconcile these estimates. The age of yr is in agreement with the previous studies. The explanation of the discrepancy between the X-ray density values and the mapped dynamical range can be twofold. On one hand, higher derived from X-ray spectral modeling could be of the same origin as for Tycho, where the X-ray spectra suggest that the ISM density is almost 5 times higher than the dynamical value (the detailed case study is reported in Chiotellis et al. 2013). On the other hand, our library is built with the assumption of an explosion energy of erg. A more energetic supernova would imply a higher ISM density for the measured FS radius and velocity.
SNR 0519-69.0 is also one of the remnants for which the age of years was derived from the light echo analysis (Rest et al. 2005). The detailed multicomponent analysis of the XMM-Newton X-ray spectra and Chandra X-ray image provided the ISM density of (Kosenko et al. 2010).
Using only the FS radius and velocity measurements, the library of dynamical models restricts the age for this SNR to yr. Accounting for the plasma velocity at the CD refines this number to yr. The allowed parameters space yields an ISM density of . The difference is similar to the case of SNR 0509-67.5. A twice as more energetic supernova than assumed here would imply . Moreover, the typical overestimation of the density in the X-ray emission analysis over the dynamical value could again be similar to the case of Tycho (Chiotellis et al. 2013).
8 Conclusion
In this paper we presented a library of 3D models of type Ia SNRs evolving through a homogeneous medium. The multi-dimensional approach in the hydrodynamical simulations allows to accurately estimate the content of the different energy components in the remnants. Moreover, the detailed 3D modeling yields the location of the CD with the proper account for the Rayleigh-Taylor instability (Fraschetti et al. 2010, Ferrand et al. 2010). The library is built on a grid of the crucial parameters for the SNR evolution: ambient medium density , ambient magnetic field , and acceleration parameter . We considered rather wide ranges of these parameters, so that the grid can accommodate all the SNRs with sufficiently known properties. The library enables us to evaluate the efficiency of the CR acceleration in SNRs if environmental parameters are sufficiently well known, and to pin down these parameters if the CR efficiency could otherwise be estimated.
Using the measurement of the FS radius and velocity of Tycho and SN 1006 we localized these remnants on the ()-grid and derived the respective allowed parameter spaces. For SNR 0509-67.5 and SNR 0519-69.0 we identified their dynamical ages and . In the future this method can be used as a guide for the interpretation of observations of other SNRs.
Acknowledgments. DK was funded by the French National Research Agency (ANR) under the COSMIS project and supported by Russian Foundation for Basic Research (RFBR) grant 13-02-92119. GF has been funded by an NSERC’s Canada Research Chairs award to Samar Safi-Harb, with additional support from the Canada Foundation for Innovation and the Manitoba Research and Innovation Funds. GF had been also partially supported by the Canadian Institute of Theoretical Astrophysics (CITA) through the National Fellowship Program. All simulations were performed on the IRFU/COAST cluster at CEA Saclay. The authors would like to thank Samar Safi-Harb for proofreading the final manuscript and anonymous referee for the revision and valuable comments.
References
- Acero et al. (2007) Acero F., Ballet J., Decourchelle A., 2007, A&A, 475, 883
- Acero et al. (2010) Acero F., et al., 2010, A&A, 516, A62
- Arnett & Schramm (1973) Arnett W. D., Schramm D. N., 1973, \apjl, 184, L47
- Badenes et al. (2006) Badenes C., Borkowski K. J., Hughes J. P., Hwang U., Bravo E., 2006, ApJ, 645, 1373
- Badenes et al. (2008) Badenes C., Hughes J. P., Cassam-Chenaï G., Bravo E., 2008, ApJ, 680, 1149
- Bell et al. (2013) Bell A. R., Schure K. M., Reville B., Giacinti G., 2013, MNRAS, 431, 415
- Berezhko & Ellison (1999) Berezhko E. G., Ellison D. C., 1999, ApJ, 526, 385
- Berezhko et al. (2009) Berezhko E. G., Ksenofontov L. T., Völk H. J., 2009, A&A, 505, 169
- Berezhko et al. (2012) Berezhko E. G., Ksenofontov L. T., Völk H. J., 2012, ApJ, 759, 12
- Berezhko et al. (2013) Berezhko E. G., Ksenofontov L. T., Völk H. J., 2013, ApJ, 763, 14
- Berezhko & Völk (1997) Berezhko E. G., Völk H. J., 1997, Astroparticle Physics, 7, 183
- Berezhko & Völk (2004) Berezhko E. G., Völk H. J., 2004, A&A, 427, 525
- Berezhko & Völk (2007) Berezhko E. G., Völk H. J., 2007, \apjl, 661, L175
- Blandford & Eichler (1987) Blandford R., Eichler D., 1987, \physrep, 154, 1
- Blasi (2002) Blasi P., 2002, Astroparticle Physics, 16, 429
- Blasi et al. (2005) Blasi P., Gabici S., Vannoni G., 2005, MNRAS, 361, 907
- Caprioli et al. (2009) Caprioli D., Blasi P., Amato E., Vietri M., 2009, MNRAS, 395, 895
- Cassam-Chenaï et al. (2008) Cassam-Chenaï G., Hughes J. P., Reynoso E. M., Badenes C., Moffett D., 2008, ApJ, 680, 1180
- Chevalier (1982) Chevalier R. A., 1982, ApJ, 258, 790
- Chevalier (1983) Chevalier R. A., 1983, ApJ, 272, 765
- Chiotellis et al. (2013) Chiotellis A., Kosenko D., Schure K. M., Vink J., Kaastra J. S., 2013, MNRAS, 435, 1659
- Cioffi et al. (1988) Cioffi D. F., McKee C. F., Bertschinger E., 1988, ApJ, 334, 252
- Cristofari et al. (2013) Cristofari P., Gabici S., Casanova S., Terrier R., Parizot E., 2013, MNRAS, 434, 2748
- Dogiel et al. (2002) Dogiel V. A., Schönfelder V., Strong A. W., 2002, A&A, 382, 730
- Drury (1983) Drury L. O., 1983, Reports on Progress in Physics, 46, 973
- Ellison et al. (2004) Ellison D. C., Decourchelle A., Ballet J., 2004, A&A, 413, 189
- Ellison et al. (2005) Ellison D. C., Decourchelle A., Ballet J., 2005, A&A, 429, 569
- Eriksen et al. (2011) Eriksen K. A., Hughes J. P., Badenes C., Fesen R., Ghavamian P., Moffett D., Plucinksy P. P., Rakowski C. E., Reynoso E. M., Slane P., 2011, \apjl, 728, L28
- Ferrand et al. (2010) Ferrand G., Decourchelle A., Ballet J., Teyssier R., Fraschetti F., 2010, A&A, 509, L10
- Ferrand et al. (2012) Ferrand G., Decourchelle A., Safi-Harb S., 2012, ApJ, 760, 34
- Ferrand et al. (2014) Ferrand G., Decourchelle A., Safi-Harb S., 2014, ApJ, 789, 49
- Fraschetti et al. (2010) Fraschetti F., Teyssier R., Ballet J., Decourchelle A., 2010, A&A, 515, A104
- Ghavamian et al. (2007) Ghavamian P., Blair W. P., Sankrit R., Raymond J. C., Hughes J. P., 2007, ApJ, 664, 304
- Hayato et al. (2010) Hayato A., Yamaguchi H., Tamagawa T., Katsuda S., Hwang U., Hughes J. P., Ozawa M., Bamba A., Kinugasa K., Terada Y., Furuzawa A., Kunieda H., Makishima K., 2010, ApJ, 725, 894
- Helder et al. (2012) Helder E. A., Vink J., Bykov A. M., Ohira Y., Raymond J. C., Terrier R., 2012, \ssr, 173, 369
- Jones & Ellison (1991) Jones F. C., Ellison D. C., 1991, \ssr, 58, 259
- Kang (2010) Kang H., 2010, Journal of Korean Astronomical Society, 43, 25
- Kang (2013) Kang H., 2013, Journal of Korean Astronomical Society, 46, 49
- Kang & Jones (2006) Kang H., Jones T. W., 2006, Astroparticle Physics, 25, 246
- Kang et al. (2013) Kang H., Jones T. W., Edmon P. P., 2013, ApJ, 777, 25
- Katsuda et al. (2013) Katsuda S., Long K. S., Petre R., Reynolds S. P., Williams B. J., Winkler P. F., 2013, ApJ, 763, 85
- Katsuda et al. (2010) Katsuda S., Petre R., Hughes J. P., Hwang U., Yamaguchi H., Hayato A., Mori K., Tsunemi H., 2010, ApJ, 709, 1387
- Katsuda et al. (2009) Katsuda S., Petre R., Long K. S., Reynolds S. P., Winkler P. F., Mori K., Tsunemi H., 2009, \apjl, 692, L105
- Kosenko et al. (2011) Kosenko D., Blinnikov S. I., Vink J., 2011, A&A, 532, A114
- Kosenko et al. (2010) Kosenko D., Helder E. A., Vink J., 2010, A&A, 519, A11
- Kosenko et al. (2008) Kosenko D., Vink J., Blinnikov S., Rasmussen A., 2008, A&A, 490, 223
- Koyama et al. (1995) Koyama K., Petre R., Gotthelf E. V., Hwang U., Matsuura M., Ozaki M., Holt S. S., 1995, \nat, 378, 255
- Li et al. (2011) Li W., Chornock R., Leaman J., Filippenko A. V., Poznanski D., Wang X., Ganeshalingam M., Mannucci F., 2011, MNRAS, 412, 1473
- Lopez (2014) Lopez L. A., 2014, in Ray A., McCray R. A., eds, IAU Symposium Vol. 296 of IAU Symposium, What Shapes Supernova Remnants?. pp 239–244
- Malkov & O’C Drury (2001) Malkov M. A., O’C Drury L., 2001, Reports on Progress in Physics, 64, 429
- Miceli et al. (2012) Miceli M., Bocchino F., Decourchelle A., Maurin G., Vink J., Orlando S., Reale F., Broersen S., 2012, A&A, 546, A66
- Miceli et al. (2009) Miceli M., Bocchino F., Iakubovskyi D., Orlando S., Telezhinsky I., Kirsch M. G. F., Petruk O., Dubner G., Castelletti G., 2009, A&A, 501, 239
- Morlino et al. (2010) Morlino G., Amato E., Blasi P., Caprioli D., 2010, MNRAS, 405, L21
- Morlino & Caprioli (2012) Morlino G., Caprioli D., 2012, A&A, 538, A81
- Petruk et al. (2011) Petruk O., Beshley V., Bocchino F., Miceli M., Orlando S., 2011, MNRAS, 413, 1643
- Rest et al. (2005) Rest A., Suntzeff N. B., Olsen K., Prieto J. L., Smith R. C., Welch D. L., Becker A., Bergmann M., Clocchiatti A., Cook K., Garg A., Huber M., Miknaitis G., Minniti D., Nikolaev S., Stubbs C., 2005, \nat, 438, 1132
- Schure et al. (2012) Schure K. M., Bell A. R., O’C Drury L., Bykov A. M., 2012, \ssr, 173, 491
- Slane et al. (2014) Slane P., Lee S.-H., Ellison D. C., Patnaude D. J., Hughes J. P., Eriksen K. A., Castro D., Nagataki S., 2014, ApJ, 783, 33
- Strong et al. (2010) Strong A. W., Porter T. A., Digel S. W., Jóhannesson G., Martin P., Moskalenko I. V., Murphy E. J., Orlando E., 2010, \apjl, 722, L58
- Teyssier (2002) Teyssier R., 2002, A&A, 385, 337
- Völk et al. (2008) Völk H. J., Berezhko E. G., Ksenofontov L. T., 2008, A&A, 483, 529
- Volk & McKenzie (1981) Volk H. J., McKenzie J. F., 1981, in International Cosmic Ray Conference Vol. 9 of International Cosmic Ray Conference, Characteristics of cosmic ray shocks in the presence of wave dissipation. pp 246–249
- Warren & Hughes (2004) Warren J. S., Hughes J. P., 2004, ApJ, 608, 261
- Warren et al. (2005) Warren J. S., Hughes J. P., Badenes C., Ghavamian P., McKee C. F., Moffett D., Plucinsky P. P., Rakowski C., Reynoso E., Slane P., 2005, ApJ, 634, 376
- Winkler et al. (2003) Winkler P. F., Gupta G., Long K. S., 2003, ApJ, 585, 324