Upper limits to interstellar NH+ and para-NH abundances
The understanding of interstellar nitrogen chemistry has improved significantly with recent results from the Herschel Space Observatory. To set even better constraints, we report here on deep searches for the NH+ ground state rotational transition of the lower spin ladder, with fine-structure transitions at 1 013 and 1 019 GHz, and the para-NH rotational transition at 934 GHz towards Sgr B2 (M) and G10.6 (W31C) using the Herschel Heterodyne Instrument for the Far-Infrared (HIFI). No clear detections of NH+ are made and the derived upper limits relative to the total number of hydrogen nuclei are 10-12 and 10-13 in the Sgr B2 (M) molecular envelope and in the G10.6 molecular cloud, respectively. The searches are, however, complicated by the fact that the 1 013 GHz transition lies only 2.5 km s-1 from a CH2NH line, which is seen in absorption in Sgr B2 (M), and that the hyperfine structure components in the 1 019 GHz transition are spread over 134 km s-1. Searches for the so far undetected NH anion turned out to be unfruitful towards G10.6, while the para-NH transition was tentatively detected towards Sgr B2 (M) at a velocity of 19 km s-1. Assuming that the absorption occurs at the nominal source velocity of +64 km s-1, the rest frequency would be 933.996 GHz, offset by 141 MHz from our estimated value. Using this feature as an upper limit, we found (p-NH)1011 cm-2, which implies an abundance of 10-13 in the Sgr B2 (M) molecular envelope. The upper limits for both species in the diffuse line-of-sight gas are less than 0.1 to 2 % of the values found for NH, NH2, and NH3 towards both sources, and the abundance limits are 10-11. An updated pseudo time-dependent chemical model with constant physical conditions, including both gas-phase and surface chemistry, predicts an NH+ abundance a few times lower than our present upper limits in diffuse gas and under typical Sgr B2 (M) envelope conditions. The NH abundance is predicted to be several orders of magnitudes lower than our observed limits, hence not supporting our tentative detection. Thus, while NH may be very difficult to detect in interstellar space, it could, on the other hand, be possible to detect NH+ in regions where the ionisation rates of H2 and N are greatly enhanced.
Key Words.:
ISM: abundances – ISM: molecules – Sub-millimetre: ISM – Molecular processes – Line: formation – Astrochemistry1 Introduction
An important species in the nitrogen chemistry, NH+, has for a long time been awaiting its first discovery. Besides its key chemical role in the reaction chain leading to more complex nitrogen-bearing species, NH+ has also been identified as a potential candidate for probing variations in the fine-structure constant, , and electron-to-proton mass ratio, (Beloy et al. 2011). Another undetected but interesting species in the nitrogen chemistry is the anion NH.
Searches for NH+ and NH are, however, difficult not only because of their expected very low abundances, but also since their strongest transitions lie at frequencies that are generally inaccessible to ground-based telescopes. With the launch of Herschel (Pilbratt et al. 2010; Roelfsema et al. 2012) and its sensitive Heterodyne Instrument for the Far-Infrared (HIFI), which was designed to perform high-resolution observations at frequencies 480-1250 and 1410-1910 GHz, searches for the fundamental rotational transitions of NH+ and NH became possible.
Previous searches for NH+ using Herschel-HIFI in the diffuse line-of-sight gas towards the high-mass star-forming regions G10.6 and W49N, resulted in average upper limits of the NH+ abundance relative to molecular hydrogen 10-10, and (NH+)/ % (Persson et al. 2012).
| Species | Frequencya𝑎aa𝑎aFrequencies without the nuclear hyperfine structure (hfs; Hübers et al. 2009) that are used to convert frequencies to Doppler velocities relative to the local standard at rest . Hfs components of NH+ can be found in Tables LABEL:Table:_1013_hfs_transitions–LABEL:Table:_1019_hfs_transitions. The p-NH frequency is estimated using spectroscopic data from Tack et al. (1986). | b𝑏bb𝑏bThe single sideband continuum intensity. | /c𝑐cc𝑐cThe rms noise (for a channel width of 1 km s-1) divided by . | ||
|---|---|---|---|---|---|
| G10.6 | SgrB2 | G10.6 | SgrB2 | ||
| (GHz) | (K) | (K) | (K) | (K) | |
| NH+ | 1 012.540d𝑑dd𝑑d ( and + denotes the parity). | 3.3 | 7.3 | 0.0019 | 0.0015 |
| 1 019.211e𝑒ee𝑒e. | 3.3 | 7.4 | 0.0022 | 0.0040 | |
| p-NH | 933.855f𝑓ff𝑓f. | 2.6 | 7.5 | 0.0035 | 0.0013 |
In this paper we present the results of new, deeper searches for NH+, and for the first time also for NH, towards G10.60.4 and Sgr B2 (M). Both sources are very well-known star-forming regions and extremely luminous sub-millimetre and infrared continuum sources. The ultra-compact H II region G10.60.4 in the star-forming complex W31 is located in the Galactic 30 km s-1 arm at a distance of 4.95 kpc (Sanna et al. 2014), and the Sgr B2 (M) region is one of the chemically rich sources close to the Galactic centre at a distance of 8.5 kpc (e.g. Nummelin et al. 2000; Bergin et al. 2010). We also model the abundances of NH+ and NH under four different interstellar conditions with a pseudo time-dependent chemical model, and explore how the surface chemistry, cosmic ionisation rate, and assumed initial metal abundances influence the derived abundances.
2 Spectroscopy, observations, and data reduction
The observed transitions are listed in Table LABEL:Table:_transitions. Measurements of the two fine-structure transitions in the lowest rotational transition of NH+ in its lower spin ladder were performed by Verhoeve et al. (1986) and included resolved hyperfine structure (hfs). An energy-level diagram can be found in Hübers et al. (2009, their Fig. 1). The Einstein values (Tables LABEL:Table:_1013_hfs_transitionsLABEL:Table:_1019_hfs_transitions) were derived by one of us (HSPM) from these data, using the experimental ground-state electric dipole moment of 1.988 (28) D (Mount et al. 2012), and taking additional parameters from Hübers et al. (2009) into account. The frequency of the , NH transition was taken from the Madrid molecular spectroscopy excitation (MADEX) database (Cernicharo 2011, Table LABEL:Table:_NH2m_hfs_transitions). It was calculated from the spectroscopic parameters reported by Tack et al. (1986). The uncertainties of the infrared transition frequencies are of the order of 100 MHz. While statistics may improve the prediction of transition frequencies, correlation among the spectroscopic parameters or vibration-rotation interaction may lead to significantly increased uncertainties. Botschwina et al. (1993) calculated a ground-state dipole moment of 1.311 D with an estimated uncertainty of 0.01 D.
Emission or absorption features of other species were assigned by consulting the Cologne Database for Molecular Spectroscopy (CDMS) (Müller et al. 2001, 2005), Jet Propulsion Laboratory (JPL) (Pickett et al. 1998), or MADEX catalogues. Specifically, the NH2 (Gendriesch et al. 2001), CH2NH (Dore et al. 2012), and SO2 (Müller & Brünken 2005) entries were taken from the CDMS catalogue while the methanol entry (Xu et al. 2008) was taken from the JPL catalogue.
The observations, which took place in April and September 2012, are summarised in Table LABEL:Table:_transitions and the observational identifications are found in the on-line Table LABEL:Table:_obsid. We used the dual beam switch mode and the wideband spectrometer (WBS) with a bandwidth of 41 GHz and an effective spectral resolution of 1.1 MHz ( km s-1). Two orthogonal polarisations were used in all the observations. All lines towards G10.60.4 were observed with three different overlapping frequency settings of the local oscillator (LO) to determine the sideband origin of the lines since HIFI uses double sideband (DSB) receivers. Towards Sgr B2 (M) we used the spectral scan mode and eight different overlapping LO settings because of its extreme density of emission lines.
The pointings were centred at = 17h47m20 6, 23 03.2 (2000) for Sgr B2 (M), and = 18h10m28 7, = 19∘ 55 50.0 (2000) for G10.60.4. The source systemic velocities are 58–69 and km s-1 for Sgr B2 (M) and G10.60.4, respectively. Absorptions in the source molecular clouds are centred at +64 and -0.5 km s-1, and the foreground gas along the respective sight-line is detected in absorption from 140 to 27, and 10 to 55 km s-1.
The data were reprocessed using the hifiPipeline task in HIPE version 9.0, up to level 2 providing fully calibrated DSB spectra for G10.60.4 on the antenna temperature intensity scale where the lines are calibrated to single sideband (SSB) and the continuum to DSB. For the Sgr B2 (M) observations, we used in addition the doDeconvolution task up to level 2.5 to provide fully calibrated SSB spectra. The FitHifiFringe task was then used to fit and remove residual ripples in the spectra, except for the NH+ 1 019 GHz data towards Sgr B2 (M) since this spectrum had too many spectral features. The G10.60.4 data quality is excellent with very low intensity ripples, with good agreement between the three LO-tunings, and without any visible contamination from the image sidebands.
The FITS files were exported to the spectral line
software package
xs222http://www.chalmers.se/rss/oso-en/observations/data-
reduction-software,
which was used in the subsequent data reduction.
All tunings and both polarisations were included in the averaged noise-weighted spectra for all transitions,
which were convolved to a channel width of 1 kms-1.
Baselines of order five were removed from the G10.60.4 spectra, and of order
three and seven from the
Sgr B2 (M) NH and NH+ 1 013 GHz spectra (average added afterwards).
No baseline was removed from the Sgr B2 (M) NH+ 1 019 GHz spectrum.
3 Results
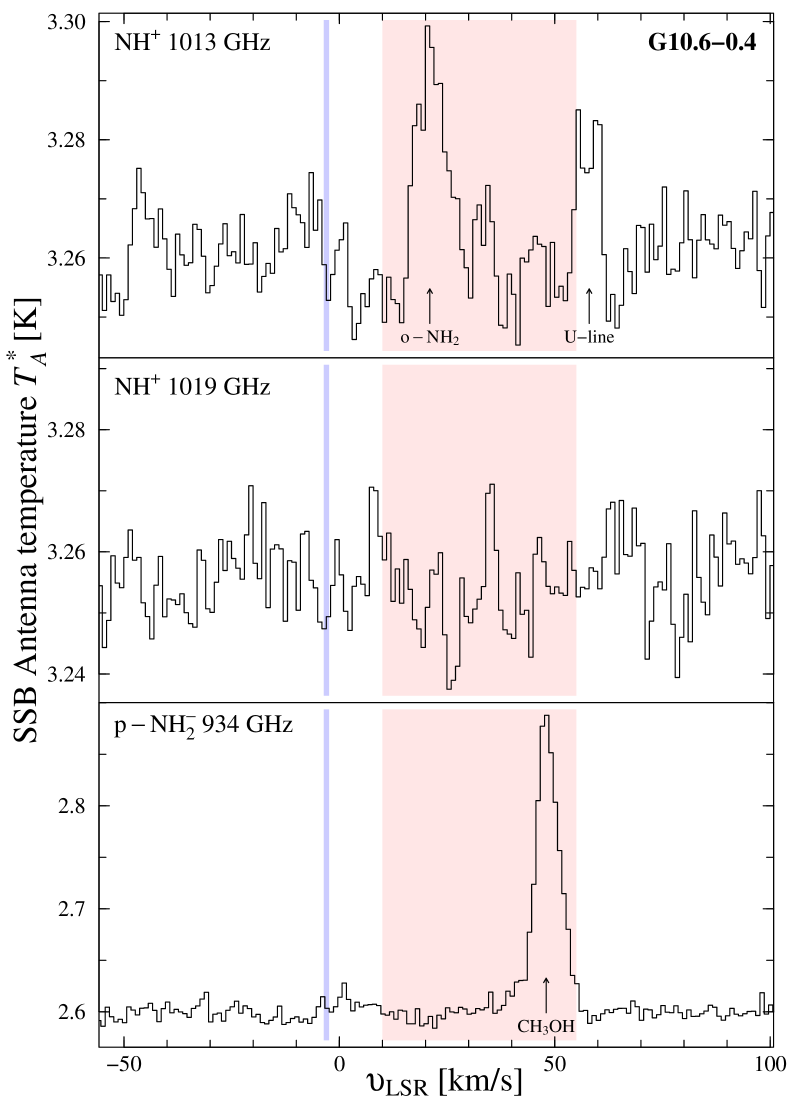
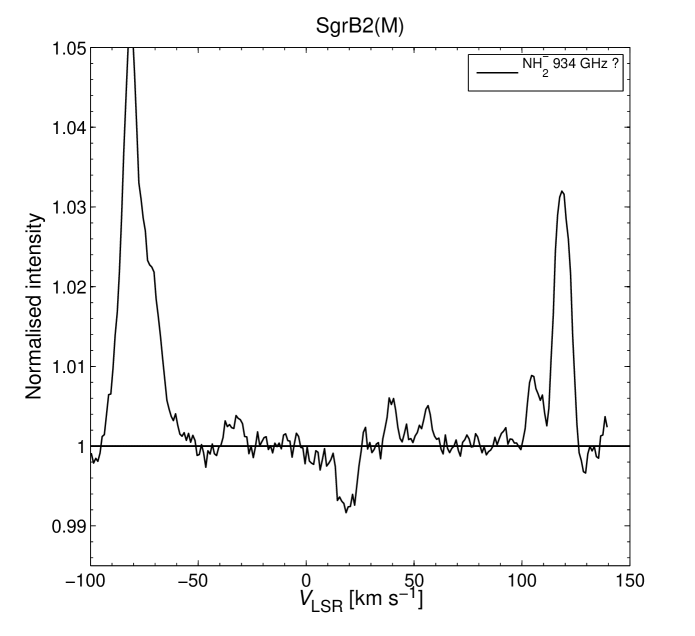
Figures 1–2 show the averaged WBS spectra of all observed transitions as a function of the local standard of rest velocity, . The continuum and rms are given in Table LABEL:Table:_transitions. We performed an unbiased search for emission and absorption lines from NH+ and para-NH in the source molecular clouds, and absorption from diffuse or translucent gas along the lines-of-sight. Despite the low noise levels, no detections are found in the G10.60.4 data (Fig. 1). Column densities are therefore 3 upper limits, estimated with a typical line width (4 km s-1) and the total line-of-sight velocity range. The emission line visible in the NH+ 1 013 GHz band (upper panel) at +21 km s-1 is identified as ortho-NH2 .
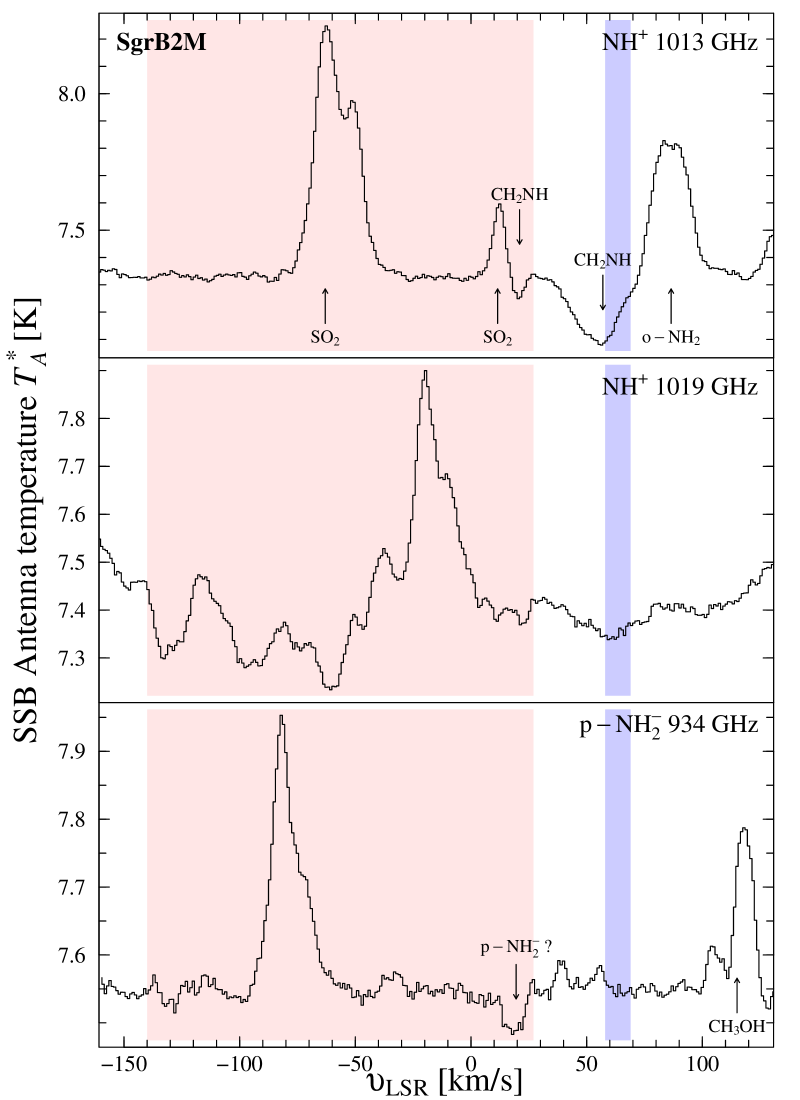
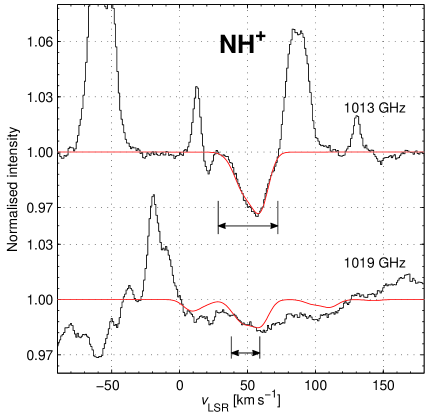
Towards Sgr B2 (M), we find two absorption features at km s-1 in both NH+ spectra (upper and middle panels in Fig. 2). It is to be noted that the 1 013 and 1 019 GHz lines are expected to show very different line profiles since they both have 14 hfs components and are spread over velocity ranges of 26 and 134 km s-1, respectively. To check whether the observed line profiles fit the respective NH+ hfs, we model the absorption of both lines using Gaussian optical depth profiles generated for each hfs component. These profiles are made to fit the observations under the condition that the and line width are the same for both transitions (cf. Method I in Persson et al. 2012). Assuming a sideband gain ratio of unity, we calculate the line opacities as , where is the SSB antenna temperature. As seen in Fig. 5 (on-line material) the fit to the 1 013 GHz line shows a very good agreement with the observed line profile, whereas the 1 019 GHz fit suggests either that the detection is not real, or that a considerable part of the absorption comes from other species, or that it is (partly) caused by remaining ripples which we were not able to remove.
| Line-of-sighta𝑎aa𝑎aThe limits are estimated over the velocity ranges listed in column 2. | ||||||||||
| Source | b𝑏bb𝑏bUsing the high temperature ortho-to-para (OPR) limit of 3 for NH2. | c𝑐cc𝑐cUsing OPR(NH (Persson et al. 2012). | (p-NH | b𝑏bb𝑏bUsing the high temperature ortho-to-para (OPR) limit of 3 for NH2. | c𝑐cc𝑐cUsing OPR(NH (Persson et al. 2012). | (p-NH | ||||
| (km s-1) | (cm-2) | (%) | (%) | (%) | (cm-2) | (%) | (%) | |||
| Sgr B2 | 140-27 | 1012 | 1011 | 10-11d𝑑dd𝑑d cm-2 (Garwood & Dickey 1989; Monje et al. 2011). | 10-11d𝑑dd𝑑d cm-2 (Garwood & Dickey 1989; Monje et al. 2011). | |||||
| G10.6 | 10-55 | 1012 | 1012 | 10-11e𝑒ee𝑒e cm-2 ( from Winkel et al. (in prep.) and from Godard et al. (2012)) | 10-11e𝑒ee𝑒e cm-2 ( from Winkel et al. (in prep.) and from Godard et al. (2012)) | |||||
| Source molecular cloud/envelope | ||||||||||
| Sgr B2 | 57–68 | 1011 | 1011 | 10-12f𝑓ff𝑓f1023 cm-2 in the Sgr B2 (M) molecular envelope (Lis & Goldsmith 1989). | 10-13f𝑓ff𝑓f1023 cm-2 in the Sgr B2 (M) molecular envelope (Lis & Goldsmith 1989). | |||||
| G10.6 | 3 | 1012 | 1012 | 10-13g𝑔gg𝑔g1024 cm-2 in the G10.60.4 molecular cloud (Fazio et al. 1978) assuming that NH+ and NH are most likely to be seen in absorption thereby probing half of the total column density that is in front of the continuum source. | 10-13g𝑔gg𝑔g1024 cm-2 in the G10.60.4 molecular cloud (Fazio et al. 1978) assuming that NH+ and NH are most likely to be seen in absorption thereby probing half of the total column density that is in front of the continuum source. | |||||
Despite the agreement of the fits, we ascribe the largest part of the feature in the 1 013 GHz spectrum to CH2NH. This species has two transitions with similar line strengths close to NH+ at 1 013 GHz: (with K) only +8.5 MHz (2.5 km s-1) from the NH+ line, and seen as a narrow absorption at 21 km s-1 in Fig. 2 (upper panel). This line, however, blends with the SO2 (1 012.673 GHz) emission and is therefore easily missed. Our identification is also supported by previous observations of CH2NH in both absorption () and emission towards Sgr B2 (M) (Nummelin et al. 2000). We modelled the SO2 emission, both CH2NH absorptions, and the o-NH2 emission line wing (seen at 70 km s-1 in Fig. 2, upper panel) in order to subtract these lines in the search for any remaining weak NH+ absorption. More details of the modelling are found in on-line Sect. A, and all modelled lines are shown in Fig. 6. After subtraction of the modelled lines, we find a weak remaining absorption feature at = 69 km s-1 with an integrated opacity of 0.08 km s-1. This feature is considered as an upper limit of NH+ in the SgrB2 (M) molecular envelope. An unidentified remaining absorption feature is also seen at 45.5 km s-1 with an integrated opacity of 0.19 km s-1. Both these features are, however, very weak and may well be remaining artefacts from our modelling or ripples in the baseline.
In the 934 GHz band we find an unidentified absorption feature at km s-1 towards Sgr B2 (M) with a line width of km s-1 and an integrated opacity of 0.09 km s-1 (lower panel in Fig. 2). This feature is used as an upper limit to the para-NH line. If the absorption is caused by para-NH, it implies a rest frequency of 933.973–934.009 GHz for this transition, which is 118–154 MHz higher than our estimated frequency assuming that the nominal source velocity is between 56 and 68 km s-1. Results of quantum chemical calculations on NH were recently reported employing high level coupled cluster calculations with additional correction and large basis sets with extrapolation to infinite basis set size (Huang & Lee 2009). Using their best spectroscopic parameters, a frequency of 932.726 GHz is derived for the transition. The level of agreement with the value derived from the experimental spectroscopic parameters corresponds to the one expected under favourable conditions and does not permit exclusion of the Sgr B2 (M) absorption feature as being potentially due to NH.
We convert the upper limits of NH+ opacities to column densities with the non-equilibrium homogeneous radiative transfer code RADEX444 http://www.sron.rug.nl/vdtak/radex/index.shtml (van der Tak et al. 2007) to correct for possible population of molecules in unobserved excited levels. We use cm-3 and a kinetic temperature K for the diffuse line-of-sight conditions, and cm-3 and K for the denser envelopes of the source molecular clouds. The results are not very sensitive to changes in density because of the high critical density of the nitrogen hydrides ( cm-3). For the line-of-sight, we use the average Galactic background radiation in the solar neighbourhood plus the cosmic microwave background radiation as background radiation field. In addition, for the source molecular clouds we include their respective observed spectral energy distribution.
Since no collisional coefficients are available for NH, we estimate the column density of molecules in the ground-state using
|
|
(1) |
The resulting upper limits for the column density and abundance with respect to the total column of hydrogen are found in Table LABEL:Table:_columns_and_abundances. Here we also present limiting abundance ratios, relative to the chemically related species NH, NH2, and NH3 along the line-of-sight gas towards both sources. Column densities towards G10.60.4 (averaged over km s-1) are taken from Persson et al. (2012). A full spectral scan of Sgr B2 (M) using Herschel-HIFI has been performed by the HEXOS Key Programme (Bergin et al. 2010). From these data, spectra of the ground-state rotational transitions of NH, NH2, and NH3 were extracted and compared to our data. Resulting ratios are consistent with the findings in Persson et al. (2010), and is in agreement with Wirström et al. (2010). We reduced these data in a manner similar to that described in Sect. 2 for our Sgr B2 (M) data, and fitted Gaussian optical depth profiles to the absorption lines to estimate the column densities.
4 Chemical modelling
In Persson et al. (2010) we modelled abundances of the nitrogen hydrides with a pseudo time-dependent chemical model with constant physical conditions, taking both the gas-phase and grain surface chemistry into account, using the Ohio State University (OSU) gas-grain code (Hasegawa et al. 1992). The predicted NH+ abundance was at most in translucent clouds with .
In this paper, we have updated the chemical models to include the formation and destruction of NH. The expanded reaction network also includes high temperature reactions (Harada et al. 2010; Hassel et al. 2011) and presently considers 7 176 reactions involving a total of 669 gaseous and surface species.
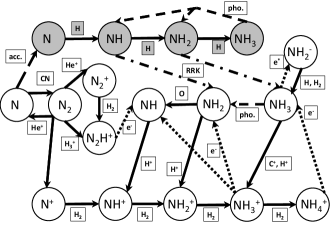
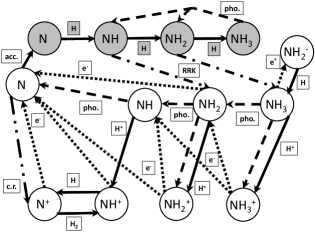
Figure 3 shows two chemical networks outlining the major reaction pathways involving nitrogen hydrides at years, under translucent and diffuse gas conditions. In both cases, the production of NH+ purely by gas-phase processes largely depends on a sufficient source of N+, which can be formed by cosmic ray ionisation of N or by reactions of He+ with N2 or CN. It should be noted that H does not react rapidly with N, hence the latter route is the most important one in denser gas, while the former dominates in diffuse gas. In standard gas-phase ion-molecule chemistry, NH+ then initiates the production of nitrogen hydrides (NH, NH2, and NH3) via subsequent reactions with H2 and electron recombination. This is, however, not effective in diffuse gas where hydrogen exists mostly in atomic form. Included in the chemical networks of Fig. 3 is also the surface reaction pathway for the formation of nitrogen hydrides, in which H atoms are added to N, and NH3 is in turn destroyed by photo-dissociation. The species NH2 and NH3 can then be liberated into the gas phase through non-thermal desorption via the Rice-Ramsperger-Kassel (RRK) mechanism (Garrod et al. 2006, 2007), where the species desorb as a result of exothermic surface reactions with an efficiency governed by the parameter , which is typically set to 0.01. We have also considered the addition of photodesorption of NH3 with an assumed yield of molecules/UV photon in the absence of a measured yield, based on the formulation of Öberg et al. (2007) for desorption of CO by both the direct interstellar radiation field and the field caused by cosmic rays. The direct photodesorption process is of secondary importance to the RRK mechanism for the formation of NH3(gas) in the translucent gas models and of even lesser importance in the diffuse gas models. In the diffuse model, the major form of nitrogen is predominantly elemental N at 106 yrs, while in the the translucent model, elemental N, NH3(ice), and N2(gas) are the major forms. In addition to the processes shown here, there are some minor processes, such as , , and NO, that return some elemental N to the gas phase from less abundant forms, but these are omitted from Fig. 3.
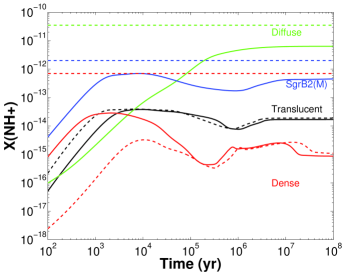
The abundance of NH+ thus directly depends on a N+ source and the cosmic ionisation rate . Radiative recombination of N+ is a slow process; therefore, in the presence of just a small H2 fraction, N+ is removed mainly by N , which is the source reaction of NH+. Thus almost every cosmic ray ionisation of N will produce NH+. Reactions with H2 and with electrons removes NH+, but the reactions with H2 dominate as long as e-/H. Within this limit, independent of density and temperature, the NH+ fractional abundance is of the order of 10-12 at cm-3 and .
The NH anion can form via the dissociative attachment process through electron-impact on NH3
| (2) |
where represents an energetic electron. The energetic threshold for this process is eV. The possible destruction processes of NH include photo-detachment, reactions with H2, and mutual neutralisation in reactions with the most abundant positive ions. If the reaction with H2 is the dominant loss process, then the density of NH at K will be of the order of
| (3) |
which immediately suggests a very low NH abundance. A second formation route of NH is via slow radiative attachment of electrons to NH2
| (4) |
Finally, if the anion is formed in a local region rich in atomic rather than molecular hydrogen, it can be destroyed by associative attachment with atomic hydrogen,
| (5) |
or competitively via photo-detachment. Details about the different formation and destruction routes of NH are found in the on-line appendix B.
| Model | a𝑎aa𝑎aThe total hydrogen density . | b𝑏bb𝑏bThe cosmic ionisation rate of molecular hydrogen (cf. Indriolo et al. 2012). | Metallicityc𝑐cc𝑐cThe assumed initial metal abundances are found in Table 8. | |||
|---|---|---|---|---|---|---|
| (mag) | (cm-3) | (K) | (K) | (s-1) | ||
| Diffused𝑑dd𝑑dTypical conditions in respective cloud type (e.g. Snow & McCall 2006). | 0.5 | 70 | 100 | 17 | High | |
| Translucentd𝑑dd𝑑dTypical conditions in respective cloud type (e.g. Snow & McCall 2006). | 3 | 30 & 50 | 10 | Low | ||
| Densed𝑑dd𝑑dTypical conditions in respective cloud type (e.g. Snow & McCall 2006). | 10 | 10 & 30 | 10 | Low | ||
| Sgr B2 (M) envelopee𝑒ee𝑒eLis & Goldsmith (1989), van der Tak et al. (2006) and Ott et al. (2014). | 300 | 4 | 40 | 10 | 4 | High |
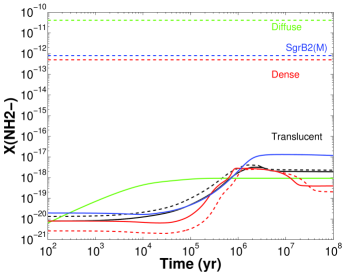
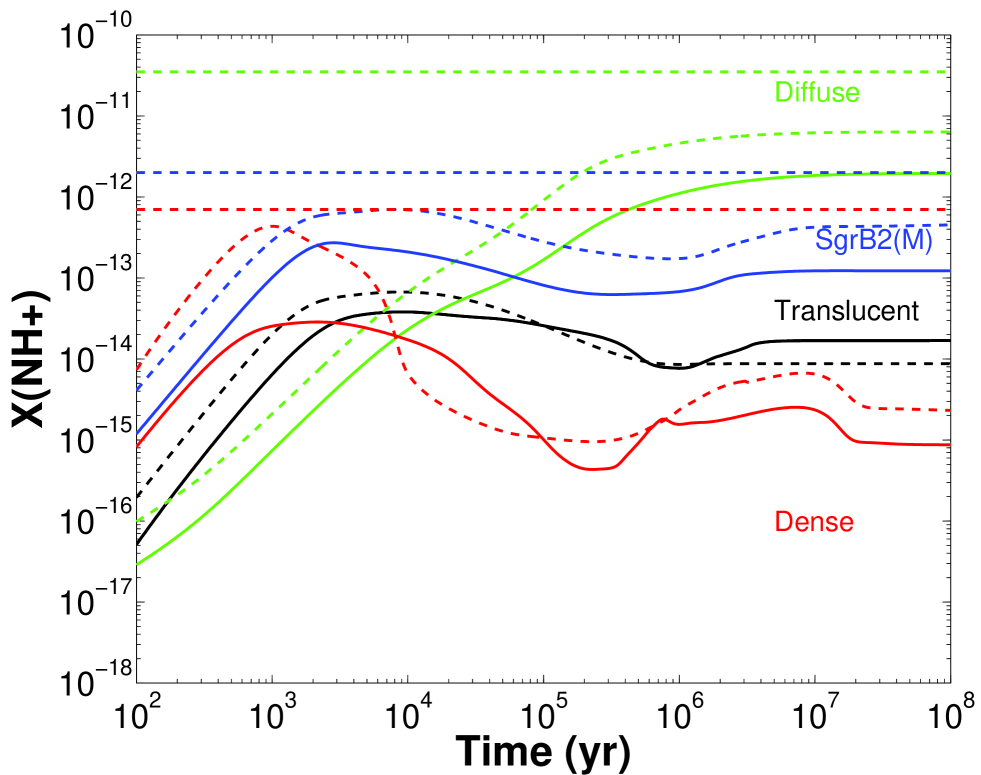
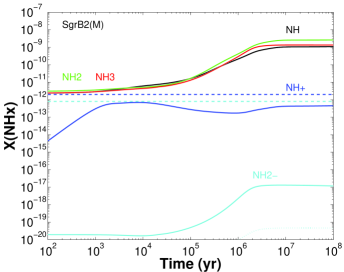
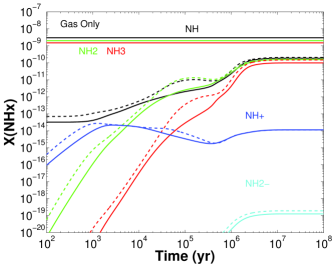
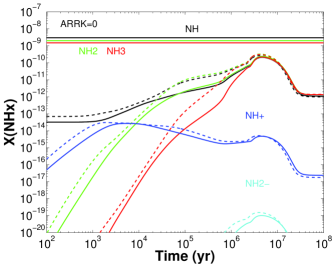
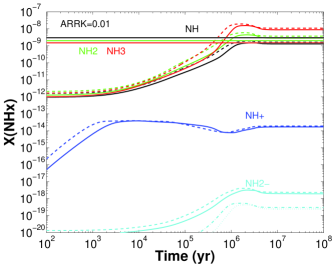
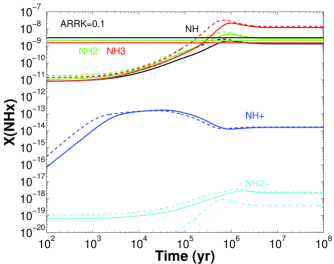
Figure 4 shows the resulting temporal evolution of the NH+ and NH abundances using the updated chemical network and a typical active non-thermal desorption efficiency . We have modelled both species under four different physical conditions: typical dense gas, translucent gas, diffuse gas, and a special model for the Sgr B2 (M) molecular envelope. All model parameters are found in Table LABEL:Table:_chemical_model_parameters.
The choice of initial elemental abundance values vary for the different models. For the translucent and dense models, we adopt “low metal” initial abundances, whereas we adopt a set of “high metal” initial abundances for the diffuse and Sgr B2 (M) models. The “low metal” values account for the incorporation of elements into refractory grains on the basis of observations of Oph (Graedel et al. 1982; Garrod et al. 2007), and the “high metal” values were developed to estimate the abundances if all of this material initially existed in the gas phase (Wakelam & Herbst 2008; Garrod & Herbst 2006). The different values are listed in Table 8, and the effects of the adoption on abundance of NH+ is explored in Fig. 8, where the choice of high metal abundances can be seen to increase the abundance of NH+ towards the observational upper limit for the diffuse model. The same trend is found for the Sgr B2 (M) and dense models, however, not for the translucent model.
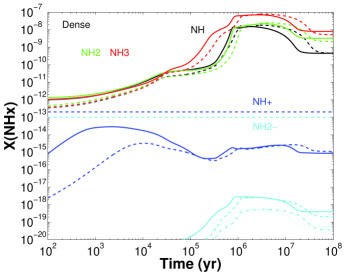
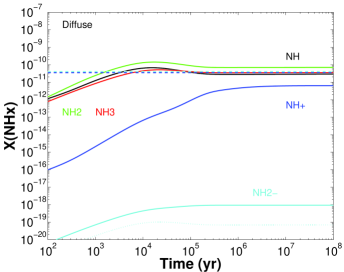
The dense models are representative of the massive sources themselves, the translucent cloud conditions are traced by, for example, the NH, NH2, and NH3 absorptions along the sight-lines (Persson et al. 2012), and the diffuse cloud conditions are representative of the line-of-sight clouds, from where we believe NH+ originates. The Sgr B2 (M) model reflects the very special conditions found in this source. In the on-line Fig. 9 we show the four models again, but this time with the addition of NH, NH2, and NH3 for comparative purposes. We note that the above results for the translucent model are very similar to the models from Persson et al. (2010).
To check how the surface chemistry affects the resulting abundances we also show (i) gas and surface chemistry and inactive non-thermal desorption efficiency ; (ii) gas and surface chemistry with two different desorption efficiencies; and (iii) pure gas phase chemistry for the translucent model in Fig. 10 (on-line material). This figure, as well as Fig. 3, illustrates that the surface chemistry with reactive desorption is a key factor in the formation of NH2 and NH3, followed in importance by the addition of electrons to NH. We find, however, that our models are not very sensitive to the exact value of the desorption probability, since the model with gives very similar results to the model using .
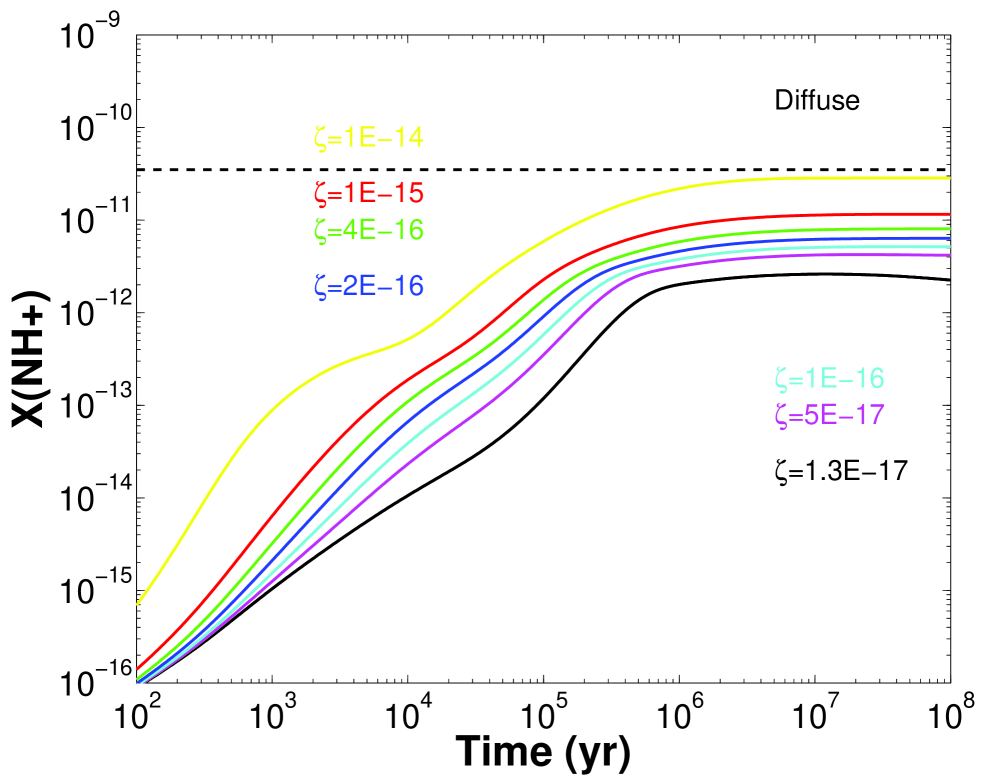
Since a high cosmic ray ionisation rate is crucial for the production of NH+, our results are sensitive to its assumed value. In the on-line Figure 11 we show, therefore, how the NH+ abundance varies in the diffuse model using seven different values of . The NH+ abundance increases by more than an order of magnitude and reaches the observational limit when increases from to 10-14 s-1. The other models also show similar trends.
The rotational transitions of NH+ observed by us provide a sensitive way to search for this ion in absorption. There are also other kinds of transitions suitable, however, for interstellar absorption studies as pointed out by de Almeida & Singh (1982). For example, the ground-state -doubling transition at 13.6 GHz is observable from Earth and now has well determined hfs frequencies (Hübers et al. 2009). If we neglect hfs in both the lowest pure-rotational and -doubling transitions and consider a column density of cm-2, then the integrated optical depths in the 1 013 and 1 019 GHz lines are km s-1 while the corresponding integrated optical depth at 13.6 GHz is km s-1. The electronic transitions at blue and ultraviolet wavelengths are slightly more sensitive than the 13.6 GHz transition. Based on the oscillator strengths tabulated by de Almeida & Singh (1982), the corresponding values of are 0.009, 0.01, and 0.007 km s-1 in the A - X (0,0), (1,0), and (2,0) bands near 464, 434, and 410 nm wavelength, respectively. The ultraviolet band C - X (0,0) near 289 nm will yield km s-1 under the same conditions. The existing upper limits on visible and UV lines of NH+ (Snow 1976, 1980; Jenkins et al. 1973) were not very sensitive compared to the submm-wave results presented here. As far as we are aware, no limits have been derived from more modern optical data. Possible archival spectra of stars behind diffuse molecular clouds in which equivalent widths of mÅ could easily be measured in the 434 nm band corresponding to a column density cm-2, slightly better than the best limit in Table LABEL:Table:_columns_and_abundances.
5 Conclusions
Our derived NH+ upper limits are an order of magnitude lower than previous estimates (Persson et al. 2012). On the other hand, our chemical modelling suggests that the NH+ abundance may still be a few times lower than our present limits in diffuse gas and under typical Sgr B2 (M) molecular envelope conditions, and several orders of magnitude lower in translucent and dense gas. Since a high ionisation rate is crucial for high NH+ abundances, future searches should focus on regions with greatly enhanced ionisation rates (cf. Indriolo et al. 2012). Searches for NH+ are, however, complicated by the fact that one of its lowest rotational transitions at 1 013 GHz lies only 2.5 km s-1 from the CH2NH line seen in absorption in Sgr B2 (M).
In contrast to NH+, the NH anion has very low abundances in all models, not supporting our tentative detection in Sgr B2 (M). This suggests that this species will be very difficult to detect in interstellar space.
Acknowledgements.
HIFI has been designed and built by a consortium of institutes and university departments from across Europe, Canada, and the United States under the leadership of SRON, Netherlands Institute for Space Research, Groningen, The Netherlands and with major contributions from Germany, France, and the US. Consortium members are: Canada: CSA, U.Waterloo; France: CESR, LAB, LERMA, IRAM; Germany: KOSMA, MPIfR, MPS; Ireland, NUI Maynooth; Italy: ASI, IFSI-INAF, Osservatorio Astrofisico di Arcetri-INAF; Netherlands: SRON, TUD; Poland: CAMK, CBK; Spain: Observatorio Astronómico Nacional (IGN), Centro de Astrobiología (CSIC-INTA). Sweden: Chalmers University of Technology - MC2, RSS & GARD; Onsala Space Observatory; Swedish National Space Board, Stockholm University - Stockholm Observatory; Switzerland: ETH Zurich, FHNW; USA: Caltech, JPL, NHSC. C.P., J.H.B., and E.S.W. acknowledge generous support from the Swedish National Space Board. E.H. acknowledges the support of NASA for research related to the Herschel HIFI programme. H.S.P.M. is very grateful to the Bundesministerium für Bildung und Forschung (BMBF) for financial support aimed at maintaining the Cologne Database for Molecular Spectroscopy, CDMS. H.M.C acknowledges the European Research Council (ERC-2010-StG, Grant Agreement no. 259510-KISMOL) for financial support. Support for this work was provided by NASA through an award issued by JPL/Caltech.References
- Beloy et al. (2011) Beloy, K., Kozlov, M. G., Borschevsky, A., et al. 2011, Phys. Rev. A, 83, 062514
- Bergin et al. (2010) Bergin, E. A., Phillips, T. G., Comito, C., et al. 2010, A&A, 521, L20
- Black (2014) Black, J. H. 2014, A&A, in prep.
- Botschwina et al. (1993) Botschwina, P., Seeger, S., & Flügge, J. 1993, J. Chem. Phys., 99, 8349
- Cernicharo (2011) Cernicharo, J. 2011, EAS Publication Series Vol. 58, Proceedings of the European Conference on Laboratory Astrophysics, 58, 251
- de Almeida & Singh (1982) de Almeida, A. A. & Singh, P. D. 1982, A&A, 113, 199
- Dore et al. (2012) Dore, L., Bizzocchi, L., & Degli Esposti, C. 2012, A&A, 544, A19
- Dulieu et al. (2013) Dulieu, F., Congiu, E., Noble, J., et al. 2013, Sci. Reports, 3, 1338
- Fazio et al. (1978) Fazio, G. G., Lada, C. J., Kleinmann, D. E., et al. 1978, ApJ, 221, L77
- Garrod et al. (2006) Garrod, R., Park, I. H., Caselli, P., & Herbst, E. 2006, Faraday Discussions, 133, 51
- Garrod & Herbst (2006) Garrod, R. T. & Herbst, E. 2006, A&A, 457, 927
- Garrod et al. (2007) Garrod, R. T., Wakelam, V., & Herbst, E. 2007, A&A, 467, 1103
- Garwood & Dickey (1989) Garwood, R. W. & Dickey, J. M. 1989, ApJ, 338, 841
- Gendriesch et al. (2001) Gendriesch, R., Lewen, F., Winnewisser, G., & Müller, S. P. 2001, Journal of Molecular Structure, 599, 293
- Godard et al. (2012) Godard, B., Falgarone, E., Gerin, M., et al. 2012, A&A, 540, A87
- Graedel et al. (1982) Graedel, T. E., Langer, W. D., & Frerking, M. A. 1982, ApJS, 48, 321
- Harada et al. (2010) Harada, N., Herbst, E., & Wakelam, V. 2010, ApJ, 721, 1570
- Hasegawa et al. (1992) Hasegawa, T. I., Herbst, E., & Leung, C. M. 1992, ApJS, 82, 167
- Hassel et al. (2011) Hassel, G. E., Harada, N., & Herbst, E. 2011, ApJ, 743, 182
- Herbst & Osamura (2008) Herbst, E. & Osamura, Y. 2008, ApJ, 679, 1670
- Huang & Lee (2009) Huang, X. & Lee, T. J. 2009, J. Chem. Phys., 131, 104301
- Hübers et al. (2009) Hübers, H., Evenson, K. M., Hill, C., & Brown, J. M. 2009, J. Chem. Phys., 131, 034311
- Indriolo et al. (2012) Indriolo, N., Neufeld, D. A., Gerin, M., et al. 2012, ApJ, 758, 83
- Jenkins et al. (1973) Jenkins, E. B., Drake, J. F., Morton, D. C., et al. 1973, ApJ, 181, L122
- Lis & Goldsmith (1989) Lis, D. C. & Goldsmith, P. F. 1989, ApJ, 337, 704
- Monje et al. (2011) Monje, R. R., Emprechtinger, M., Phillips, T. G., et al. 2011, ApJ, 734, L23
- Mount et al. (2012) Mount, B. J., Redshaw, M., & Myers, E. G. 2012, Phys. Rev. A, 85, 012519
- Müller & Brünken (2005) Müller, H. S. P. & Brünken, S. 2005, Journal of Molecular Spectroscopy, 232, 213
- Müller et al. (2005) Müller, H. S. P., Schlöder, F., Stutzki, J., & Winnewisser, G. 2005, Journal of Molecular Structure, 742, 215
- Müller et al. (2001) Müller, H. S. P., Thorwirth, S., Roth, D. A., & Winnewisser, G. 2001, A&A, 370, L49
- Nummelin et al. (2000) Nummelin, A., Bergman, P., Hjalmarson, Å., et al. 2000, ApJS, 128, 213
- Öberg et al. (2007) Öberg, K. I., Fuchs, G. W., Awad, Z., et al. 2007, ApJ, 662, L23
- Ott et al. (2014) Ott, J., Weiß, A., Staveley-Smith, L., Henkel, C., & Meier, D. S. 2014, ApJ, 785, 55
- Otto et al. (2008) Otto, R., Mikosch, J., Trippel, S., Weidemüller, M., & Wester, R. 2008, Physical Review Letters, 101, 063201
- Persson et al. (2010) Persson, C. M., Black, J. H., Cernicharo, J., et al. 2010, A&A, 521, L45 (Paper I)
- Persson et al. (2012) Persson, C. M., De Luca, M., Mookerjea, B., et al. 2012, A&A, 543, A145 (Paper II)
- Pickett et al. (1998) Pickett, H. M., Poynter, I. R. L., Cohen, E. A., et al. 1998, Journal of Quantitative Spectroscopy and Radiative Transfer, 60, 883
- Pilbratt et al. (2010) Pilbratt, G., Riedinger, J. R., Passvogel, T., et al. 2010, A&A, 518, L1
- Rawat et al. (2008) Rawat, P., Prabhudesai, V. S., Rahman, M. A., Ram, N. B., & Krishnakumar, E. 2008, International Journal of Mass Spectrometry, 277, 96
- Roelfsema et al. (2012) Roelfsema, P. R., Helmich, F. P., Teyssier, D., et al. 2012, A&A, 537, A17
- Sanna et al. (2014) Sanna, A., Reid, M. J., Menten, K. M., et al. 2014, ApJ, 781, 108
- Sharp & Dowell (1969) Sharp, T. E. & Dowell, J. T. 1969, J. Chem. Phys., 50, 3024
- Snow & McCall (2006) Snow, T. P. & McCall, B. J. 2006, ARA&A, 44, 367
- Snow (1976) Snow, Jr., T. P. 1976, ApJ, 204, L127
- Snow (1980) Snow, Jr., T. P. 1980, in IAU Symposium, Vol. 87, Interstellar Molecules, ed. B. H. Andrew, 247–254
- Tack et al. (1986) Tack, L. M., Rosenbaum, N. H., Owrutsky, J. C., & Saykally, R. J. 1986, J. Chem. Phys., 85, 4222
- van der Tak et al. (2006) van der Tak, F. F. S., Belloche, A., Schilke, P., et al. 2006, A&A, 454, L99
- van der Tak et al. (2007) van der Tak, F. F. S., Black, J. H., Schöier, F. L., Jansen, D. J., & van Dishoeck, E. F. 2007, A&A, 468, 627
- Verhoeve et al. (1986) Verhoeve, P., Ter Meulen, J. J., Meerts, W. L., & Dyamanus, A. 1986, Chemical Physics Letters, 132, 213
- Wakelam & Herbst (2008) Wakelam, V. & Herbst, E. 2008, ApJ, 680, 371
- Wickham-Jones et al. (1989) Wickham-Jones, C. T., Ervin, K. M., Ellison, G. B., & Lineberger, W. C. 1989, J. Chem. Phys., 91, 2762
- Wirström et al. (2010) Wirström, E. S., Bergman, P., Black, J. H., et al. 2010, A&A, 522, A19
- Xu et al. (2008) Xu, L.-H., Fisher, J., Lees, R. M., et al. 2008, Journal of Molecular Spectroscopy, 251, 305
Appendix A Modelling the CH2NH absorption lines
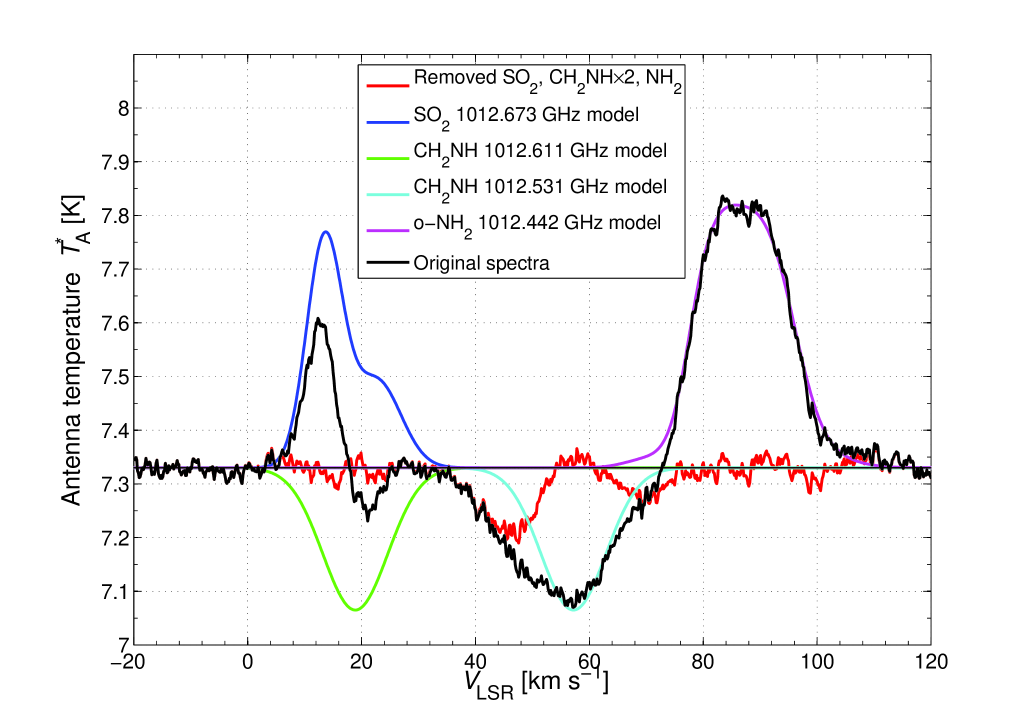
CH2NH has two transitions with similar line strengths close to NH+ at 1 013 GHz: (1012.531 GHz) with K only +8.5 MHz (2.5 km s-1) from NH+, and (1012.661 GHz) seen as a narrow absorption at 21 km s-1. It should be noted that this line blends with the SO2 (1 012.673 GHz) emission. We model the SO2 emission, both CH2NH absorptions, and the o-NH2 emission line wing (seen at 70 km s-1) in order to subtract these lines in the search for any remaining weak NH+ absorption. All modelled lines are shown in Fig. 6 together with the original data in black and the resulting spectra after subtraction of the above described lines is shown in red.
The numerous SO2 lines observed in our band (e.g. and ), as well as in the HEXOS spectral line survey, are used to reconstruct the SO2 1 012.673 GHz line. The true CH2NH absorption is then found by comparing the reconstructed SO2 emission with the observed line profile. Finally, the modelled CH2NH absorption is used as a template for the CH2NH absorption at 1012.531 GHz since their line strengths are similar. We use RADEX to check our modelled CH2NH lines together with the 225 GHz () line observed in absorption by Nummelin et al. (2000). The integrated opacities of these three lines are matched using a density of cm-3, a kinetic temperature of K, a column density cm-2, and a line width of km s-1 which supports the above modelling and results. After subtracting all modelled lines, we find a weak remaining absorption feature at = 69 km s-1 with an integrated opacity of 0.08 km s-1, which is used as an upper limit to NH+.
Appendix B NH chemistry
The NH anion can form via the dissociative attachment process through electron-impact on NH3
| (6) |
where represents an energetic electron. The energetic threshold for this process is eV, potentially leading to an unusually high production rate. At kinetic temperatures of the order of 100 K or less, the thermal electrons have a characteristic energy less than 9 meV. Therefore, the hot electrons required to form the anion are extremely superthermal. A self-consistent treatment of the electron speed distribution in the weakly ionised interstellar medium is currently being investigated (Black 2014, in prep). The crucial energy range for reaction (8) is 3.8 to 8.5 eV. In photon-dominated regions, including diffuse molecular clouds, such electrons are produced mainly by the same photoelectric effect involving dust and large molecules that dominates the heating of the gas. Energetic electrons are thermalised primarily by collisions with neutrals (H and H2), rather than by elastic collisions with thermal electrons, as long as the fractional ionisation is less than 10-3. The cross-section, , for the dissociative attachment process has a peak value of 1.6 Mb near eV, with vanishing values at and at eV (Sharp & Dowell 1969; Rawat et al. 2008). The number density of electrons integrated over the interval 3.857 to 8.5 eV is 9.9 cm-3. We find a production rate for NH by reaction (8) of
| (7) |
The possible destruction processes of NH include photo-detachment, reactions with H2, and mutual neutralisation in reactions with the most abundant positive ions. The reaction with H2,
| (8) |
is known to be rapid at low temperatures around 20 K but to decrease with increasing temperature (Otto et al. 2008). If the reaction with H2 is the dominant loss process, then the density of NH at K will be of the order of
| (9) |
which immediately suggests a very low NH abundance.
A second formation route of NH is via slow radiative attachment of electrons to NH2
| (10) |
Radiative attachment via emission from excited vibrational states has been calculated to be an efficient process to produce negative molecular ions with large electron affinities (3-4 eV) and at least four atoms (Herbst & Osamura 2008). The NH anion is smaller than this limit and has only a moderate electron affinity of 0.771 eV (Wickham-Jones et al. 1989). Using Eq. (11) in Herbst & Osamura (2008), we estimate the rate coefficient for radiative attachment via the vibrational mechanism to be only cm3 s-1. The process is at most competitive with dissociative attachment of NH3 via non-thermal electrons, and does not change the conclusion that the NH anion has a low abundance. Finally, if the anion is formed in a local region rich in atomic rather than molecular hydrogen, it can be destroyed by associative attachment with atomic hydrogen,
| (11) |
or competitively via photo-detachment.
Appendix C Chemical models

Appendix D Tables
| Frequency | gu | a𝑎aa𝑎aThe velocity offset from the strongest hfs component at 1 012.523 GHz. | Rel. Intensityb𝑏bb𝑏bThe sum of the relative intensities of the 14 hfs components is 3.4. | |
|---|---|---|---|---|
| (GHz) | (s-1) | (km s-1) | ||
| 1 012.516 | 0.00885 | 5 | 1.9 | 0.47 |
| 1 012.523 | 0.01358 | 7 | 0 | 1 |
| 1 012.529 | 0.00903 | 3 | -1.8 | 0.28 |
| 1 012.533 | 0.00193 | 3 | -3.0 | 0.06 |
| 1 012.534 | 0.00208 | 5 | -3.4 | 0.11 |
| 1 012.550 | 0.00265 | 5 | -8.1 | 0.14 |
| 1 012.556 | 0.00471 | 5 | -10 | 0.25 |
| 1 012.556 | 0.00703 | 3 | -10 | 0.22 |
| 1 012.567 | 0.00261 | 3 | -13 | 0.08 |
| 1 012.570 | 0.00887 | 1 | -14 | 0.09 |
| 1 012.571 | 0.00857 | 5 | -14 | 0.45 |
| 1 012.574 | 0.00226 | 3 | -15 | 0.07 |
| 1 012.589 | 0.00427 | 3 | -20 | 0.13 |
| 1 012.604 | 0.00471 | 1 | -24 | 0.05 |
| Frequency | gu | a𝑎aa𝑎aThe velocity offset from the strongest hfs component at 1 019.193 GHz. | Rel. Intensityb𝑏bb𝑏bThe sum of the relative intensities of the 14 hfs components is 3.4. | |
|---|---|---|---|---|
| (GHz) | (s-1) | (km s-1) | ||
| 1 018.911 | 0.00137 | 3 | 83 | 0.04 |
| 1 019.013 | 0.00095 | 3 | 53 | 0.03 |
| 1 019.020 | 0.00566 | 5 | 51 | 0.29 |
| 1 019.060 | 0.00434 | 3 | 39 | 0.13 |
| 1 019.067 | 0.00113 | 5 | 37 | 0.06 |
| 1 019.184 | 0.00130 | 5 | 2.5 | 0.07 |
| 1 019.193 | 0.01392 | 7 | 0 | 1.00 |
| 1 019.229 | 0.00381 | 3 | -11 | 0.12 |
| 1 019.232 | 0.01247 | 5 | -11 | 0.64 |
| 1 019.251 | 0.01328 | 1 | -17 | 0.14 |
| 1 019.259 | 0.00813 | 3 | -20 | 0.25 |
| 1 019.330 | 0.00547 | 3 | -40 | 0.17 |
| 1 019.361 | 0.00315 | 3 | -49 | 0.10 |
| 1 019.368 | 0.00713 | 5 | -51 | 0.37 |
| Frequencya𝑎aa𝑎aCernicharo (2011). | errorb𝑏bb𝑏bError of predicted frequency. | c𝑐cc𝑐cAdopted from Garrod et al. (2007), based on Graedel et al. (1982). | |
| (GHz) | (MHz) | (s-1) | (K) |
| 933.855 | 5.43e-03 | 45 |
| Source | Species | Frequency | Band | LO-settinga | Date | OBSID |
|---|---|---|---|---|---|---|
| (GHz) | ||||||
| G10.6-0.4 | NH+ | 1 012.540 | 4a | A | 2012-04-10 | 1342244052 |
| B | 1342244053 | |||||
| C | 1342244054 | |||||
| 1 019.210 | 4a | A | 2012-04-10 | 1342244055 | ||
| B | 1342244056 | |||||
| C | 1342244057 | |||||
| p-NH | 933.855 | 3b | A | 2012-09-18 | 1342251113 | |
| B | 1342251114 | |||||
| C | 1342251115 | |||||
| Sgr B2 (M) | NH+ | 1 012.540 | 4a | SScan | 2012-04-04 | 1342243701 |
| 1 019.210 | 4a | SScan | 2012-04-04 | 1342243702 | ||
| p-NH | 933.855 | 3b | SScan | 2012-09-18 | 1342251112 |
| Species | ||
|---|---|---|
| high metala,b | low metala,c | |
| H | 1 | |
| H2 | 0.5 | |
| He | 0.09 | 0.14 |
| C+ | 1.4(-4) | 7.3(-5) |
| N | 7.5(-5) | 2.14(-5) |
| O | 3.2(-4) | 1.76(-4) |
| S+ | 1.5(-6) | 8.0(-8) |
| Na+ | 2.0(-8) | 2.0(-9) |
| Mg+ | 2.55(-6) | 7.0(-9) |
| Si+ | 1.95(-6) | 8.0(-9) |
| P+ | 2.3(-8) | 3.0(-9) |
| Cl+ | 1.4(-8) | 4.0(-9) |
| Fe+ | 7.4(-7) | 3.0(-9) |