NuSTAR unveils a Compton-thick Type 2 quasar in Mrk 34
Abstract
We present NuSTAR 3–40 keV observations of the optically selected Type 2 quasar (QSO2) SDSS J1034+6001 or Mrk 34. The high-quality hard X-ray spectrum and archival XMM-Newton data can be fitted self-consistently with a reflection-dominated continuum and strong Fe K fluorescence line with equivalent-width keV. Prior X-ray spectral fitting below 10 keV showed the source to be consistent with being obscured by Compton-thin column densities of gas along the line-of-sight, despite evidence for much higher columns from multiwavelength data. NuSTAR now enables a direct measurement of this column, and shows that lies in the Compton-thick (CT) regime. The new data also show a high intrinsic 2–10 keV luminosity of erg s-1, in contrast to previous low-energy X-ray measurements where erg s-1 (i.e. X-ray selection below 10 keV does not pick up this source as an intrinsically luminous obscured quasar). Both the obscuring column and the intrinsic power are about an order of magnitude (or more) larger than inferred from pre-NuSTAR X-ray spectral fitting. Mrk 34 is thus a ‘gold standard’ CT QSO2 and is the nearest non-merging system in this class, in contrast to the other local CT quasar NGC 6240 which is currently undergoing a major merger coupled with strong star-formation. For typical X-ray bolometric correction factors, the accretion luminosity of Mrk 34 is high enough to potentially power the total infrared luminosity. X-ray spectral fitting also shows that thermal emission related to star-formation is unlikely to drive the observed bright soft component below 3 keV, favoring photoionization instead.
Subject headings:
galaxies: active – X-rays: galaxies – X-rays: individual (Mrk 34)1. Introduction
The census of active galactic nuclei (AGN) remains severely incomplete at high gas column densities (). The line-of-sight column (los) becomes optically thick to Thomson scattering above cm-2 for typical cosmic abundances. This is the Compton-thick or ‘CT’ regime. CT sources provide a significant contribution to the cosmic X-ray background (CXB) spectrum, with most CXB models requiring a CT AGN contribution of around 10–25% to the CXB peak flux at keV (e.g. Comastri et al., 1995; Gandhi & Fabian, 2003; Gilli et al., 2007; Treister et al., 2009; Draper & Ballantyne, 2010; Akylas et al., 2012; Ueda et al., 2014). Yet, only bona fide CT Seyferts have been confirmed in the local universe, where (los) can be robustly measured from self-consistent spectral fitting based upon a significant hard X-ray continuum (10 keV) and detection of a strong neutral Fe K line with equivalent width (EW) 1 keV (Della Ceca et al., 2008; Goulding et al., 2012). These features result from suppression of direct photons leading to a dominant contribution from reflection off circumnuclear gas.
The number density of obscured AGN is even more uncertain at higher luminosities. ‘Type 2 quasars’ (QSO2s) are characterized by luminous narrow emission lines in the optical/infrared and the absence of broad lines, as would be expected if significant circumnuclear obscuration is present. The radio-loud subset of these, or powerful ‘radio galaxies’, were the first to be identified (e.g. McCarthy, 1993; Miley & De Breuck, 2008), and X-ray studies have shown many of them to be heavily obscured along the line-of-sight (e.g. Gandhi et al., 2006; Tozzi et al., 2009; Wilkes et al., 2013). Now, the dominant population of radio-quiet QSO2s is being revealed through homogeneous, wide-area selection both through mid-infrared color selection from Spitzer and WISE (e.g. Lacy et al., 2004; Stern et al., 2005; Donley et al., 2012; Stern et al., 2012; Mateos et al., 2012; Assef et al., 2013), as well as spectroscopic identification by the Sloan Digital Sky Survey (e.g. Zakamska et al., 2003; Reyes et al., 2008).
Sloan-selected QSO2s, or SDSS-QSO2s, are identified as sources with L⊙ for the forbidden [O iii]5007Å line and an absence of broad permitted lines, but selection is also based upon redshift-dependent line flux ratios required for removing star-forming galaxies as well as a spectroscopic signal-to-noise selection. X-ray follow-up has shown most SDSS-QSO2s to be consistent with the unified AGN scheme in having significant columns of obscuring gas (Vignali et al., 2004, 2006; Ptak et al., 2006; Jia et al., 2013). By using known mid-infrared to X-ray and [O iii] to X-ray luminosity relations, Vignali et al. (2010) infer that about half of SDSS-QSO2s are obscured by CT gas columns. This is an important conclusion but is, at present, an indirect one, being based upon many X-ray non-detections and assumptions of the intrinsic AGN spectral shapes. There is a known degeneracy between the strength of reflection and obscuring column density (Gandhi et al., 2007; Treister et al., 2009) which can only be resolved using high-quality hard X-ray data (e.g. Matt et al., 2000; Ricci et al., 2011; Vasudevan et al., 2013; Del Moro et al., 2014).
X-ray surveys can potentially address these issues by selecting optically faint and radio-quiet obscured quasars with erg s-1 and cm-2 (e.g. Gandhi et al., 2004; Mainieri et al., 2011; Merloni et al., 2014). But confirmation of CT X-ray obscuration in distant quasars requires the very deepest pencil-beam surveys, and not many sources have enough counts for detailed spectral characterization (Norman et al., 2002; Stern et al., 2002; Feruglio et al., 2011; Comastri et al., 2011; Brightman & Ueda, 2012; Georgantopoulos et al., 2013). The study of distant quasars () is helped by the redshifting of hard X-ray photons to the energy range below 10 keV where most sensitive X-ray observatories so far have operated. This is not the case for low redshift quasars, leaving significant uncertainties in modeling of their X-ray spectra even though they appear brighter.
As a result of all these issues, the contribution of QSO2 activity to the CXB as well as to AGN growth and evolution remain uncertain. Yet, the latest synthesis models predict that obscured quasars outnumber unobscured ones at high redshift () where the peak of black hole and galaxy growth occur (Ueda et al., 2014). An accurate census of QSO2s is thus clearly important.
The Nuclear Spectroscopic Telescope Array (NuSTAR, Harrison et al. 2013) is the first mission in orbit capable of true imaging at energies of keV with an angular resolution better than previous hard X-ray observatories by over an order of magnitude. This enables an effective gain of for direct studies of the broadband hard X-ray continua of a variety of cosmic sources. The CXB peak at keV lies within NuSTAR’s operational energy range, and we expect to resolve % of its integrated flux (Ballantyne et al., 2011), as compared to the current % level (Burlon et al., 2011; Vasudevan et al., 2013). We may also expect to better elucidate the QSO2 contribution to the overall AGN population. In a first look at the hard X-ray sky with NuSTAR, Alexander et al. (2013) found an abundance of mildly obscured quasars selected at keV ( erg s-1, cm-2) but none with cm-2, thus limiting the fraction of CT quasars (CT QSOs) above 10 keV to % over . In parallel, a pilot NuSTAR study of three SDSS-QSO2 selected as being CT candidates could not confirm the presence of CT obscuration in any, despite the significantly improved hard band sensitivity with respect to prior Chandra and XMM-Newton constraints (Lansbury et al., 2014), emphasizing the difficulty of studying distant obscured AGN.
Here, we present NuSTAR observations of the first target in an extended SDSS-QSO2 sample, for which the selection is designed to provide the best direct constraints possible on the most obscured SDSS-QSO2s. The source, Mrk 34, is a known Type 2 AGN with narrow permitted and forbidden emission lines (Heckman et al., 1981; Dahari & De Robertis, 1988). A recent detailed multi-component fit to the SDSS nuclear spectrum finds a maximal velocity component with full-width at half-maximum (FWHM) of km s-1 to the H and H permitted lines and the forbidden [O iii] and [N ii] doublets (Mullaney et al., 2013).111An extra highly broadened component is reported in their fit with FWHM = 11989.1 km s-1, but is not significant. The observed line power L⊙ is comparable to the mean luminosity of radio-quiet Palomar-Green quasars at 0.5 (Boroson & Green, 1992). The source is radio-quiet with a small-scale jet of extent 3.7 kpc, bipolar radio morphology ending in two hot spots, and evidence of interaction between the jet and the narrow-line region clouds (Ulvestad & Wilson 1984; Falcke et al. 1998; Fischer et al. 2013). In the infrared, the source has a total power of L⊙ (González Delgado et al., 2001) and lies in the luminosity regime associated with luminous infrared galaxies (LIRGs). It is also a known luminous H2O megamaser source, which is usually associated with the presence of significant circumnuclear absorption (Henkel et al., 2005; Kondratko et al., 2006; Greenhill et al., 2008).
X-ray spectroscopy of Mrk 34 with XMM-Newton found a strong Fe K fluorescence emission line (Greenhill et al., 2008; Jia et al., 2013). The megamaser and the strong Fe line suggest the presence of Compton-thick material in the source, but this has not been possible to prove with data below 10 keV alone. The XMM-Newton-detected continuum is that of a Compton-thin ( cm-2) AGN when fitted with an absorbed power-law. In the NuSTAR data presented herein, we detect the source to keV. The high quality spectra unambiguously show, for the first time in a SDSS-selected QSO2, evidence for a reflection-dominated continuum requiring CT absorption along the line-of-sight. This demonstrates the gain that NuSTAR is providing for obscured AGN studies.
The source redshift is = 0.051, giving a luminosity distance of 236 Mpc for a flat cosmology with km s-1 Mpc-1 and (Planck Collaboration, 2013). All fit uncertainties are quoted at 90% confidence, unless stated otherwise. An outline of this paper is as follows. Section 2 describes our target selection strategy and section 3 details of X-ray observations and reduction. The spectral fitting procedures and results from the NuSTAR data alone, and when combined with XMM-Newton, are described in sections 4 and 5, respectively. In section 6, we discuss the intrinsic source properties, and how Mrk 34 fits in the context of bona fide CT AGN and the QSO2s population in general. The paper concludes with a summary in section 7.
2. Target selection
Mrk 34 was chosen as a promising target for NuSTAR from the samples of SDSS-QSO2s that have prior X-ray follow-up observations (Vignali et al., 2006, 2010; Jia et al., 2013). By fitting XMM-Newton data of the source, Jia et al. (2013) found an observed (absorbed) erg s-1 and cm-2 (consistent with an upper limit of cm-2). In addition, Mrk 34 showed the following characteristics associated with heavy or CT X-ray obscuration:
-
1)
As compared to the observed power in the [O iii] emission line ( L⊙; Reyes et al. 2008), the observed 2–10 keV power is low: /=0.4.222No luminosity uncertainties are stated by Jia et al. (2013). From our spectral fit, we estimate a 25% uncertainty on , which will dominate the error in the / ratio. This ratio places Mrk 34 at about 200 lower in than the local Type 1 AGN correlation between and (Mulchaey et al., 1994; Netzer et al., 2006; Panessa et al., 2006);
-
2)
The source also shows a low observed / ratio that places it below the correlation (in terms of ) presented in Gandhi et al. (2009). The infrared luminosity is = erg s-1, measured as , from linear interpolation of multi-band all-sky catalog data produced by the WISE mission to a rest-frame wavelength of 12 m (Wright et al., 2010);
- 3)
Jia et al. (2013) determined an intrinsic X-ray luminosity erg s-1 after correcting for the obscuring column of cm-2 measured in the XMM-Newton data below keV. Using physical reflection model fits to the same data, LaMassa et al. (2014) constrained cm-2 implying a factor of a few larger luminosity, erg s-1. By contrast, using either or (points 1 and 2 above) as an indirect proxy of the intrinsic power would imply erg s-1, about 10 times higher still. In addition, the value of EW keV above classifies Mrk 34 as a CT candidate, which would also imply the need for strong corrections to the observed luminosity. This can be tested using higher energy X-ray data.
The source is not detected by the Swift/BAT all-sky survey at the nominal 70-month survey 4.8- sensitivity flux limit of =1.310-11 erg s-1 cm-2 (Baumgartner et al., 2013). But direct examination of the BAT maps reveals a 3.7- excess at the position of Mrk 34 (for details on the maps and the procedure, see Koss et al. 2013). Extrapolation of the observed XMM-Newton continuum to hard X-rays using typical reflection models (described below) also implied a good detection probability with NuSTAR in modest exposure times. Therefore, the object was chosen as a promising NuSTAR target.
3. Observations
3.1. NuSTAR
Mrk 34 was observed on UT2013-09-19 (ObsID 60001134002) for an on-source time of 25.7 ks. The data were processed with the NuSTAR Data Analysis Software (nustardas) v.1.3.0 within heasoft v.6.15.1. With the NuSTAR UT2013-05-09 caldb release, calibrated and cleaned event files were produced using the nustardas task nupipeline with standard filter flags. Passages of the satellite through the South Atlantic Anomaly were filtered out and the standard depth cut used to help reduce instrumental background. Spectra and response files were extracted using the nuproducts task. The net exposure time was approximately 23.9 ks.
A 45″–radius aperture was used for extracting source counts. Background counts were extracted from a neighboring, off-target circular aperture 100″ in radius, free of any other sources. Using a source-centered annular region to define the background gave consistent results.
3.2. XMM-Newton
Archival XMM-Newton observations (ObsID 0306050701) obtained through a medium filter in full-window mode from UT2005-04-04 were reduced and analyzed using standard procedures within sas v13.0.0.333http://xmm.esa.int/sas Spectra were extracted within a 15″–radius aperture. The spectra and responses from the two EPIC mos detectors were combined using the addascaspec script as they were very similar. The net good exposure time is 8.8 ks (pn) and 22.9 ks (combined mos). We note that there are no other bright sources within 15 of the target position in the XMM-Newton (and NuSTAR) images. More details on these XMM-Newton data can be found in Jia et al. (2013) and LaMassa et al. (2014).
4. X-ray spectral fitting
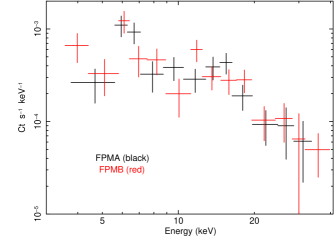
We began with an examination of the NuSTAR data alone. Mrk 34 is well detected in both focal plane modules (FPMs), with net count rates of ct s-1 in FPMA and ct s-1 in FPMB, respectively, over the energy range keV. The extracted spectra are shown in Fig. 1. Spectral analysis was carried out over this energy range using xspec v.12.8.1 (Arnaud, 1996). All spectra have been grouped to a minimum of 20 counts per bin.
A prominent excess of counts just above 6 keV suggests the presence of Fe K emission. Parametrizing the data with a power-law (PL) continuum and a Gaussian line with fixed rest-frame line centroid energy keV and redshift returns a photon index (where photon flux density ), and EW keV with a fit statistic of = 29.9 for 23 degrees of freedom (dof). The confidence ranges on EWKα are determined by drawing an ensemble of 10,000 parameter values from the fit. Letting the line centroid float freely returns a rest-frame energy keV, showing that this is consistent with neutral Fe K (although weaker Fe K or higher ionization lines are likely to be contributing). The observed fluxes are erg s-1 cm-2 and erg s-1 cm-2, respectively. The very flat and large EWKα are characteristic signatures of reflection from optically thick cold gas.
Over the common energy range of 3–10 keV, XMM-Newton gives consistent results with NuSTAR on spectral shape, fluorescence strength and continuum normalization: , EW keV, erg s-1 cm-2. This consistency implies that there has been no significant variability between the two observations. We therefore proceeded to fit more physical reflection models to the NuSTAR and XMM-Newton data combined. We used two physically motivated and self-consistent reflection models for the hard X-ray regime, in addition to including other common spectral components at soft energies. These are described below.
4.1. MYTorus : model M
The MYTorus model simulates a toroidal absorber geometry with a covering factor of 0.5 (a fixed half-opening angle deg) centered on a continuum source (Murphy & Yaqoob, 2009). It self-consistently includes i) distortion of the zeroth-order transmitted component (which, in our case, is a PL) due to photoelectric absorption and Compton scattering, ii) Compton-scattering off the torus, and iii) associated fluorescence line emission (neutral Fe K at 6.4 keV and K at 7.06 keV) and the Compton shoulder to the fluorescence lines. We used MYTorus mainly in the standard (‘coupled’) mode where the normalizations of these three components are tied to the intrinsic continuum, effectively coupling (los) to the torus inclination angle. Table grids with an equatorial column density ((eq)) of up to 1025 cm-2 are available and defined between 0.5–500 keV. This model is referred to as ‘model M’.
MYTorus also allows decoupling the column density from geometry, and (los) from that responsible for the scattered continuum ((scatt)). Such a ‘decoupled’ mode fit is briefly described in § 6.1.
4.2. torus : model T
The torus model of Brightman & Nandra (2011) allows changing geometries through variable , but (los) through the torus is defined such that it is independent of inclination (). Table models with up to 1026 cm-2, or about ten times more than allowed in MYTorus, are publicly available. torus also includes Compton-scattering and Fe K fluorescence. It is defined between 0.1–320 keV, which enables us to extend the fit to lower energies as compared to MYTorus. This model is referred to as ‘model T’.
4.3. Other spectral components
The low-energy (2 keV) spectral shape as seen with XMM-Newton is much softer than the continuum shape at higher energies (Jia et al., 2013; LaMassa et al., 2014). This was parametrized as hot gas plasma emission in the host galaxy with apec (Smith et al., 2001) and included in both models M and T. Two such apec components were found to be necessary for both models. Additional emission from an optically thin medium on larger scales in the host galaxy which scatters AGN emission into the line-of-sight may be present, as could emission from X-ray binaries. Such emission was simulated using a single PL (of photon-index tied to that of the AGN) with a scattering fraction relative to the intrinsic PL, and obscured by an additional gas column ((host)) that is independent of the column associated with the torus. Such components are often used to describe the soft emission observed in obscured AGN (e.g. Done et al. 2003), but in the absence of high spectral resolution soft X-ray data, these are only meant as a simple prescription to describe the spectral shape in this regime. We will discuss whether such components are viable in section 6.3, together with other physical models of the soft emission.
All abundances for the torus models and the thermal components are fixed at Solar.
phabs absorption through a fixed low Galactic column (Gal)=6.81019 cm-2 of cold gas, based upon H i measurements along the line-of-sight (Dickey & Lockman, 1990), was also included in all spectral fits. Finally, a cross-calibration constant between the two missions was included as a free parameter. Cross-calibration of the XMM-Newton EPIC MOS and pn cameras has shown that these instruments are in very good agreement with each other when fitting over their full energy range (Kirsch et al., 2004), so we fixed their relative cross-normalization to 1.
The final models have the following notations in xspec, with explanatory mappings in square brackets:
and
5. Results from combined NuSTAR and XMM-Newton fits
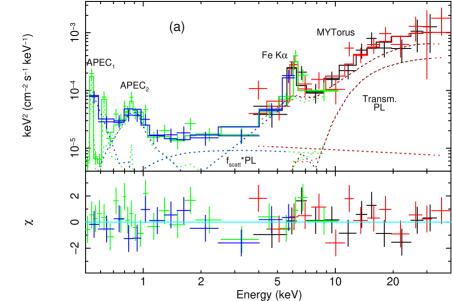
We first fitted the broadband NuSTAR and XMM-Newton data using the coupled MYTorus model M. A fit was found with reflection dominating at all energies above keV. This is shown in Fig. 2 and the best-fit parameters are listed in Table 2. The fit returned an equatorial column cm-2. The inclination angle lies between deg, constrained at the lower end by the opening angle of the torus. (eq) lies well within the CT regime. In the coupled MYTorus model, the line-of-sight column is tied to (eq) and from the model geometry, and (los) cm-2 for the best-fit value of deg. The upper model threshold of 1025 cm-2 is permitted by the fit, i.e. is unconstrained at the upper end.
The absorbed luminosity over 2–10 keV is erg s-1, and over a broader energy range of 0.5–30 keV covering both NuSTAR and XMM-Newton is erg s-1. Correcting for absorption implies erg s-1 and erg s-1, respectively. The observed EW keV, as expected for a reflection-dominated spectrum.444Measured by numerical integration of the best-fit Fe K line plus Compton shoulder model flux, and dividing by the total fitted MYTorus continuum interpolated to 6.4 keV rest-frame. The fitted is somewhat steep compared to the mean measured in high-quality AGN data (e.g. Nandra et al., 1997; Mateos et al., 2005; Piconcelli et al., 2005), but not extraordinarily so within the allowed confidence range.
The softest energies can be parametrized using two apec components and optically thin scattering. The temperatures () of the apec components are 0.1 and 1 keV, respectively. Removing either apec component results in a of at least +50 for two additional degrees of freedom, implying that both are required. The luminosity associated with the two apec components is erg s-1. The scattering normalization , which gives a luminosity erg s-1. The XMM-Newton–to–NuSTAR cross-calibration constant is lower than (but consistent with) 1.
Notice that the best-fit (eq) and values are at the upper and lower extremes, respectively, allowed in MYTorus for an obscured line-of-sight intersecting the torus. This suggests that there is some tension in the fit between the conflicting need to strongly suppress the intrinsic continuum at all energies (i.e. a large ) and the need for an unabsorbed reflection-dominated continuum and strong Fe K line below 10 keV (which pushes down). This is not easy to simulate within MYTorus, because of its geometrically constrained configuration. Removing one degree of freedom by fixing to 75 deg (at the high end of the allowed confidence range in the above fit) also yields an acceptable solution with (los) cm-2 and erg s-1.
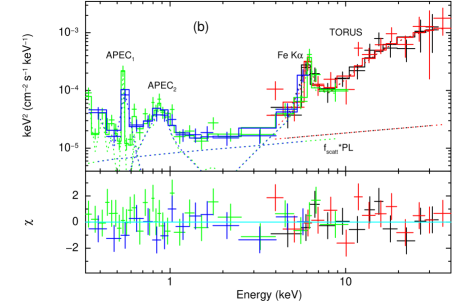
Model T gives the opportunity to examine systematically different torus model assumptions and geometry, in particular in its allowance of varying opening torus angles. We found that it was not possible to constrain both and simultaneously. We thus decided to fix deg, corresponding to an edge-on inclination. The strong megamaser in Mrk 34 provides some justification for this choice, as most megamasers are associated with edge-on inclinations (Kuo et al., 2011). This choice also allows examination of the effect of a larger than preferred by MYTorus. In addition, the fit for is then no longer restricted by , as the model allows for values up to 84 deg (Brightman & Nandra, 2011).
Model T yields an excellent fit, with a flatter (Table 2, Fig. 2). The best-fit (los) lies above 1025 cm-2 with the lower 90 % confidence interval allowing (los) cm-2. This is again within the CT regime and unconstrained at the high end, this time up to cm-2. In this case, EW keV. A broad range of torus opening angles is allowed, deg. Small values are equivalent to large torus solid angles, which can produce stronger reflection and fluorescence components. On the other hand, very thin tori ( deg in our fits) do not produce enough reflection. Whereas model M requires some host absorption ((host) cm-2), this is partly driven by the fitted steep value and is not needed for model T.
Finally, we note that using the pexrav (Magdziarz & Zdziarski, 1995) or pexmon (Nandra et al., 2007) reflection models as alternatives to the torus models above give broadly similar results in terms of the requirement of a reflection-dominated continuum. In fact, reflection-only models ( value of less than 0) yield fully acceptable fits (with reduced ) without the need for any direct component. These models are not described in detail here because they simulate reflection off a slab geometry and assume an infinite optical depth, neither of which are likely to represent the torus. There is also no strong constraint on the intrinsic luminosity in such a scenario because the reflector and obscurer are disjoint and the solid angle of the reflecting surface visible to us is unknown.
6. Discussion
Mrk 34 was selected for NuSTAR observation because previous low-energy X-ray follow-up provided indirect evidence of high or CT obscuration, including low / and low / ratios relative to Type 1 AGN, as well as an EW keV. In terms of its optical spectral properties, in particular its narrow-line luminosity ( L⊙), Mrk 34 is quite representative of the large sample of 887 SDSS-QSO2s compiled by Reyes et al. (2008) whose distribution has an average L⊙ (with a 1- scatter of 0.4 dex). With NuSTAR, we find direct evidence of CT obscuration in the form of a flat hard X-ray (3–40 keV) continuum which can be modeled as arising from reflection off optically thick circumnuclear gas self-consistently with the strong neutral Fe line.
Although the source was selected from optical spectroscopy, the derived intrinsic X-ray power also places Mrk 34 in (or very near) the regime associated with obscured X-ray quasars ( erg s-1). Whereas local CT Seyfert 2s have been studied at lower X-ray luminosities for many years, this is the first time that such a robust measurement of the intrinsic X-ray power is possible for a powerful SDSS-selected QSO2. Mrk 34 is thus a ‘gold standard’ CT QSO2, satisfying all the above characteristics typically associated with this class.
6.1. On the intrinsic power and obscuring column density
The two broadband NuSTAR+XMM-Newton model fits in Table 2 require (los) cm-2 although much higher values of are allowed. The photon indices of the two fits also allow for some variation in the intrinsic PL slope. Despite these uncertainties, it is noteworthy that the corresponding absorption-corrected X-ray luminosities of the two model fits differ only by a factor of 2, at erg s-1. This is a consequence of the fact that the observed hard X-ray spectrum is dominated by the reflection component at all energies, so the modeled intrinsic luminosity is mainly dependent upon the observed flux and the covering factor of the reflector and is less sensitive to the reflecting gas column or the intrinsic PL shape that produces the reflection spectrum. In other words, the model fits likely provide a good estimate of the intrinsic power of the AGN, but only a lower limit on the torus column density.
A systematically different obscuring geometry could yield a different result, of course, and this may be investigated using the ‘decoupled’ mode of MYTorus (Murphy & Yaqoob, 2009). With differing normalizations and/or column densities for the transmitted and scattered components, this mode can be interpreted as an approximate parametrization of alternate geometries such as a patchy torus or of differing elemental abundances. But it is difficult to constrain such decoupled models for Mrk 34 because the intrinsic continuum is not obviously visible at any energy, leading to a large degeneracy on the reflection fraction. In fact, including separate edge-on and face-on scattering/fluorescence components with a free multiplicative scaling between them in the MYTorus fit (as recommended by Yaqoob 2012) leads to the scattering component completely dominating over the intrinsic PL by large factors (100) suggesting much higher values of (los) than the lower confidence ranges that we presently constrain.
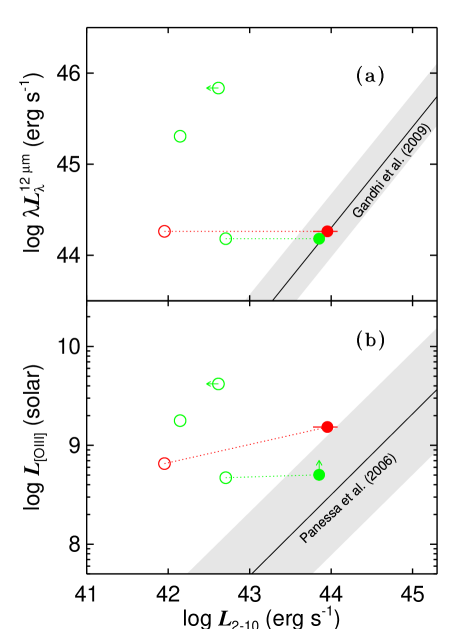
Additional checks on the intrinsic power can be provided by indirect multiwavelength relations. These are shown in Fig. 3, the top panel of which plots the vs. relation for Mrk 34 along with the three other SDSS-QSO2s observed by NuSTAR so far (Lansbury et al., 2014). The latter objects were selected from sources at with / and sample a range of about one dex in . The intrinsic for Mrk 34 matches well with the infrared:X-ray luminosity relation by Gandhi et al. (2009), lying within the 1- relation scatter. The same holds true when using other relations published in Gandhi et al. (2009) and Asmus et al. (2011) which effectively include varying levels of host galaxy contamination to the mid-infrared. Although high angular resolution infrared imaging (e.g. Asmus et al. 2014) is not available for Mrk 34, we note that the WISE mid-infrared color of the source from the all-sky catalog is , placing the source comfortably inside the color zone identified by Stern et al. (2012) where the mid-infrared flux is likely to be AGN-dominated. In other words, the close match to the correlation in the top panel of Fig. 3 is entirely attributable to the AGN power alone.
The same figure also shows the vs. plane. Mrk 34 lies at the threshold of the 1- scatter of the relation defined by Panessa et al. (2006), and the source position is approximately similar with respect to the mean and scatter defined by other relations (e.g. Netzer et al. 2006). Intrinsic [O iii] luminosities are also shown for the two NuSTAR-detected sources, and are corrected for Galactic reddening (Schlafly & Finkbeiner, 2011). For Mrk 34, we were able to additionally correct for reddening in the narrow-line-region of the host galaxy, following the procedure of Bassani et al. (1999). For this, we measured the Balmer decrement from the H and H narrow line fluxes provided by the SDSS spZline pipeline output (Bolton et al., 2012). A ratio of is measured555It is worth noting that this Balmer decrement is much milder than the value of =10.47 according to Dahari & De Robertis (1988), which may be a result of differing slit positioning and setup. We use the more recent SDSS measurements here., which translates into an [O iii] dereddening factor of 2.3. This correction is not possible for the sources from Lansbury et al. (2014) because their higher redshift means that H lies beyond the SDSS wavelength range. According to the bottom panel of Fig. 3, there is a mild suggestion that Mrk 34 may have a higher still, but it is difficult to provide a precise cross-check given the large scatter associated with most : correlations.
Finally, with an isotropic megamaser power 103 L⊙ (Henkel et al., 2005), Mrk 34 now also lies within the scatter of the possible relationship between and proposed by Kondratko et al. (2006). These authors identified two maser complexes in Mrk 34 consistent with symmetric blue- and redshifted high-velocity (500 km s-1) emission. This is consistent with maser excitation resulting from X-ray irradiation of accretion disk gas. Higher intrinsic X-ray luminosities would push the source beyond the scatter of the proposed : relation.
In short, these multiwavelength comparisons suggest that our X-ray spectral analysis reliably captures the intrinsic X-ray power of Mrk 34. A compilation of luminosities from our NuSTAR modeling and over the various wavelength bands discussed above is presented in Table 1.
6.2. On the bolometric luminosity and Eddington ratio
When compared to the total infrared power of L⊙ erg s-1 as probed by IRAS, /. For any typical AGN bolometric correction factor / (e.g. Elvis et al., 1994; Vasudevan et al., 2010), the AGN easily has enough power to drive the bulk of the infrared emission. LIRGs (with L⊙ L⊙) generally show a much lower fractional AGN contribution to the infrared (e.g. Alonso-Herrero et al., 2012), and Mrk 34 appears to be more similar to Palomar-Green QSOs in this respect (Veilleux et al., 2009). The high current luminosity of Mrk 34 may simply represent an upward fluctuation in an otherwise more modest accretion history (e.g. Hickox et al., 2014), although a significant ongoing gas accretion rate is required in order to drive the observed power: M⊙ yr-1 (assuming an X-ray bolometric correction of 15 and accretion efficiency ).
There is no secure measurement of the supermassive black hole mass () for Mrk 34 as yet. Although a megamaser has been detected, there is no corresponding spatially resolved map so its inner radius is unknown. However, if we assume that the megamaser disk in Mrk 34 has an inner radius of pc as seen in other nearby sources (e.g. Kuo et al., 2011), the observed 500 km s-1 maser velocity (Kondratko et al., 2006) would imply M⊙. Extrapolating the galaxy stellar velocity dispersion () from the [O iii] emission line width and using the – relation from Tremaine et al. (2002), Wang et al. (2007) instead estimate M⊙. On the other hand, Oh et al. (2011) measure = 5 km s-1 from their analysis of the SDSS spectra, and using this velocity dispersion together with the updated – relation from McConnell & Ma (2013) would imply M⊙.
If we assume that a range of M⊙ reasonably encompasses the current uncertainty on , and combine the intrinsic X-ray power that we measure with typical AGN bolometric correction factors quoted above, we find that the AGN is radiating at an Eddington fraction of .
Better data are clearly needed for more precise measurements of . A very long baseline interferometry map of the megamaser would resolve the inner disk radius, and hence provide a measure of . At the distance of Mrk 34, a physical scale of 0.5 pc corresponds to an angular size of mas, which is within range of the synthesized beam sizes currently available (Kuo et al., 2011). Alternatively, high-quality near-infrared imaging with the Hubble Space Telescope (HST) or the future James Webb Space Telescope could provide a complementary measurement of through accurate measurement of the bulge mass and the known correlation between the two quantities (e.g. Marconi & Hunt, 2003).
| Band and quantity | 1043 erg s-1 |
|---|---|
| 0.02 | |
| (absorbed) | 0.12 |
| (absorbed) | 0.88 |
| (absorbed) | 1.02 |
| 6–12 | |
| 15–31 | |
| 4–15 | |
| (reddened) | 0.24 |
| (dereddened) | 0.56 |
| (12 m) | 20 |
| 80 | |
†Ranges refer to the absorption-corrected values for the AGN continuum between models M and T.
6.3. On the origin of the soft X-ray emission
The soft X-ray emission of Mrk 34 is interesting because of the presence of high-luminosity components which steepen the overall source spectrum significantly below 3 keV (Fig. 2). In fact, the first published X-ray detection of Mrk 34 appears to have been from the ROSAT High Resolution Imager sensitive over the range 0.1–2.4 keV, rather than at harder X-rays (Pfefferkorn et al., 2001).
Two apec components are used to parametrize the soft X-rays below 1 keV, and a PL simulating scattering by diffuse plasma dominates around 2 keV (Fig. 2; Table 2). The presence of multiple hot gas components is common in many systems, especially starbursts (e.g. Konami et al., 2011; Mineo et al., 2012). However, the power of these components is very large in Mrk 34 and converting the soft band power to a star-formation rate (SFR) using the :SFR scaling relation from Mineo et al. (2012) implies a high SFR Myr-1 even accounting for the scatter in the relation.666The relation by Mineo et al. (2012) actually assumes a mekal model instead of apec, but there is no significant difference between these two in terms of the inferred luminosities for our data. One can compare this to the infrared-derived SFRIR from the SFR: relation presented by Kennicutt (1998a). We find SFR Myr-1, which should be considered as an upper-limit because the AGN contribution to the infrared appears to be substantial. SFRX-ray is much higher than SFRIR, suggesting that some other process may be powering the observed soft X-ray components.
Photoionization of circumnuclear gas is commonly observed in nearby AGN (e.g. Guainazzi & Bianchi, 2007) and is the most likely viable alternative. In the bright nearby galaxy NGC 4151, a photoionized X-ray component with similar fractional luminosity to hard X-rays as in Mrk 34 has been observed to spatially trace the extended [O iii] emission (Wang et al., 2011). It may thus be the case that the entire soft X-ray regime in Mrk 34 is a complex of emission lines associated with extended photoionized gas in the narrow line region. We attempted such a model by replacing the apec components with several narrow emission features. A minimal set to give an acceptable fit included O vii K (0.571 keV), a narrow O viii radiative recombination continuum (0.871 keV), and Ne x K (1.022 keV), with /dof = 68.9/63. The hard X-ray portion of the spectrum is still well fit in this case, but a much steeper scattered PL with = 2.7 0.2 is required to fill in the gaps between the emission lines in the soft band. This indicates the need for extra emission lines, or possibly a weaker collisionally ionized component as has been observed in other AGN (Guainazzi et al., 2009; Bianchi et al., 2010).
If photoionization dominates over scattering, this could explain the low 0.5% (Table 2) associated with the intrinsic PL scattered into the line-of-sight by diffuse hot gas. Nearby Seyferts generally show values of a few per cent (e.g. Cappi et al. 2006). If part of this soft emission were instead attributed to X-ray binaries in the host galaxy, that would imply an even lower value of . Alternative explanations could be a ‘buried AGN’ with a geometrically thick torus (Ueda et al., 2007) or host galaxy extinction (Hönig et al., 2014), although neither obviously works for Mrk 34. The strong [O iii] lines seen in this object are not typical of buried AGN, and the small Balmer decrement (see previous section) together with the intermediate inclination angle777http://leda.univ-lyon1.fr/ of the galaxy disk of 45 deg is consistent with only modest dust reddening in the host. Finally, another recent proposal on the origin of this soft emission component is scattering off clouds within a clumpy torus medium (Miniutti et al., 2014).
These issues can be investigated using higher spatial resolution imaging with Chandra, and future high spectral resolution observations with Astro-H (Takahashi et al., 2012).
6.4. Comparison to other bona fide CT AGN
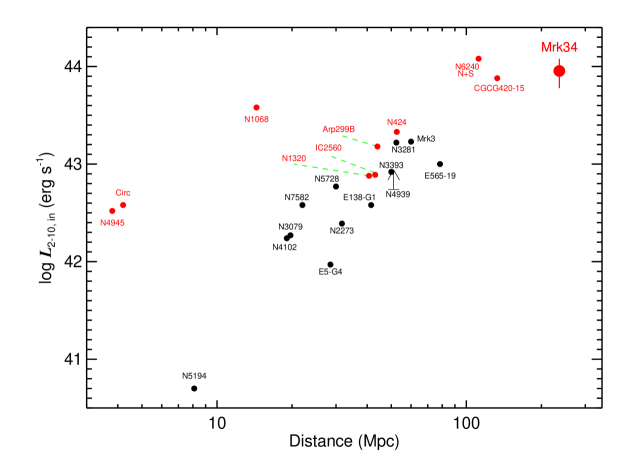
Fig. 4 compares Mrk 34 on the vs. distance plane with all other bona fide CT AGN from the compilation of Goulding et al. (2012), supplemented with recent results on individual sources which have been collated in the Appendix. Some sources known to be of changing-look nature with rapid Compton-thick/thin transitions such as NGC 1365 (Risaliti et al., 2005) have not been tabulated in this list in accordance with Della Ceca et al. (2008), though these are also potential candidates for inclusion. Note that Mrk 231 and NGC 7674 have been removed from this compilation based upon results from Teng et al. (2014) and Bianchi et al. (2005). Recent NuSTAR observations of the former source show no evidence of CT columns, while the nature of obscuration in the latter is currently unclear with the source being either a changing-look AGN or having recently switched off. For another source, Superantennae, NuSTAR observations find a strong decrease in the broadband X-ray flux as compared to previous observations with Suzaku. Whether this is a result of dramatic luminosity decline, spectral change, or contaminating sources in previous data, is currently being investigated (Teng et al. 2014, in prep.), so this source is also currently not included in this compilation.
Mrk 34 emerges as one of the most luminous amongst the local bona fide CT AGN, similar to NGC 6240. Given the extreme luminosities of these two sources within the local sample, it is interesting to compare and contrast their characteristics. For NGC 6240, we have reanalyzed the BeppoSAX data of Vignati et al. (1999) as well as new NuSTAR data, and found a luminosity agreeing to within a factor of 2 of the value of quoted in Vignati et al. after correcting for cosmology and applying a correction factor for a toroidal obscuration geometry (Puccetti et al. 2014, in prep.). NGC 6240 appears to be somewhat less obscured and has a weaker Fe line than Mrk 34 (11024 cm-2 and EWKα0.3 keV; Brightman & Nandra 2011).
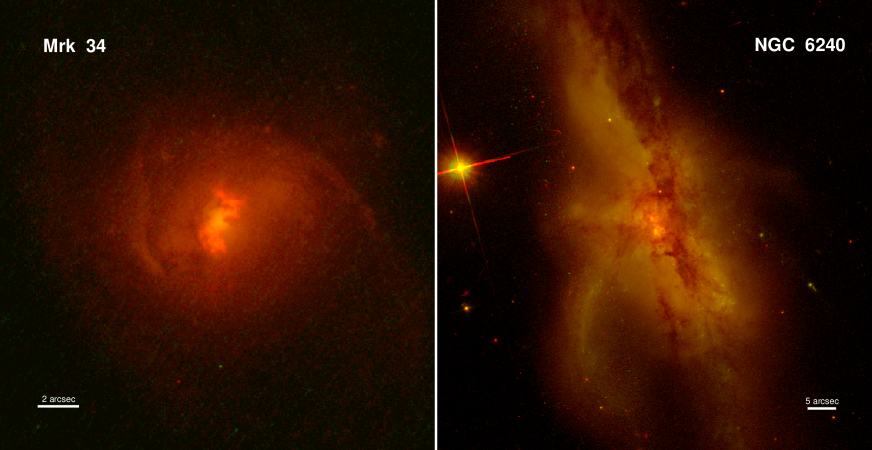
NGC 6240 is a well-known binary AGN (Komossa et al., 2003) and its hard X-ray emission above 10 keV is the combined luminosity of both the northern (N) and the southern (S) components. The contribution of each component to the hard X-ray emission has not been directly resolved, but low energy X-ray data, as well as mid-IR continuum imaging, show S to be brighter than N by a factors of a few (Komossa et al., 2003; Wang et al., 2014; Asmus et al., 2014). Mrk 34, on the other hand, is not a known binary AGN and is not in a major merger. Fig. 5 presents HST images for the two objects which makes the difference immediately clear. NGC 6240 has a total far-infrared power 6.51011 L⊙ (Sanders et al., 2003; Koss et al., 2013), which is about three times higher than that of Mrk 34. Both objects lie within the luminosity regime associated with LIRGs. We also note that the object that follows these two in terms of luminosity CGCG 420–15 (Severgnini et al., 2011), has also been identified to lie in a group (Crook et al., 2007). In this case, we quote the intrinsic luminosity based upon our model fits to new NuSTAR data.
Is there any evidence for galaxy interaction in Mrk 34? The galaxy is classified morphologically as Hubble class Sa (Nair & Abraham, 2010). From integral field spectroscopy, Stoklasová et al. (2009) found an asymmetry in the nuclear emission line distribution which is elongated at a position angle of 140–150 deg. Twisted H velocity isocontours were also identified by them. However, these may be signatures of interaction between the AGN jet and narrow line region clouds, as suggested by Falcke et al. (1998) based upon matching of radio and narrowband emission line maps. Any morphological perturbations related to galaxy interactions must then be relatively mild. Even if the present nuclear activity is a result of some past interaction or merger, Mrk 34 is clearly at a different evolutionary stage now as compared to the strongly interacting system NGC 6240. Alternatively, these sources may be showcasing the contrast between the two dominant AGN-triggering modes – secular processes vs. major mergers – with secular processes thought to dominate in the low-redshift universe (e.g. Draper & Ballantyne, 2012).
In summary, Mrk 34 is not in a merging system at present, unlike NGC 6240. This makes Mrk 34 the closest known bona fide CT QSO in a non-merging system.
6.5. Feedback from the AGN?
At present, there is an absence of nuclear star formation in Mrk 34 (González Delgado et al., 2001; Stoklasová et al., 2009). Wang et al. (2007) classify Mrk 34 as undergoing suppressed star formation as a result of AGN feedback, with the present SFR surface density lying about two orders or magnitude lower than predicted by the Kennicutt-Schmidt Law (Kennicutt, 1998b).
A spatially resolved ionized outflow with a maximum velocity of 1500 km s-1 and gas being accelerated out to a radius of 1 kpc has been observed in high angular resolution HST observations with the Space Telescope Imaging Spectrograph by Fischer et al. (2013). It is possible to estimate the potential impact of mechanical feedback associated with this ionized [O iii] outflow. For this, we use the relation between (assuming that the line is fully associated with the outflow) and the kinetic power () of this ionized component, as derived by Cano-Díaz et al. (2012). For typical electron densities of 102-4 cm-3 expected in the narrow line region, Eq. B.9 of Cano-Díaz et al. (2012) implies a kinetic power of erg s-1. This constitutes % of the source (infrared) bolometric power, a typical level required by models for the outflow to have any significant impact on the host galaxy (e.g. Di Matteo et al., 2005; Hopkins & Elvis, 2010).
As an alternative determination of the outflow power, we utilize the H luminosity together with Eqs. 2 and 3 of Harrison et al. (2014). The line luminosity ( = erg s-1) and width containing 80% of the flux ( =690 km s-1) were measured from the SDSS spectra as analysed in Mullaney et al. (2013). In this case, the SDSS observations do not spatially resolve the line emission so we assume the extent and maximum speed of the H line emitting material to be the same as that of the ionized gas (Fischer et al., 2013). These assumptions imply that the outflow has been constant for 1 Myr, which results in an ionized gas mass M⊙, a kinetic energy erg, and kinetic power erg s-1, a range that is about one order of magnitude lower than the determination based upon Cano-Díaz et al. (2012).
The above estimates use observed line luminosities, and a correction for reddening would push the corresponding power higher by factors of a few. On the other hand, we assume that the line radiating ionized gas fully participates in the outflow, which is unlikely to be the case. For example, in the outflow estimates based upon H, we incorporate the total observed narrow line flux rather than the clearly outflowing (blueshifted) components. These estimates would then provide upper limits on the outflow, though spherical and wide-angle outflows with small velocity differences across them have been observed in many systems (e.g. Liu et al., 2013; Harrison et al., 2014). So mechanical feedback may have a significant effect in Mrk 34, though there are plenty of uncertainties in the present estimates.
In any case, the presence of CT gas columns as inferred from the NuSTAR data means that such feedback has not yet removed the nuclear obscuring gas. Any jet-induced interaction is expected to have most impact along the jet axis. The source has a bipolar radio morphology and shows two hot spots (Falcke et al., 1998), so the jet is pointed out of our line-of-sight and would not directly impact the toroidal obscuring gas. Direct radiation pressure is also unlikely to be effective in removing obscuring gas when the column density become Compton-thick (e.g. Fabian et al., 2008). But radiation pressure could be the physical driver of the ionized outflow.
6.6. Implications for distant obscured AGN studies
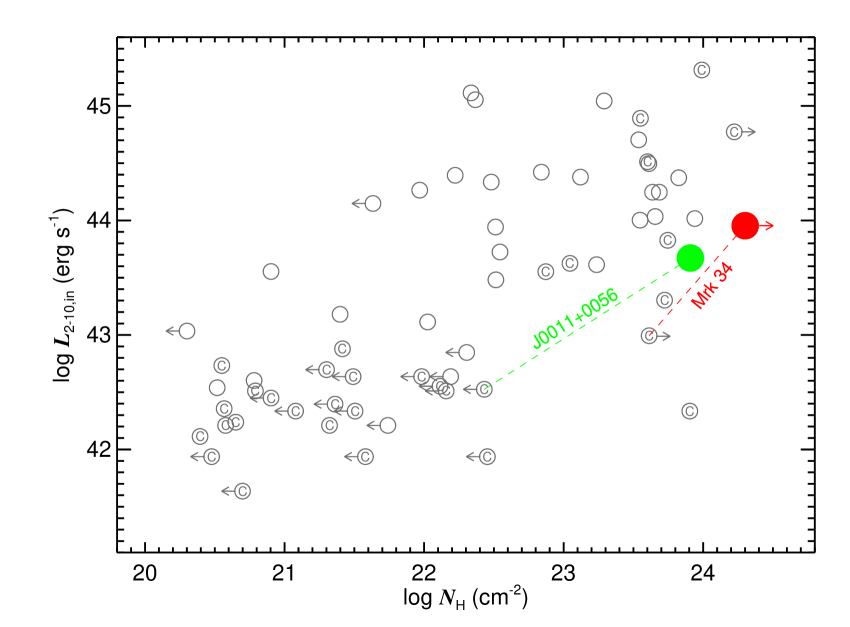
Fig. 6 shows our present constraints on and the intrinsic for the X-ray–detected SDSS-QSO2 population. In gray are the measurements for all 63 sources detected by Chandra/XMM-Newton and with an measurement based upon X-ray spectral fitting with data below 10 keV, collated from Vignali et al. (2006, 2010), Jia et al. (2013) and LaMassa et al. (2014). For sources with multiple fits (either to data from multiple observations, or from using multiple models), we chose fits based upon recent physically-motivated torus models when available, otherwise preferring the highest fitted values. In red and green are the new constraints from the broadband modeling of the two NuSTAR–detected QSO2s Mrk 34 and SDSS J0011+0056, respectively. Direct continuum modeling of data below 10 keV underestimates and intrinsic for both, and the improved constraints enabled by NuSTAR move both quantities to significantly higher values. So, the plotted values of and may actually be underestimates for other sources as well, especially the CT candidates. If this trend turns out to hold for many of these candidates, this will have important implications for AGN population models which require a good knowledge of the underlying column density and luminosity distributions. Observations of more QSO2s with NuSTAR would be invaluable for obtaining improved constraints on the overall population.
Studies of distant obscured AGN are extremely challenging even with NuSTAR, as is evident from the non-detection of all sources except one in two recent exploratory NuSTAR studies targeting luminous QSO2s at (Lansbury et al., 2014) and hyperluminous infrared galaxies at (Stern et al., 2014), respectively. Mrk 34 is the first source in a similar class to show enough photons for X-ray spectral modeling. Its brightness is a result of its lower redshift as compared to the previously targeted sources. This, together with the fact that Mrk 34 appears to be a typical CT QSO (as discussed before), means that the X-ray spectrum of Mrk 34 can serve as a useful template for more distant CT QSOs. In particular, Mrk 34 is a factor of 2–3 more luminous than NGC 1068, and shows evidence of a higher level of obscuration as compared to NGC 6240 (see section 6.4), the two other sources often considered as CT AGN archetypes.
An important point is that Mrk 34 would not have been selected as an obscured quasar from modeling of the X-ray continuum below 10 keV alone, because absorption-correction of the XMM-Newton data without higher energy coverage results in intrinsic luminosities that are 10 times lower than found by NuSTAR (§ 2). This means that X-ray selection of obscured quasars from data with low spectral statistics can severely underestimate as well as the intrinsic X-ray power, leading to biased estimates of the distributions of these quantities. While the high EWKα in Mrk 34 was known previously and gave a strong hint supporting CT obscuration, detection and identification of this narrow feature requires a reasonable count-rate, which is not available for most AGN found in typical distant X-ray surveys. Expanded deep surveys with Chandra and XMM-Newton (e.g. the upcoming 7 Ms Chandra Deep Field South) will help in this regard, as will detailed follow-up with future missions such as Astro-H and Athena (Takahashi et al., 2012; Nandra et al., 2013).
7. Summary
Combining NuSTAR observations with archival XMM-Newton data, we have carried out high quality broadband X-ray spectroscopy of the optically selected Type 2 quasar Mrk 34. A summary of our main results is as follows:
-
1.
Using two physically motivated toroidal obscuration models, we show that the spectra are fully consistent with obscuration by Compton-thick column densities of gas along the line-of-sight. This is the first time that such high columns have been directly measured from spectral fitting to the X-ray continuum of an SDSS-QSO2. This has been possible thanks to the hard X-ray sensitivity of NuSTAR.
-
2.
Comparisons of the intrinsic luminosity inferred from the two torus models with various multiwavelength luminosity correlations suggests that our X-ray analysis reliably measures the intrinsic source power of erg s-1 to within a factor of . When converted to a bolometric luminosity, the accretion power is sufficient to drive the entire infrared emission.
-
3.
The observed soft X-ray emission appears to be too luminous to be associated with star-formation and may instead be driven by AGN photoionization.
-
4.
Mrk 34 is representative of the SDSS-QSO2 population in terms of its [O iii] line luminosity, and it shows all the indirect pieces of evidence expected for sources with Compton-thick obscuration (i.e., a low observed X-ray luminosity with respect to other isotropic AGN luminosity indicators, a powerful H2O megamaser, and a strong Fe K line). Thus, Mrk 34 is a benchmark CT QSO2 in the local universe. It is the nearest isolated CT quasar, in that it is not presently undergoing a major merger.
-
5.
Yet, using X-ray data below 10 keV alone fails to pick up the source as an intrinsically luminous AGN. This has implications for low-energy X-ray selection of obscured quasars in survey fields where most detected sources lie in the low-count regime, and more NuSTAR observations of CT QSO2 candidates are required for understanding the importance of this selection effect. Our broadband X-ray spectrum of Mrk 34 could serve as a useful local template for hard X-ray studies of distant CT quasars.
| Component | Parameter | Model M | Model T | Units |
|---|---|---|---|---|
| apec1 | keV | |||
| 2.0 | 1.6 | 1041 erg s-1 | ||
| apec2 | keV | |||
| 2.4 | 2.2 | 1041 erg s-1 | ||
| MYTorus/torus | (eq) | – | 1024 cm-2 | |
| (los) | 35.5 | 1024 cm-2 | ||
| deg | ||||
| – | deg | |||
| EW(Fe K) | 1.2 | 1.4 | keV | |
| AGN continuum | ||||
| 0.6 | 1.2 | 1044 erg s-1 | ||
| 1.5 | 3.1 | 1044 erg s-1 | ||
| Diffuse Scattering | 10-3 | |||
| Large-scale absorption | (host) | – | 1021 cm-2 | |
| XMM:NuSTAR cross-calib | const | |||
| /dof | 57.5/53 | 59.9/62 |
uunconstrained. ffixed.
Model M: MYTorus coupled component (Murphy & Yaqoob, 2009) used for the circumnuclear absorber/reflector.
Model T: torus component (Brightman & Nandra, 2011) used for the circumnuclear absorber/reflector.
Appendix A List of bona fide local Compton-thick AGN
Table 3 lists the distances and intrinsic luminosities of all the bona fide Compton-thick AGN plotted in Fig. 4, along with relevant references for their X-ray analyses.
| Source | Distance | Reference | |
|---|---|---|---|
| Mpc | erg s-1 | ||
| NGC 424 | 52.6 | 43.33 | 1 |
| NGC 1068 | 14.4 | 43.58 | 2 |
| NGC 1320 | 40.7 | 42.88 | 1 |
| CGCG420–15 | 133.0 | 43.88 | 3, 4 |
| ESO 005–G004 | 28.5 | 41.97 | |
| Mrk 3 | 60.0 | 43.23 | 5 |
| NGC 2273 | 31.7 | 42.39 | |
| ESO 565–G019 | 78.4 | 43.00 | 6 |
| NGC 3079 | 19.7 | 42.27 | |
| IC 2560 | 43.1 | 42.89 | 1 |
| NGC 3281 | 52.4 | 43.22 | |
| Mrk 34 | 236.0 | 43.95 | 4 |
| NGC 3393 | 50.0 | 42.92 | 7 |
| Arp 299B | 44.0 | 43.18 | 8 |
| NGC 4102 | 19.0 | 42.24 | 9 |
| NGC 4939 | 51.1 | 42.74 | |
| NGC 4945 | 3.8 | 42.52 | 10 |
| NGC 5194 | 8.1 | 40.70 | |
| Circinus | 4.2 | 42.58 | 11 |
| NGC 5728 | 30.0 | 42.77 | |
| ESO 138–G001 | 41.5 | 42.58 | |
| NGC 6240 | 112.0 | 44.08 | 12, 13 |
| NGC 7582 | 22.0 | 42.58 |
Distances are redshift-independent estimates from NED for the closest sources, or luminosity distances from the respective references, corrected for cosmology. References. (1) Baloković et al. (2014); (2) Bauer et al. (2014, in prep); (3) Severgnini et al. (2011); (4) this work; (5) Awaki et al. (2008); (6) Gandhi et al. (2013); (7) Fabbiano et al. (2011); (8) Ptak et al. (2014); (9) González-Martín et al. (2011); (10) Puccetti et al. (2014); (11) Arévalo et al. (2014); (12) Vignati et al. (1999); (13) Puccetti et al. (2014, in prep.). Where not stated, the reference is the compilation by Goulding et al. (2012) and papers referred to therein. Mrk 231, NGC 7674 and IRAS 19254–72 are not included as a result of recent updates to the intrinsic luminosities (see text).
References
- Akylas et al. (2012) Akylas, A., Georgakakis, A., Georgantopoulos, I., Brightman, M., & Nandra, K. 2012, A&A, 546, A98, arXiv:1209.5398
- Alexander et al. (2013) Alexander, D. M. et al. 2013, ApJ, 773, 125, arXiv:1307.1733
- Alonso-Herrero et al. (2012) Alonso-Herrero, A., Pereira-Santaella, M., Rieke, G. H., & Rigopoulou, D. 2012, ApJ, 744, 2, 1109.1372
- Arévalo et al. (2014) Arévalo, P. et al. 2014, ApJ in press, arXiv:1406.3345
- Arnaud (1996) Arnaud, K. A. 1996, in ASP Conf. Ser. 101: Astronomical Data Analysis Software and Systems V, eds. George H. Jacoby and Jeannette Barnes, Vol. 5, 17–+
- Asmus et al. (2011) Asmus, D., Gandhi, P., Smette, A., Hönig, S. F., & Duschl, W. J. 2011, A&A, 536, A36, 1109.4873
- Asmus et al. (2014) Asmus, D., Hönig, S. F., Gandhi, P., Smette, A., & Duschl, W. J. 2014, MNRAS, 439, 1648, 1310.2770
- Assef et al. (2013) Assef, R. J. et al. 2013, ApJ, 772, 26
- Awaki et al. (2008) Awaki, H. et al. 2008, PASJ, 60, 293, arXiv:0707.2425
- Ballantyne et al. (2011) Ballantyne, D. R., Draper, A. R., Madsen, K. K., Rigby, J. R., & Treister, E. 2011, ApJ, 736, 56, arXiv:1105.0965
- Baloković et al. (2014) Baloković et al. 2014, ApJ submitted
- Bassani et al. (1999) Bassani, L., Dadina, M., Maiolino, R., Salvati, M., Risaliti, G., della Ceca, R., Matt, G., & Zamorani, G. 1999, ApJS, 121, 473
- Baumgartner et al. (2013) Baumgartner, W. H., Tueller, J., Markwardt, C. B., Skinner, G. K., Barthelmy, S., Mushotzky, R. F., Evans, P. A., & Gehrels, N. 2013, ApJS, 207, 19, arXiv:1212.3336
- Bianchi et al. (2010) Bianchi, S., Chiaberge, M., Evans, D. A., Guainazzi, M., Baldi, R. D., Matt, G., & Piconcelli, E. 2010, MNRAS, 405, 553, arXiv:1002.0800
- Bianchi et al. (2005) Bianchi, S., Guainazzi, M., Matt, G., Chiaberge, M., Iwasawa, K., Fiore, F., & Maiolino, R. 2005, A&A, 442, 185, astro-ph/0507323
- Bolton et al. (2012) Bolton, A. S. et al. 2012, AJ, 144, 144, 1207.7326
- Boroson & Green (1992) Boroson, T. A., & Green, R. F. 1992, ApJS, 80, 109
- Brightman & Nandra (2011) Brightman, M., & Nandra, K. 2011, MNRAS, 413, 1206, arXiv:1012.3345
- Brightman & Ueda (2012) Brightman, M., & Ueda, Y. 2012, MNRAS, 423, 702, arXiv:1203.1045
- Burlon et al. (2011) Burlon, D., Ajello, M., Greiner, J., Comastri, A., Merloni, A., & Gehrels, N. 2011, ApJ, 728, 58, arXiv:1012.0302
- Cano-Díaz et al. (2012) Cano-Díaz, M., Maiolino, R., Marconi, A., Netzer, H., Shemmer, O., & Cresci, G. 2012, A&A, 537, L8, 1112.3071
- Cappi et al. (2006) Cappi, M. et al. 2006, A&A, 446, 459, arXiv:astro-ph/0509584
- Comastri et al. (2011) Comastri, A. et al. 2011, A&A, 526, L9, arXiv:1012.4011
- Comastri et al. (1995) Comastri, A., Setti, G., Zamorani, G., & Hasinger, G. 1995, A&A, 296, 1+
- Crook et al. (2007) Crook, A. C., Huchra, J. P., Martimbeau, N., Masters, K. L., Jarrett, T., & Macri, L. M. 2007, ApJ, 655, 790, astro-ph/0610732
- Dahari & De Robertis (1988) Dahari, O., & De Robertis, M. M. 1988, ApJS, 67, 249
- Del Moro et al. (2014) Del Moro, A. et al. 2014, ApJ, 786, 16, arXiv:1403.2491
- Della Ceca et al. (2008) Della Ceca, R. et al. 2008, Mem. Soc. Astron. Italiana, 79, 65, arXiv:0709.3060
- Di Matteo et al. (2005) Di Matteo, T., Springel, V., & Hernquist, L. 2005, Nature, 433, 604, arXiv:astro-ph/0502199
- Dickey & Lockman (1990) Dickey, J. M., & Lockman, F. J. 1990, ARA&A, 28, 215
- Done et al. (2003) Done, C., Madejski, G. M., Życki, P. T., & Greenhill, L. J. 2003, ApJ, 588, 763, arXiv:astro-ph/0301383
- Donley et al. (2012) Donley, J. L. et al. 2012, ApJ, 748, 142, 1201.3899
- Draper & Ballantyne (2010) Draper, A. R., & Ballantyne, D. R. 2010, ApJL, 715, L99, 1004.0690
- Draper & Ballantyne (2012) ——. 2012, ApJ, 751, 72, 1203.5117
- Elvis et al. (1994) Elvis, M. et al. 1994, ApJS, 95, 1
- Fabbiano et al. (2011) Fabbiano, G., Wang, J., Elvis, M., & Risaliti, G. 2011, Nature, 477, 431, arXiv:1109.0483
- Fabian et al. (2008) Fabian, A. C., Vasudevan, R. V., & Gandhi, P. 2008, MNRAS, 385, L43, arXiv:0712.0277
- Falcke et al. (1998) Falcke, H., Wilson, A. S., & Simpson, C. 1998, ApJ, 502, 199, astro-ph/9801086
- Feruglio et al. (2011) Feruglio, C., Daddi, E., Fiore, F., Alexander, D. M., Piconcelli, E., & Malacaria, C. 2011, ApJL, 729, L4, 1101.3478
- Fischer et al. (2013) Fischer, T. C., Crenshaw, D. M., Kraemer, S. B., & Schmitt, H. R. 2013, ApJS, 209, 1, arXiv:1308.4129
- Gandhi et al. (2004) Gandhi, P., Crawford, C. S., Fabian, A. C., & Johnstone, R. M. 2004, MNRAS, 348, 529, astro-ph/0310772
- Gandhi & Fabian (2003) Gandhi, P., & Fabian, A. C. 2003, MNRAS, 339, 1095, astro-ph/0211129
- Gandhi et al. (2006) Gandhi, P., Fabian, A. C., & Crawford, C. S. 2006, MNRAS, 369, 1566, arXiv:astro-ph/0604184
- Gandhi et al. (2007) Gandhi, P., Fabian, A. C., Suebsuwong, T., Malzac, J., Miniutti, G., & Wilman, R. J. 2007, MNRAS, 382, 1005, arXiv:0709.1984
- Gandhi et al. (2009) Gandhi, P., Horst, H., Smette, A., Hönig, S., Comastri, A., Gilli, R., Vignali, C., & Duschl, W. 2009, A&A, 502, 457, arXiv:0902.2777
- Gandhi et al. (2013) Gandhi, P. et al. 2013, ApJ, 773, 51, arXiv:1305.4901
- Georgantopoulos et al. (2013) Georgantopoulos, I. et al. 2013, A&A, 555, A43
- Gilli et al. (2007) Gilli, R., Comastri, A., & Hasinger, G. 2007, A&A, 463, 79, astro-ph/0610939
- González Delgado et al. (2001) González Delgado, R. M., Heckman, T., & Leitherer, C. 2001, ApJ, 546, 845, arXiv:astro-ph/0008417
- González-Martín et al. (2011) González-Martín, O. et al. 2011, A&A, 527, A142, arXiv:1012.3080
- Goulding et al. (2012) Goulding, A. D., Alexander, D. M., Bauer, F. E., Forman, W. R., Hickox, R. C., Jones, C., Mullaney, J. R., & Trichas, M. 2012, ApJ, 755, 5, arXiv:1205.1800
- Greenhill et al. (2008) Greenhill, L. J., Tilak, A., & Madejski, G. 2008, ApJL, 686, L13, 0809.1108
- Guainazzi & Bianchi (2007) Guainazzi, M., & Bianchi, S. 2007, MNRAS, 374, 1290, arXiv:astro-ph/0610715
- Guainazzi et al. (2009) Guainazzi, M., Risaliti, G., Nucita, A., Wang, J., Bianchi, S., Soria, R., & Zezas, A. 2009, A&A, 505, 589, 0908.0268
- Harrison et al. (2014) Harrison, C. M., Alexander, D. M., Mullaney, J. R., & Swinbank, A. M. 2014, MNRAS in press, arXiv:1403.3086
- Harrison et al. (2013) Harrison, F. A. et al. 2013, ApJ, 770, 103, arXiv:1301.7307
- Heckman et al. (1981) Heckman, T. M., Miley, G. K., van Breugel, W. J. M., & Butcher, H. R. 1981, ApJ, 247, 403
- Henkel et al. (2005) Henkel, C., Peck, A. B., Tarchi, A., Nagar, N. M., Braatz, J. A., Castangia, P., & Moscadelli, L. 2005, A&A, 436, 75, astro-ph/0503070
- Hickox et al. (2014) Hickox, R. C., Mullaney, J. R., Alexander, D. M., Chen, C.-T. J., Civano, F. M., Goulding, A. D., & Hainline, K. N. 2014, ApJ, 782, 9, arXiv:1306.3218
- Hönig et al. (2014) Hönig, S. F., Gandhi, P., Asmus, D., Mushotzky, R. F., Antonucci, R., Ueda, Y., & Ichikawa, K. 2014, MNRAS, 438, 647, 1311.4880
- Hopkins & Elvis (2010) Hopkins, P. F., & Elvis, M. 2010, MNRAS, 401, 7, arXiv:0904.0649
- Jia et al. (2013) Jia, J., Ptak, A., Heckman, T., & Zakamska, N. L. 2013, ApJ, 777, 27, arXiv:1205.0033
- Kennicutt (1998a) Kennicutt, Jr., R. C. 1998a, ARA&A, 36, 189, astro-ph/9807187
- Kennicutt (1998b) ——. 1998b, ApJ, 498, 541, astro-ph/9712213
- Kirsch et al. (2004) Kirsch, M. G. F. et al. 2004, in Society of Photo-Optical Instrumentation Engineers (SPIE) Conference Series, Vol. 5488, UV and Gamma-Ray Space Telescope Systems, ed. G. Hasinger & M. J. L. Turner, 103–114, astro-ph/0407257
- Komossa et al. (2003) Komossa, S., Burwitz, V., Hasinger, G., Predehl, P., Kaastra, J. S., & Ikebe, Y. 2003, ApJL, 582, L15, arXiv:astro-ph/0212099
- Konami et al. (2011) Konami, S., Matsushita, K., Tsuru, T. G., Gandhi, P., & Tamagawa, T. 2011, PASJ, 63, 913, arXiv:1108.5778
- Kondratko et al. (2006) Kondratko, P. T., Greenhill, L. J., & Moran, J. M. 2006, ApJ, 652, 136, astro-ph/0610060
- Koss et al. (2013) Koss, M., Mushotzky, R., Baumgartner, W., Veilleux, S., Tueller, J., Markwardt, C., & Casey, C. M. 2013, ApJL, 765, L26, 1302.0850
- Kuo et al. (2011) Kuo, C. Y. et al. 2011, ApJ, 727, 20, 1008.2146
- Lacy et al. (2004) Lacy, M. et al. 2004, ApJS, 154, 166
- LaMassa et al. (2014) LaMassa et al. 2014, ApJ in press, arXiv:1404.0012L
- Lansbury et al. (2014) Lansbury, G. B. et al. 2014, ApJ, 785, 17, arXiv:1402.2666
- Liu et al. (2013) Liu, G., Zakamska, N. L., Greene, J. E., Nesvadba, N. P. H., & Liu, X. 2013, MNRAS, 436, 2576, 1305.6922
- Magdziarz & Zdziarski (1995) Magdziarz, P., & Zdziarski, A. A. 1995, MNRAS, 273, 837
- Mainieri et al. (2011) Mainieri, V. et al. 2011, A&A, 535, A80, arXiv:1105.5395
- Marconi & Hunt (2003) Marconi, A., & Hunt, L. K. 2003, ApJL, 589, L21, astro-ph/0304274
- Mateos et al. (2012) Mateos, S. et al. 2012, MNRAS, 426, 3271, arXiv:1208.2530
- Mateos et al. (2005) ——. 2005, A&A, 433, 855
- Matt et al. (2000) Matt, G., Fabian, A. C., Guainazzi, M., Iwasawa, K., Bassani, L., & Malaguti, G. 2000, MNRAS, 318, 173
- McCarthy (1993) McCarthy, P. J. 1993, ARA&A, 31, 639
- McConnell & Ma (2013) McConnell, N. J., & Ma, C.-P. 2013, ApJ, 764, 184, arXiv:1211.2816
- Merloni et al. (2014) Merloni, A. et al. 2014, MNRAS, 437, 3550, arXiv:1311.1305
- Miley & De Breuck (2008) Miley, G., & De Breuck, C. 2008, A&A Rev., 15, 67, 0802.2770
- Mineo et al. (2012) Mineo, S., Gilfanov, M., & Sunyaev, R. 2012, MNRAS, 426, 1870, arXiv:1205.3715
- Miniutti et al. (2014) Miniutti, G. et al. 2014, MNRAS, 437, 1776, 1310.7701
- Mulchaey et al. (1994) Mulchaey, J. S., Koratkar, A., Ward, M. J., Wilson, A. S., Whittle, M., Antonucci, R. R. J., Kinney, A. L., & Hurt, T. 1994, ApJ, 436, 586
- Mullaney et al. (2013) Mullaney, J. R., Alexander, D. M., Fine, S., Goulding, A. D., Harrison, C. M., & Hickox, R. C. 2013, MNRAS, 433, 622, 1305.0263
- Murphy & Yaqoob (2009) Murphy, K. D., & Yaqoob, T. 2009, MNRAS, 397, 1549, arXiv:0905.3188
- Nair & Abraham (2010) Nair, P. B., & Abraham, R. G. 2010, ApJS, 186, 427, 1001.2401
- Nandra et al. (2013) Nandra, K. et al. 2013, The Hot and Energetic Universe: A White Paper presenting the science theme motivating the Athena+ mission, arXiv:1306.2307
- Nandra et al. (1997) Nandra, K., George, I. M., Mushotzky, R. F., Turner, T. J., & Yaqoob, T. 1997, ApJL, 488, L91+, arXiv:astro-ph/9708030
- Nandra et al. (2007) Nandra, K., O’Neill, P. M., George, I. M., & Reeves, J. N. 2007, MNRAS, 382, 194, 0708.1305
- Netzer et al. (2006) Netzer, H., Mainieri, V., Rosati, P., & Trakhtenbrot, B. 2006, A&A, 453, 525, astro-ph/0603712
- Norman et al. (2002) Norman, C. et al. 2002, ApJ, 571, 218
- Oh et al. (2011) Oh, K., Sarzi, M., Schawinski, K., & Yi, S. K. 2011, ApJS, 195, 13, arXiv:1106.1896
- Panessa et al. (2006) Panessa, F., Bassani, L., Cappi, M., Dadina, M., Barcons, X., Carrera, F. J., Ho, L. C., & Iwasawa, K. 2006, A&A, 455, 173, arXiv:astro-ph/0605236
- Pfefferkorn et al. (2001) Pfefferkorn, F., Boller, T., & Rafanelli, P. 2001, A&A, 368, 797, astro-ph/0101184
- Piconcelli et al. (2005) Piconcelli, E., Jimenez-Bailón, E., Guainazzi, M., Schartel, N., Rodríguez-Pascual, P. M., & Santos-Lleó, M. 2005, A&A, 432, 15, arXiv:astro-ph/0411051
- Planck Collaboration (2013) Planck Collaboration. 2013, A&A submitted, arXiv:1303.5076
- Ptak et al. (2006) Ptak, A., Zakamska, N. L., Strauss, M. A., Krolik, J. H., Heckman, T. M., Schneider, D. P., & Brinkmann, J. 2006, ApJ, 637, 147, astro-ph/0510204
- Ptak et al. (2014) Ptak et al. 2014, ApJ submitted
- Puccetti et al. (2014) Puccetti et al. 2014, ApJ submitted
- Reyes et al. (2008) Reyes, R. et al. 2008, AJ, 136, 2373, arXiv:0801.1115
- Ricci et al. (2011) Ricci, C., Walter, R., Courvoisier, T. J.-L., & Paltani, S. 2011, A&A, 532, A102, arXiv:1104.3676
- Risaliti et al. (2005) Risaliti, G., Elvis, M., Fabbiano, G., Baldi, A., & Zezas, A. 2005, ApJL, 623, L93
- Sanders et al. (2003) Sanders, D. B., Mazzarella, J. M., Kim, D.-C., Surace, J. A., & Soifer, B. T. 2003, AJ, 126, 1607, astro-ph/0306263
- Schlafly & Finkbeiner (2011) Schlafly, E. F., & Finkbeiner, D. P. 2011, ApJ, 737, 103, arXiv:1012.4804
- Severgnini et al. (2011) Severgnini, P., Caccianiga, A., Della Ceca, R., Braito, V., Vignali, C., La Parola, V., & Moretti, A. 2011, A&A, 525, A38, 1010.2085
- Smith et al. (2001) Smith, R. K., Brickhouse, N. S., Liedahl, D. A., & Raymond, J. C. 2001, ApJL, 556, L91, arXiv:astro-ph/0106478
- Stern et al. (2012) Stern, D. et al. 2012, ApJ, 753, 30, 1205.0811
- Stern et al. (2005) ——. 2005, ApJ, 631, 163, astro-ph/0410523
- Stern et al. (2014) ——. 2014, ApJ submitted, arXiv:1403.3078
- Stern et al. (2002) ——. 2002, ApJ, 568, 71
- Stoklasová et al. (2009) Stoklasová, I., Ferruit, P., Emsellem, E., Jungwiert, B., Pécontal, E., & Sánchez, S. F. 2009, A&A, 500, 1287, 0905.3349
- Takahashi et al. (2012) Takahashi, T. et al. 2012, in Society of Photo-Optical Instrumentation Engineers (SPIE) Conference Series, Vol. 8443, Society of Photo-Optical Instrumentation Engineers (SPIE) Conference Series, arXiv:1210.4378
- Teng et al. (2014) Teng, S. H. et al. 2014, ApJ, 785, 19, arXiv:1402.4811
- Tozzi et al. (2009) Tozzi, P. et al. 2009, ApJ, 698, 740, 0902.2930
- Treister et al. (2009) Treister, E., Urry, C. M., & Virani, S. 2009, ApJ, 696, 110, arXiv:0902.0608
- Tremaine et al. (2002) Tremaine, S. et al. 2002, ApJ, 574, 740, astro-ph/0203468
- Ueda et al. (2014) Ueda, Y., Akiyama, M., Hasinger, G., Miyaji, T., & Watson, M. G. 2014, ApJ submitted, arXiv:1402.1836
- Ueda et al. (2007) Ueda, Y. et al. 2007, ApJL, 664, L79, arXiv:0706.1168
- Ulvestad & Wilson (1984) Ulvestad, J. S., & Wilson, A. S. 1984, ApJ, 278, 544
- Vasudevan et al. (2010) Vasudevan, R. V., Fabian, A. C., Gandhi, P., Winter, L. M., & Mushotzky, R. F. 2010, MNRAS, 402, 1081, arXiv:0910.5256
- Vasudevan et al. (2013) Vasudevan, R. V., Mushotzky, R. F., & Gandhi, P. 2013, ApJL, 770, L37, arXiv:1305.6611
- Veilleux et al. (2009) Veilleux, S. et al. 2009, ApJS, 182, 628, 0905.1577
- Vignali et al. (2004) Vignali, C., Alexander, D. M., & Comastri, A. 2004, MNRAS, 354, 720, astro-ph/0407293
- Vignali et al. (2006) ——. 2006, MNRAS, 373, 321, astro-ph/0609089
- Vignali et al. (2010) Vignali, C., Alexander, D. M., Gilli, R., & Pozzi, F. 2010, MNRAS, 404, 48, arXiv:1001.2005
- Vignati et al. (1999) Vignati, P. et al. 1999, A&A, 349, L57, astro-ph/9908253
- Wang et al. (2011) Wang, J. et al. 2011, ApJ, 742, 23, 1103.1913
- Wang et al. (2014) ——. 2014, ApJ, 781, 55, 1303.2980
- Wang et al. (2007) Wang, J.-M., Chen, Y.-M., Yan, C.-S., Hu, C., & Bian, W.-H. 2007, ApJL, 661, L143, 0704.2288
- Wilkes et al. (2013) Wilkes, B. J. et al. 2013, ApJ, 773, 15, 1306.0850
- Wright et al. (2010) Wright, E. L. et al. 2010, AJ, 140, 1868, arXiv:1008.0031
- Yaqoob (2012) Yaqoob, T. 2012, MNRAS, 423, 3360, arXiv:1204.4196
- Zakamska et al. (2003) Zakamska, N. L. et al. 2003, AJ, 126, 2125, astro-ph/0309551