34121 Kassel, Germany
11email: {scholz,atzmueller,stumme}@cs.uni-kassel.de
Link Prediction and the Role of Stronger Ties in Networks of Face-to-Face Proximity
Abstract
Understanding the structures why links are formed is an important and prominent research topic. In this paper, we therefore consider the link prediction problem in face-to-face contact networks, and analyze the predictability of new and recurring links. Furthermore, we study additional influence factors, and the role of stronger ties in these networks. Specifically, we compare neighborhood-based and path-based network proximity measures in a threshold-based analysis for capturing temporal dynamics. The results and insights of the analysis are a first step onto predictability applications for human contact networks, for example, for improving recommendations.
1 Introduction
Link prediction is a powerful approach in various application contexts, for example, for supporting recommendation systems. Typically, it leverages crowd or collective intelligence [30, 23] captured by a set of actions or measurements; from these, social interaction networks [31, 32, 33] between different actors are then derived, and investigated using different link prediction measures. The analysis of such measures can then help in order to understand structural mechanisms of link creation, its dynamics, and for building effective link prediction algorithms. With the growing amount of social data, ubiquitous systems, and mobile social media applications for participatory sensing, link analysis is receiving increased attention. This especially relates to the dynamics of link creation [1], e. g., concerning their mobility [42, 11] and dynamic behavior [43, 40].
This paper focuses on the analysis of social networks captured in mobile and ubiquitous settings – utilizing data from offline networks captured by RFID tags. In particular, we analyze the predictability of links in such networks of face-to-face proximity comparing several path-based and neighborhood-based network proximity measures. While there is a large body of research concerning online social networks, e. g., [26, 34, 18, 28, 20, 46, 24, 25], important aspects of offline social networking still remains largely unexplored. The analysis of such networks and the contained crowd intelligence can potentially provide more direct answers to fundamental questions, e. g., how do personal links get established, is it possible to correlate this with roles, how does personal communication evolve?
In this paper, we aim at providing first insights for answering such questions, also in order to leverage our analysis results for improving link prediction methods. We focus on real-world offline networks of human contacts, that is, face-to-face contacts between persons. In contrast to virtual networks, these contacts were acquired using a ubiquitous RFID-based system that allows us to collect individual face-to-face contacts. Thus, we can observe and analyze social interaction at a very detailed level, including the specific event sequences and durations.
For link prediction, we aim at predicting new contacts based on network properties, as an adaptation of methods for online social networks. In addition, we extend the analysis in two important directions: First, we consider recurring links: These are generated repeatedly in a network, i. e., if a link between actors is formed multiple times. A prominent case of recurring links are face-to-face interactions. Second, we analyze influence factors and patterns for establishing such contacts, and also consider their specific durations in a fine-grained dynamic analysis. Essentially, this also leads to a comprehensive analysis of the impact of weaker ties for new and recurring contacts.
The context of our work is established by the social conference guidance system Conferator [4] implemented using the Ubicon [3] platform (http://www.ubicon.eu). It provides ubiquitous access to conference information and allows conference participants to manage their contacts at the conference and to personalize their conference program. Using the system, conference participants can recall their individual contacts after the conference, e. g., as virtual business cards. In addition, we apply link prediction for recommending interesting contacts, i. e., other participants. The system utilizes active RFID technology from the Sociopatterns project http://www.sociopatterns.org which allows us to analyze the collected contact (proximity) data between the participants as a proxy for their face-to-face contacts, as participatory sensing data of the whole conference. Using this data, we can derive special interaction networks, i. e., contact networks, and apply those for link prediction.
For the analysis, we apply real-world data collected at three scientific conferences, i. e., the LWA 2010 conference in Kassel, Germany, the Hypertext 2011 conference in Eindhoven, The Netherlands, and the LWA 2012 conference in Dortmund, Germany, using the Conferator system. The results of the analysis indicate that weaker ties have a strong influence on the contact behavior and the prediction performance. We show, that there are clear influence patterns of the contact durations. Furthermore, we show that stronger links are better predictable than weaker links. Moreover, considering the contact durations in the ranking of the predicted contacts significantly improves the performance for the prediction of recurring links. This can be generalized for all three conferences. Our contribution is summarized as follows:
-
1.
Concerning link prediction, we analyze the problem of predicting links in real-world human contact networks, focusing on new links.
-
2.
We adapt different state-of-the-art network proximity measures for the link prediction setting.
-
3.
We extend the basic link prediction problem, for predicting recurring links.
-
4.
We compare neighborhood-based and path-based network proximity measures for the prediction of new and recurring links in networks of face-to-face proximity, using a threshold-based analysis for capturing contact dynamics; we show that stronger links are better predictable than weaker links. Moreover, we compare the performance of all considered measures to the current tie strength predictor.
-
5.
Finally, we analyze the role of weak ties between actors, and show that they weaken the performance of the predictors.
The remainder of this paper is structured as follows: Section 2 discusses related work. After that, Section 3 describes the RFID hardware setting and the collected datasets. Next, we present the used network proximity measures and link prediction techniques in Section 4. We then discuss the results in Section 5. Finally, Section 6 concludes with a summary and interesting options for future work. This article is a significantly extended and revised version of [37] and [38].
2 Related Work
Before we focus on link prediction below, we first discuss related work concerning the analysis of human contact behavior, and the relevant connections.
2.1 Analysis of Human Contacts
Contacts patterns in social networks, and their underlying mechanisms are a classic topic of social network analysis. However, the analysis of offline social networks, focusing on human contacts, has been largely neglected. In this context, Eagle et al. [16] and Zhoe et al. [18] presented an analysis of proximity information collected by devices based on Bluetooth communication, similar to Xu et al. [45], who also related this to online social networks.
However, in all these experiments it was not possible to reliably detect face-to-face contacts. In contrast, in our experiments we use a new generation of active RFID tags (proximity tags). The technical innovation of these tags is the possibility to detect the proximity of other tags, which allows us to recognize face-to-face contacts at a high detailed level including specific points in time and their durations.
One of the first experiments using proximity tags was conducted by Cattuto and colleagues in [2] at the ESWC 2009 conference. Here, the authors presented a novel application that combines online and offline data from the conference attendees. In [14], Cattuto and colleagues compared the attendees’ contact patterns with their research seniority and their activity in social web platforms. They also extended their analysis to healthcare environments [12] and schools [39]. In [29], we analyzed the dynamics of participants’ contact pattern at conferences, and also the connection between academic jobs and roles at a conference. In [5, 21, 22] the authors described the dynamics of community and contact structures. However, no analysis or application towards link prediction has been performed using the approaches discussed above. We discuss this important aspect in more detail below.
2.2 Link Prediction
The prediction of new links between nodes in a social network is a challenging task. A first comprehensive fundamental analysis was done by [26]. Here, the authors defined the link prediction problem and studied link prediction approaches based on proximity measures of nodes in a co-authorship network of physics. [34] analyzed weighted variants of different network proximity measures. [42] examined the impact of human mobility on link prediction. [27] presented a new unsupervised (a restricted variant of rooted PageRank) and a new supervised method for the prediction of new links. [10] introduced a supervised method, based on supervised random walks, for the prediction of new links.
However, most of these approaches analyzed the predictability of new links in online social networks like Facebook or DBLP. The prediction of links in offline social networks has been largely neglected. For reliably detecting face-to-face proximity, a new generation of active RFID tags has been developed by the SocioPatterns collaboration, cf. [13], which we also applied for the data analyzed in this work. In [37], we presented a first analysis concerning the predictability of new and recurring links in real world face-to-face contact networks. In [35], we further showed that the predictability of new links can be further improved by data from online networks, proposing a new unsupervised link prediction method that combines the information of different networks. In [36], we analyzed triadic closure in face-to-face contact networks. In [41], the authors also analyzed the quality of unsupervised methods in the context of link prediction in face-to-face proximity networks; they compared the predictability of links in face-to-face contact networks and other types of social networks, supporting our earlier work presented in [37].
3 Face-to-Face Contact Data
In the following section, we first describe the applied active RFID technology for collecting the data. Next, we present the three datasets collected at the LWA 2010,111http://www.kde.cs.uni-kassel.de/conf/lwa10/ the Hypertext 2011222http://www.ht2011.org/ and the LWA 2012333http://lwa2012.cs.tu-dortmund.de/ conferences, and provide initial characteristic statistics. After that, we define our problem setting for link prediction, and describe, how we model the underlying networks.
3.1 RFID Datasets
For our experiments we asked each conference participant to wear an active RFID tag. These so called proximity tags are developed by the SocioPatterns project. One decisive factor of these tags is the possibility to detect other proximity tags within a range of up to 1.5 meters which allows us to identify and analyze human face-to-face contacts. Each RFID tag sends signals to RFID readers that are placed at fixed positions in the conference area. The RFID readers forward these signals to a central server, where all signals are stored into a database. Each signal contains the ID of the transmitting tag and the IDs of all RFID tags in its proximity. For more information about the proximity tags we refer to [13] and the OpenBeacon website (http://www.openbeacon.org).
Table 1 gives a detailed description of the collected datasets. For the LWA 2010, Hypertext (HT) 2011, and LWA 2012 conferences, we used the first day of the conference as training data. Hence, we aim to predict new and recurring contacts of day two and three. In Figure 1, we observe the typical distribution of all face-to-face contacts for all three conferences. Confirming previous findings, e.g. in [19, 5, 29], most of the aggregated contacts take less than two minutes and the aggregated contact durations of both conferences show a long-tailed distribution. In addition, Figure 1 shows, that the number of long aggregated face-to-face contacts at LWA 2012 was significantly higher than at HT 2011 and LWA 2010. The diameter and average path length of is similar to the results presented in [19, 5].
| LWA 2010 | HT 2011 | LWA 2012 | |
|---|---|---|---|
| #days | |||
| Avg.Deg.() | |||
| APL () | |||
| ACL () | |||
| LCN () | |||
| d () | |||
| Avg.Deg.() | |||
| APL () | |||
| LCN () | |||
| d () | |||
| Avg.Deg.() | |||
| APL () | |||
| LCN () | |||
| d () |

3.2 Problem Statement
Let be a point in time during the conference. For the prediction task, we consider all face-to-face contacts starting before as training data and face-to-face contacts starting later as test data.
The training data is thus the undirected graph , where is the set of all participants who had at least one face-to-face contact with some other participant before ; two participants are connected by an edge , if they had at least one face-to-face contact before . The weight is the sum of the durations of all their face-to-face contacts before . The test data is the undirected graph , where is the set of participants who had at least one contact during the training interval and at least one contact during the test interval: Two participants are connected by an edge if and had at least one face-to-face contact after . The weight sums up the durations of all their face-to-face contacts after .
Prediction Tasks. In this paper, we consider the following link prediction tasks:
-
1.
New links only (as in [26]), i. e., all links in .
-
2.
Recurring links, i. e., all links in .
Note that — following the approach in [26] — the training set contains all vertices of , while the test set contains only vertices , i. e., those that are present in the core.
4 Network Proximity Measures
In this section, we discuss neighborhood-based and path-based measures used in our analysis for the prediction tasks. Focussing on unsupervised methods, most of the predictor scores are based on either nodes’ neighborhoods or path information. All of these proximity measures are based on the assumption that two nodes have a higher probability to become connected, if these two nodes are close in the graph.
4.1 Neighborhood-based Network Proximity Measures
In Table 2, we provide a detailed overview of the used unweighted and weighted proximity measures. The measure Common Neighbors is based on the assumption that it is more likely that two nodes are connected if these two nodes have many neighbors in common. Adamic Adar and Resource Allocation are similar to Common Neighbors, but here the Common Neighbors are weighted with respect to their degree. Considering Jaccard’s Coefficient it is more likely that two nodes are connected, if these two nodes share a high fraction of their respective neighborhood. Preferential Attachment is based on the assumption, that the probability [11] of a new node being connected to node is proportional to the degree of . We define the neighborhood for a node , i. e., the set of neighbors , as
| Measure | Unweighted | Weighted |
|---|---|---|
| Common Neighbors | ||
| Adamic-Adar | ||
| Jaccard’s Coefficient | ||
| Resource Allocation | ||
| Pref. Attachment |
4.2 Path-based Network Proximity Measures
The rooted PageRank [26] predictor is an adaption of the PageRank algorithm [15] for the link prediction task. The rooted PageRank algorithm computes the stationary probability distribution of participant under the following random walk [26]:
-
•
With probability , jump to .
-
•
With probability , jump to a random neighbor of the current node.
The Katz [20] predictor is defined as
where is, for , the set of paths from to with length . We note that is a damping factor that weights short paths higher/lower in the summation.
5 Analysis
In this section, we study the link prediction problem on human contact networks. As already done in literature [42, 26, 34], we analyze the predictability of several network proximity measures (see Table 2). In contrast to previous work, we also extend our studies to the prediction of recurring links, and analyze the influence of weak ties. Furthermore, we study the predictability of stronger ties concerning the new and recurring link prediction problem. We start with some statistics about the contact behavior of participants at the three conferences.
5.1 Human Communication Statistics and Basic Analysis
Knowledge about human communication behavior is important to improve the prediction of future links. We therefore present some new insights into the communication behavior of participants during a conference. In Figure 2, we analyze the average contact length distribution with the longest, second longest, , tenth longest contact. On average, each participant’s longest face-to-face contact is at least one third of his total face-to-face contact time. This fraction decreases rapidly (from 33 percent for the longest contact), when we consider the fraction of the second longest contact. Here, the fraction of the contact length compared to the overall contact length is approximately 17 to 19 percent. Interestingly, all bar-plots look quite similar at all conference datasets. This might indicate, that this is the typical behavior in a conference setting.


| LWA 2010 | HT 2011 | LWA 2012 | ||||
|---|---|---|---|---|---|---|
| Contacts | Contacts | Contacts | Contacts | Contacts | Contacts | |
| no | 1230 | 836 | 798 | 666 | 320 | 186 |
| 110 | 56 | 98 | 79 | 45 | 25 | |
| 63 | 22 | 64 | 43 | 34 | 11 | |
| 56 | 19 | 60 | 43 | 30 | 13 | |
| 58 | 17 | 62 | 39 | 33 | 8 | |
| 31 | 6 | 40 | 22 | 18 | 2 | |
| 48 | 4 | 54 | 18 | 16 | 2 | |
Will participants who had a contact at the first day of the conference recur this contact again on the second or third day? For answering this question and for understanding its mechanisms it is important to consider the contact length from the first day of the conference. In Figure 3, we observe the clear trend, that a contact is more likely to be renewed the longer the contact on the first day. In Figure 4, we plot the distribution of all contacts for the second and third day, depending on the contact length of the first day. We observe, that a longer contact is more likely, the longer the contact on the first day. An interesting further question is then to find typical features to predict renewed contacts and their length.


5.2 Role-based Influence Factors
In the following, we analyze the impact of a number of (external) role-based factors for the link-prediction problem, relating to properties of the people collaborating in the contact network. Specifically, we focus on the prediction of new contacts and recurring links.
We use pattern mining for identifying characteristic patterns [7, 6] describing subgroups with a high share of new contacts. The applied technique is subgroup discovery, e.g., [8, 9, 44]: Basically, we aim at discovering subgroups of participants described by combinations of factors, e.g., session chair AND strong affiliation that show a high share of a certain target property, an increased mean of new contacts compared to the default share. Intuitively, we identify conjunctions of attribute values describing subsets of a dataset that maximize a given property, e.g., an increased mean of an attribute in the subset compared to the whole dataset. In the patterns described below, this target attribute is given by the mean contact count of new contacts.
| Academic Status | |
|---|---|
| Professor | 14 |
| PhD-candidate | 34 |
| PhD | 20 |
| Other | 7 |
| Affiliation with HT | |
|---|---|
| high | 12 |
| medium | 17 |
| low | 46 |
| # | Lift | Mean | Size | Description |
|---|---|---|---|---|
| 1 | 1.58 | 8.50 | 6 | session chair AND strong affiliation |
| 2 | 1.55 | 8.36 | 11 | professor |
| 3 | 1.35 | 7.25 | 8 | session chair |
| 4 | 1.31 | 7.08 | 12 | strong affiliation |
| 5 | 1.08 | 5.81 | 16 | presenter |
| # | Lift | Mean | Size | Description |
|---|---|---|---|---|
| 1 | 2.10 | 5944.17 | 6 | PhD AND low affiliation |
| 2 | 1.52 | 4297.15 | 26 | low affiliation |
| 3 | 1.09 | 3089.00 | 6 | session chair AND professor |
| 4 | 1.08 | 3038.67 | 21 | PhD candidate |
| 5 | 1.06 | 3003.93 | 14 | PhD |
| 6 | 0.87 | 2461.25 | 8 | session chair |
| 7 | 0.82 | 2326.18 | 11 | professor |
We focused on different subgroup structures, i. e., partitionings, induced by academic status, affiliation with the Hypertext conference series, and affiliation with one of the four conference tracks. In Table 4, we present some statistics about the different subgroups. We classify participants as highly affiliated with the Hypertext conference series if they presented a paper more than three times at Hypertext conferences in different years. The affiliation of a participant is low when he or she has never presented a paper or presented a paper at Hypertext 2011 for the first time. All other participants are classified with a medium affiliation. The tables show the lift of the pattern assessing the ratio of the mean of new contacts covered by the pattern and the fraction of the whole dataset, the size of the pattern extension (number of described participants), and the description itself. The first line in Table 5, for example, shows that being a session chair with a strong affiliation to HT 2011 increases the mean number of new contacts by .
Below, we exemplarily show interesting patterns with respect to the Hypertext 2011 conference. We collected conference and participants roles and analyzed their correlation with the emergence of new contacts. As shown in Table 5, as expected we observe an influence of being a session chair at the conference; this is even increased for participants with stronger affiliation to the conference, i.e., if participants are more experienced and also have more publications at previous conferences. As expected, we observe that presenters encounter a lot of new contacts. Also, the academic status of Professor increases the contact count, as also confirmed by the LWA 2010 data.
In addition to new contacts, we also analyzed recurring contacts and their contact durations. Table 6 shows exemplary patterns for the Hypertext 2011 conference. While we observe, that people with a low affiliation, i. e., participants that are new to the conference are still very active after the first day, an interesting finding for Hypertext is, that being a session chair and being a professor increases the mean duration of contacts by while the single factors alone inhibit the duration ( and , respectively). For the LWA 2010, for example, we found a slightly different pattern; the organizers were still very active (increase by ), but the professors scored as expected (increase by ).
5.3 Evaluation Method
For the evaluation of link prediction measures, often the precision of the top predicted links is used [26], where is the number of positive links (i.e. the number of new or renewed links on day 2 and 3). In this work, we measure the accuracy by the area under a receiver operating characteristic (AUC) [17]. In short, receiver operating characteristic (ROC) graphs plot the true positive rate on the -axis and the false positive rate on the -axis, concerning the set of predictions (ranking). The advantage of AUC is that it considers the whole ranking. For the prediction of new or recurring links each network proximity measure (predictor) outputs a ranked list in decreasing order of confidence.
5.4 Prediction of New Links
In this subsection, we evaluate the quality of several link prediction measures (see Table 2) to predict new links, i. e., all links in . In Figure 5, we present the predictor scores of the original network proximity measure as well as the weighted variants of these measures. Figure 5 suggests, that the network structure helps to improve the prediction accuracy, because all measures outperform the random predictor (the AUC value of a random predictor is ). This also means that in a human contact network the network topology contains useful information for the prediction of new links. This result is not surprising, since it confirms the results of [26] and [42]. Here the authors analyzed the predictive power of proximity network measures in a co-authorship network and a mobile phone caller network. For the HT 2011 and LWA 2010 datasets the weighted variants of Resource Allocation and weighted Adamic Adar performed best. In Figure5 we further compared the AUC values of the original and the weighted versions of the proximity measures: Considering the neighborhood-based network proximity measures we observe that the weighted variants always achieve better results than the unweighted versions at the LWA 2010 and HT 2011 dataset. However this observation does not hold on the LWA 2012 dataset: The network statistics in Table 1 show, that for higher average contact lengths HT 2011LWA 2010LWA 2012 there is a tendency that unweighted variants tend to perform better compared to the weighted measures. We observe this tendency as an indicator of a certain bias of very strong links at the first day for the prediction of new contacts.
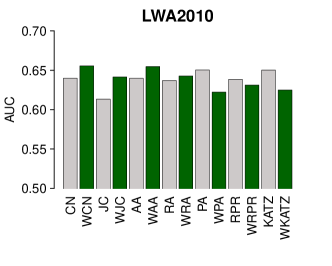


Figure 6 shows the development of the AUC values for all neighborhood-based and path-based network proximity measure, when we focus more and more on longer contacts. This means that we do not take into account contacts with contact length lower than a time threshold (value on the x-axis) and examine only the ranking positions of contacts greater than the time threshold . In Figure 6 we see an interesting development. On all datasets we observe that longer face-to-face contacts tend to be placed higher in the ranking than shorter contacts. In addition we observe that the weighted Preferential Attachment predictor performs very weak for stronger ties. Comparing the weighted and unweighted measures we could not find significant differences in prediction performance for stronger ties.
5.5 Influence Factors for the Prediction of Recurring Links
In the recurring link prediction problem we want to predict whether a link between two participants and will recur or not. Unlike the new link prediction problem [26], in the recurring link prediction problem we can also use the information about the already existing tie strength of the corresponding participants and .


Therefore, we analyze the influence of the number of common neighbors; in addition, we include the already existing tie strength on the recurrence of a link, complementing the analysis and questions already raised in Section 5.1. In Figure 7, we plot the probability for a recurring link with tie strength as a function of common neighbors and as function of the already existing tie strength. Given a face-to-face contact between two participants at the first day of the conference, we compute in this analysis whether a contact (with minimum contact duration ) recurs or not on the second or third day of the conference, depending on the number of common neighbors and existing tie strength of the first day. We observe, that the probability increases almost linearly the higher the number of common neighbors and the higher the already existing tie strengths are.
5.6 Predictability of Recurring Links in Face-to-Face Proximity Networks
In this section we evaluate and compare the quality of network-based and path-based network proximity measures to predict recurring links. Furthermore we use the current tie strength between two participants as predictor. For our prediction analysis, we compute these predictor scores, based on the face-to-face proximity network of the first day of the conference. Then we use these predictor scores to analyze its prediction quality with respect to whether a link will recur or not towards the end of the conference.


In Figure 8, we plot the AUC-values for all network proximity measures measures and the current tie strength (LEN). First, we observe that the network structure helps to improve the prediction accuracy, because all predictors outperform the random predictor. Furthermore we notice that the first day’s tie strength performs very well as predictor on all datasets. With respect to the HT 2011 and LWA 2012 dataset we see that path-based network proximity measures perform better than measures based on the nodes’ neighborhood. However this result does not hold on the LWA 2010 dataset.
In Figure 9, we focus more and more on longer face-to-face contacts for the link prediction task. This means that we only consider face-to-face contacts longer than a given time threshold . In Figure 9, this time threshold is defined by the -axis. Considering longer contacts, we observe that weighted path-based measures clearly outperform network proximity measures based on the nodes’ neighborhood. Furthermore, the figure shows that the weighted variants of the path-based measures perform much better than the unweighted variants. In addition we notice that (also for longer contacts) using the first day’s tie strength as predictor performs very well on all datasets. Except for the HT 2011 dataset, this predictor performs best. This is surprising, because we expected that the path-based measures would significantly outperform all other measures. Apparently, the combination of information of the node’s neighbourhood with the first day’s tie strength is boosting the performance. Considering the neighbourhood-based measures, we see that the unweighted Preferential Attachment predictor performs very weak on all datasets.


5.7 The Role of Weak Ties for the Prediction of Recurring Links
We also analyse the role of weak ties for our prediction scenario. Exemplarily we focus here on the prediction of stronger links with a time threshold of minutes, but the results are very similar for other time thresholds. For the analysis, we compute the AUC value for several network proximity measures, using the face-to-face contact networks, where all links have been removed that fall below a given time threshold . In Figure 10, this threshold is defined by the -axis. We observe that the removal of weak links increases the prediction accuracy of most network proximity measures. Especially on the LWA 2010 and LWA 2012 datasets the AUC value for the unweighted rooted PageRank increases for more than AUC, when we remove all links weaker than 200 seconds. Considering this threshold, we can also observe an increase of AUC for all weighted and unweighted neighbourhood-based network proximity measures.


For the weighted rooted PageRank predictor, we observe the interesting trend that the removal of weak ties seems to have less influence concerning the prediction accuracy. This stability can be explained by the fact that the weighted rooted PageRank also uses the information of the first day’s tie strength. Except for the LWA 2010 dataset, this result is also true for the weighted Katz predictor.
6 Conclusions
In this paper, we considered the predictability of human face-to-face contacts and presented an analysis of influence factors for link prediction in such human contact networks. Specifically, we considered the standard problem of predicting new links, and extended it to the analysis of recurring links. We compared the performance of path-based and neighbourhood-based network proximity measures for predicting new and recurring links. Considering recurring links we also studied the current tie strength as predictor. We observed that stronger links are better predictable for the new and recurring link prediction problem. Especially the weighted variants of the path-based network proximity measures perform much better in the prediction of recurring links than neighbourhood-based network proximity measures. The results also show, that the current tie strength performs better than the path-based measures on two of the three datasets. This is surprising, because path-based measures combine information from the current tie strength and the nodes’ neighbourhood. Furthermore, we studied the predictability of recurring links, when weak links are removed from the network. We observed that removing links with weight (contact length) smaller than 200 seconds increases the AUC-values for most network proximity measures. Furthermore, we considered (and adapted) different network proximity measures for the prediction, and took descriptive properties of human participants into account. These insights are a first step onto predictability applications for human contact networks, e. g., for improving recommender systems.
For future work, we aim to leverage these analysis results in order to embed the indicators, patterns, and influence factors into more advanced prediction models in the context of human contact networks. Furthermore, we plan to extend the analysis towards more dynamic approaches including movement and location-based events for improving the prediction further.
Acknowledgements
This work has been supported by the VENUS research cluster at the interdisciplinary Research Center for Information System Design (ITeG) at Kassel University. We utilized active RFID technology which was developed within the SocioPatterns project, whose generous support we kindly acknowledge. Our particular thanks go the SocioPatterns team, especially to Ciro Cattuto, who enabled access to the Sociopatterns technology, and who supported us with valuable information concerning the setup of the RFID technology.
References
- [1] L. A. Adamic and E. Adar. Friends and Neighbors on the Web. Social Networks, 25(3):211–230, 2003.
- [2] H. Alani, M. Szomszor, C. Cattuto, W. V. den Broeck, G. Correndo, and A. Barrat. Live Social Semantics. In International Semantic Web Conference, pages 698–714, 2009.
- [3] M. Atzmueller, M. Becker, M. Kibanov, C. Scholz, S. Doerfel, A. Hotho, B.-E. Macek, F. Mitzlaff, J. Mueller, and G. Stumme. Ubicon and its Applications for Ubiquitous Social Computing. New Review of Hypermedia and Multimedia, 20(1):53–77, 2014.
- [4] M. Atzmueller, D. Benz, S. Doerfel, A. Hotho, R. Jäschke, B. E. Macek, F. Mitzlaff, C. Scholz, and G. Stumme. Enhancing Social Interactions at Conferences. it+ti, 2011.
- [5] M. Atzmueller, S. Doerfel, A. Hotho, F. Mitzlaff, and G. Stumme. Face-to-Face Contacts at a Conference: Dynamics of Communities and Roles. In Modeling and Mining Ubiquitous Social Media, volume 7472 of LNAI. Springer Verlag, Heidelberg, Germany, 2012.
- [6] M. Atzmueller and F. Lemmerich. VIKAMINE - Open-Source Subgroup Discovery, Pattern Mining, and Analytics. In Proc. ECML/PKDD 2012: European Conference on Machine Learning and Principles and Practice of Knowledge Discovery in Databases, Heidelberg, Germany, 2012. Springer Verlag.
- [7] M. Atzmueller, F. Lemmerich, B. Krause, and A. Hotho. Who are the Spammers? Understandable Local Patterns for Concept Description. In Proc. 7th Conference on Computer Methods and Systems, 2009.
- [8] M. Atzmueller and F. Puppe. SD-Map - A Fast Algorithm for Exhaustive Subgroup Discovery. In Proc. 10th European Conf. on Principles and Practice of Knowledge Discovery in Databases (PKDD 2006), pages 6–17, Heidelberg, Germany, 2006. Springer.
- [9] M. Atzmueller, F. Puppe, and H.-P. Buscher. Exploiting Background Knowledge for Knowledge-Intensive Subgroup Discovery. In Proc. 19th Intl. Joint Conference on Artificial Intelligence (IJCAI-05), pages 647–652, Edinburgh, Scotland, 2005.
- [10] L. Backstrom and J. Leskovec. Supervised Random Walks: Predicting and Recommending Links in Social Networks. In WSDM, pages 635–644, 2011.
- [11] A.-L. Barabasi. Linked the New Science of Networks, 2002.
- [12] A. Barrat, C. Cattuto, V. Colizza, L. Isella, C. Rizzo, A. E. Tozzi, and W. V. den Broeck. Wearable Sensor Networks for Measuring Face-to-Face Contact Patterns in Healthcare Settings. In eHealth, pages 192–195, 2010.
- [13] A. Barrat, C. Cattuto, V. Colizza, J.-F. Pinton, W. V. den Broeck, and A. Vespignani. High Resolution Dynamical Mapping of Social Interactions with Active RFID. CoRR, abs/0811.4170, 2008.
- [14] A. Barrat, C. Cattuto, M. Szomszor, W. V. den Broeck, and H. Alani. Social dynamics in conferences: Analyses of data from the live social semantics application. In International Semantic Web Conference (2), pages 17–33, 2010.
- [15] S. Brin and L. Page. The anatomy of a large-scale hypertextual web search engine. Computer Networks, 30(1-7):107–117, 1998.
- [16] N. Eagle, A. Pentland, and D. Lazer. Inferring Friendship Network Structure by using Mobile Phone Data. Proceedings of The National Academy of Sciences, 106:15274–15278, 2009.
- [17] J. A. Hanley and B. J. McNeil. The Meaning and Use of the Area under a Receiver Operating Characteristic (ROC) Curve. Radiology, 143(1):29–36, Apr. 1982.
- [18] P. Hui, A. Chaintreau, J. Scott, R. Gass, J. Crowcroft, and C. Diot. Pocket Switched Networks and Human Mobility in Conference Environments. In Proc. ACM SIGCOMM workshop on Delay-tolerant networking, pages 244–251, New York, NY, USA, 2005. ACM.
- [19] L. Isella, J. Stehlé, A. Barrat, C. Cattuto, J.-F. Pinton, and W. V. den Broeck. What’s in a Crowd? Analysis of Face-to-Face Behavioral Networks. CoRR, 1006.1260, 2010.
- [20] L. Katz. A New Status Index Derived from Sociometric Analysis. Psychometrika, 18(1):39–43, March 1953.
- [21] M. Kibanov, M. Atzmueller, C. Scholz, and G. Stumme. On the Evolution of Contacts and Communities in Networks of Face-to-Face Proximity. In Proceedings of IEEE CPSCom 2013, Beijing, China, August 20-23, 2013. IEEE.
- [22] M. Kibanov, M. Atzmueller, C. Scholz, and G. Stumme. Temporal Evolution of Contacts and Communities in Networks of Face-to-Face Human Interactions. SCIENCE CHINA Information Sciences, 57, 2014.
- [23] J. M. Leimeister. Collective intelligence. Business and Information Systems Engineering, 2(4):245–248, 2010.
- [24] J. Leskovec, K. J. Lang, A. Dasgupta, and M. W. Mahoney. Community Structure in Large Networks: Natural Cluster Sizes and the Absence of Large Well-Defined Clusters, 2008.
- [25] J. Leskovec, K. J. Lang, and M. W. Mahoney. Empirical Comparison of Algorithms for Network Community Detection, 2010.
- [26] D. Liben-Nowell and J. M. Kleinberg. The Link Prediction Problem for Social Networks. In CIKM, pages 556–559, 2003.
- [27] R. Lichtenwalter, J. T. Lussier, and N. V. Chawla. New Perspectives and Methods in Link Prediction. In KDD, pages 243–252, 2010.
- [28] L. Lü and T. Zhou. Link Prediction in Weighted Networks: The Role of Weak Ties. EPL (Europhysics Letters), 89:18001, 2010.
- [29] B.-E. Macek, C. Scholz, M. Atzmueller, and G. Stumme. Anatomy of a Conference. In Proc. 23rd ACM Conference on Hypertext and Social Media, pages 245–254, New York, NY, USA, 2012. ACM Press.
- [30] T. W. Malone, R. Laubacher, and C. Dellarocas. The Collective Intelligence Genome. Sloan Management Review, 51(3):21–31, 2010.
- [31] F. Mitzlaff, M. Atzmueller, D. Benz, A. Hotho, and G. Stumme. Community Assessment using Evidence Networks. In Analysis of Social Media and Ubiquitous Data, volume 6904 of LNAI, 2011.
- [32] F. Mitzlaff, M. Atzmueller, D. Benz, A. Hotho, and G. Stumme. User-Relatedness and Community Structure in Social Interaction Networks. CoRR/abs, 1309.3888, 2013.
- [33] F. Mitzlaff, M. Atzmueller, G. Stumme, and A. Hotho. Semantics of User Interaction in Social Media. In G. Ghoshal, J. Poncela-Casasnovas, and R. Tolksdorf, editors, Complex Networks IV, volume 476 of Studies in Computational Intelligence. Springer Verlag, Heidelberg, Germany, 2013.
- [34] T. Murata and S. Moriyasu. Link Prediction of Social Networks Based on Weighted Proximity Measures. In Web Intelligence, pages 85–88, 2007.
- [35] C. Scholz, M. Atzmueller, A. Barrat, C. Cattuto, and G. Stumme. New Insights and Methods For Predicting Face-To-Face Contacts. In Proc. 7th Intl. Conf. on Weblogs and Social Media, Palo Alto, CA, USA, 2013. AAAI Press.
- [36] C. Scholz, M. Atzmueller, M. Kibanov, and G. Stumme. How Do People Link? Analysis of Contact Structures in Human Face-to-Face Proximity Networks. In Proceedings of the 2013 IEEE/ACM International Conference on Advances in Social Networks Analysis and Mining, ASONAM 2013, pages 356–363, Niagara, Ontario, Canada, August 25-28, 2013. ACM.
- [37] C. Scholz, M. Atzmueller, and G. Stumme. On the Predictability of Human Contacts: Influence Factors and the Strength of Stronger Ties. In Proc. 4th ASE/IEEE International Conference on Social Computing (SocialCom), Boston, MA, USA, 2012. IEEE Computer Society.
- [38] C. Scholz, M. Atzmueller, and G. Stumme. On the Predictability of Recurring Links in Networks of Face-to-Face Proximity. In 5th International Workshop on Modeling Social Media: Mining Big Data in Social Media at the 23rd International World Wide Web Conference, WWW 2014, Seoul, South Korea, April 8, 2014.
- [39] J. Stehlé, N. Voirin, A. Barrat, C. Cattuto, L. Isella, J.-F. Pinton, M. Quaggiotto, W. V. den Broeck, C. Régis, B. Lina, and P. Vanhems. High-Resolution Measurements of Face-to-Face Contact Patterns in a Primary School. CoRR, abs/1109.1015, 2011.
- [40] C. Tantipathananandh and T. Y. Berger-Wolf. Constant-Factor Approximation Algorithms for Identifying Dynamic Communities. In J. F. E. IV, F. Fogelman-Soulié, P. A. Flach, and M. Zaki, editors, KDD, pages 827–836. ACM, 2009.
- [41] S. Tsugawa and H. Ohsaki. Effectiveness of link prediction for face-to-face behavioral networks. PLoS ONE, 8(12):e81727, 12 2013.
- [42] D. Wang, D. Pedreschi, C. Song, F. Giannotti, and A.-L. Barabási. Human Mobility, Social Ties, and Link Prediction. In KDD, pages 1100–1108, 2011.
- [43] D. J. Watts and S. H. Strogatz. Collective Dynamics of /‘small-world/’ Networks. Nature, 393(6684):440–442, june 1998.
- [44] S. Wrobel. An Algorithm for Multi-Relational Discovery of Subgroups. In Proc. 1st European Symposium on Principles of Data Mining and Knowledge Discovery (PKDD-97), pages 78–87, Heidelberg, Germany, 1997. Springer.
- [45] B. Xu, A. Chin, H. Wang, L. Chang, K. Zhang, F. Yin, H. Wang, and L. Zhang. Physical Proximity and Online User Behavior in an Indoor Mobile Social Networking Application. In Proc. 4th IEEE Intl. Conf. on Cyber, Physical and Social Computing (CPSCom 2011), 2011.
- [46] T. Zhou, L. Lu, and Y.-C. Zhang. Predicting Missing Links via Local Information. The European Physical Journal B - Condensed Matter and Complex Systems, 71:623–630, 2009.