The Gentle growth of galaxies at high redshifts in overdense environments
Abstract
We have explored prevailing modes of galaxy growth for redshifts , comparing substantially overdense and normal regions of the universe, using high-resolution zoom-in cosmological simulations. Such rare overdense regions have been projected to host high- quasars. We demonstrate that galaxies in such environments grow predominantly by a smooth accretion from cosmological filaments which dominates the mass input from major, intermediate and minor mergers. We find that by , the accumulated galaxy mass fraction from mergers falls short by a factor of 10 of the cumulative accretion mass for galaxies in the overdense regions, and by a factor of 5 in the normal environments. Moreover, the rate of the stellar mass input from mergers also lies below that of an in-situ star formation (SF) rate. The fraction of stellar masses in galaxies contributed by mergers in overdense regions is , and in the normal regions, at these redshifts. Our median SF rates for galaxies agrees well with the recently estimated rates for galaxies from Spitzer’s SURF-UP survey. Finally, we find that the main difference between the normal and overdense regions lies in the amplified growth of massive galaxies in massive dark matter halos. This leads to the formation of galaxies due to the -fold increase in mass during the above time period. Such galaxies are basically absent in the normal regions at these redshifts.
Subject headings:
galaxies: evolution — galaxies: formation — galaxies: halos — galaxies: high-redshift — galaxies: interactions — galaxies: star formation1. Introduction
Detection of luminous quasars with supermassive black holes of at (e.g., Fan et al., 2003; Willott et al., 2010; Mortlock et al., 2011) have raised a long list of issues, including properties of parent galaxies, their host dark matter (DM) halos, and the environment. Contradictory claims have been made on whether quasars reside in overdense and rare regions of the universe (e.g., Stiavelli et al., 2005; Willott et al., 2005; Zheng et al., 2006; Kim et al., 2009; Overzier et al., 2009; Romano-Díaz et al., 2011a). The properties of high- quasar-host galaxies are virtually unknown. In this Letter we compare galaxy evolution at high redshifts in such highly overdense regions with those in ‘normal’ regions, using high-resolution numerical simulations. Specifically, we ask what is the main growth mode(s) of galaxies in these environments, and quantify the rates of (1) smooth accretion from cosmological filaments, and of (2) galaxy mergers.
With the advent of sensitive near-infrared imaging on the HST and JWST, and the new generation of ground-based telescopes, more than 100 galaxies have been detected at (e.g., Finkelstein et al., 2010; McLure et al., 2011; Bouwens et al., 2011; Lorenzoni et al., 2011; McCracken et al., 2012; Trenti et al., 2012; Matthee et al., 2014; Ryan et al., 2014), and their star formation (SF) rates and mass and luminosity functions analyzed (e.g., Stiavelli et al., 2004; Yan & Windhorst, 2004; Finlator et al., 2011; Romano-Díaz et al., 2009, 2011b; Jaacks et al., 2012; Yajima et al., 2012, 2014; Dayal et al., 2013). The overdensities of Lyman Break galaxies (LBGs) — probably the most massive galaxies at these epochs (e.g., Baugh et al., 1998; Nagamine et al., 2004), have been revealed on scales of a few Mpc around high- quasars, using Suprime-Cam of Subaru telescope (e.g., Utsumi et al., 2010).
The new paradigm of galaxy growth by accretion from cosmological filaments has succesfully challenged the merger-dominated scenario (e.g., Kereš et al., 2005, 2009; Dekel & Birnboim, 2006; Dekel, et al., 2009; Finlator et al., 2011; Shlosman, 2013, for review). Numerical simulations indicate that major mergers are not the main mode of growth, nor are they responsible for the intense SF (e.g., Dayal et al., 2013), although the numerical resolution is still low. Moreover, simulations hint at a bimodal behavior with a cold gas accretion dominating in low-mass galaxies and the hot gas in the higher-mass ones (e.g., Kereš et al., 2009) — in tandem with the observed trend in SDSS galaxies (e.g., Kauffmann et al., 2004).
Motivated by these issues, we study the main modes of galaxy growth, in gas and stellar components, at , to facilitate further comparison with observations. Using the Constrained Realizations method (section 2) to sample rare overdense regions without the loss of generality at a very high resolution, we aim at quantifying mass accretion rates from cosmological filaments and from galaxy mergers, as a function of the environment.
2. Numerics and Initial Conditions
We use the modified tree-particle-mesh Smoothed Particle Hydrodynamics (SPH) code GADGET-3 (Springel, 2005), in its conservative entropy formulation (Springel & Hernquist, 2002). Our implementation includes radiative cooling by H, He and metals (Choi & Nagamine, 2009), SF, stellar feedback, a phenomenological model for galactic winds, and sub-resolution model for multiphase interstellar medium (ISM; Springel & Hernquist, 2003), where starforming SPH particles contain cold and hot phases. The SF prescription is based on the ”Pressure model” which reduces the high- SF rate (Choi & Nagamine, 2010) relative to previous implementations. SF can only take place with gas density above the threshold .
We have used the Constrained Realizations [CR] of Romano-Díaz et al. (2011b) to obtain initial conditions [ICs], as well as their unconstrained counterpart [UCR] for comparison. The CRs have been implemented following the algorithm of Hoffman & Ribak (1991) (see also Romano-Díaz et al., 2007) and are similar to those in Romano-Díaz et al. (2011b). The constraints were imposed onto a grid of 1,024 cells per dimension in a cubic box of , to prescribe the formation and collapse of a massive halo of by , according to the top-hat model. is the Hubble constant in units of . We assumed CDM-WMAP5 cosmological parameters (Dunkley et al., 2009), . The power spectrum is normalized by the linear rms amplitude of mass fluctuations in spheres, . For the UCR simulation, we have used a factor of two smaller resolution ().
The simulations have been followed from to with a time sampling of Myr between output-times. We have applied the zoom-in technique with three levels of refinement to increase the mass resolution, with baryons only at the highest refinement level. For the CR simulation the inner region has a radius of , with an effective resolution of in both DM and SPH particles, and a gravitational softening of pc (comoving). The corresponding particles masses are: (DM), and (gas). Gas particles experience up to two episodes of SF, resulting in stellar masses of . For the UCR, the inner region has a radius of , and mass resolutions of (DM), (gas), and (stars).
Galaxies are identified by means of the HOP group finder algorithm (Eisenstein & Hut, 1998), for densities exceeding . We consider only objects with the minimal stellar mass above (in agreement with recent observations, Ryan et al., 2014), independently of their gas content, i.e., stellar particles for the CR and 65 for UCR models. This ensures that the corresponding DM-parent halos are , and therefore, are almost unaffected by reionization (e.g., Barkana & Loeb, 1999).
We analyze spherical volumes of radii and at , free of contamination from massive DM particles. The UCR volume has been matched to contain the same amount of matter as in the CR. For each galaxy, we construct its baryonic mass accretion history (MAH), until its progenitor (parent galaxy) cannot be further identified. A progenitor is defined as an object that provides at least 51% of the mass with respect to the child galaxy.
From this sample, we choose galaxies whose MAHs could be followed beyond , giving us enough span-time to analyze their growth. The final sample is composed of and objects. The galaxy masses range . The halos can in principle host more than one galaxy. We do not distinguish between main and satellite galaxies, giving them equal treatment.
The galaxy growth is split into smooth accretion and mergers. For each output time we identify all progenitors that will merge within with the main branch of the chosen galaxy and divide those merger events into: (1) Major merger: with a mass ratio of 1-to-3, (2) Intermediate: with a mass ratio of 4-to-10, (3) Minor: with a mass ratio of 11 and above. For stellar accretion, we also identify in-situ SF, as those stars that are born within .
Statistical analysis of galaxy properties is carried out by binning galaxies in two different ways: (1) according to their stellar masses (), and (2) according to their relative smoothed density contrast, ), with respect to the mean baryon density (when convolved with a top-hat filter of ) within the simulated baryonic volume. Therefore, galaxies are divided into (1) Underdense regions: , (2) Average-density regions: , and (3) Overdense regions: . The CR simulation describes the highly overdense region, with respect to the average density of the universe, while the UCR simulation has the average density. Our results are not sensitive to the size of the kernel as long as it is larger than the average galaxy inter-separation within the volume.
3. Results
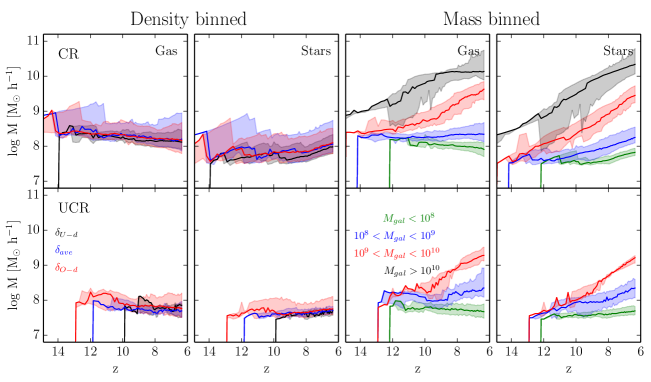
Our goal is to compare the galaxy growth in various environments and estimate contributions from mergers and smooth accretion. Figure 1 shows the median of the MAH distributions for the CR and UC simulations, averaged over periods of 50 Myr. We choose the median over the mean because the distributions are not Gaussian but substantially skewed, and the mean is particularly sensitive to the influence of outliers. The first and second columns show the distributions for the underdense, average and overdense regions (density-binned case). The third and last columns represent the mass-binned distributions.
The CR and UCR distributions differ substantially. The density-binned distributions show a rather flat behavior due to the mixing of various masses within a given region, with a slightly decreasing trend for the gaseous component and increasing one for the stars in CR. The UCR is even flatter and has a lower median mass by a factor of . As dicussed below, the most massive galaxies are virtually absent from the low density regions.
On the other hand, the mass-binned case shows a clear growth trend among the various mass bins, especially for higher masses. Two are the main differences that strive between the CR and UCR simulations due to the effect of the imposed constraint (section 2). First, the CR galaxies with form earlier than in the UCR case, which can also be seen for the density-binned curves. Although different resolutions could play a role, mostly in triggering the onset of SF, this does not affect the general results — the least massive objects, those with , exhibit the same distribution and the time appearance in CR and UCR runs.
Secondly and most importantly, massive galaxies with in the UCR simulation are completely absent, since no halos with masses above form before . At large, the growth trends for both gas and stars are similar in both simulations (once the SF takes place in the UCR simulation), with one important difference — the mass accumulation in galaxies in the overdense regions proceeds at an accelerated rate. Galaxies with show that the median mass increases as log , i.e., increases exponentially (with the exception of gas mass which saturates at in , due to the SF).
The stellar and gaseous components in galaxies with grow faster than in less massive galaxies. These massive objects are mostly found in the over- and average-density regions, favorable to the mass accumulation by smooth accretion and mergers.
3.1. Gas Accretion
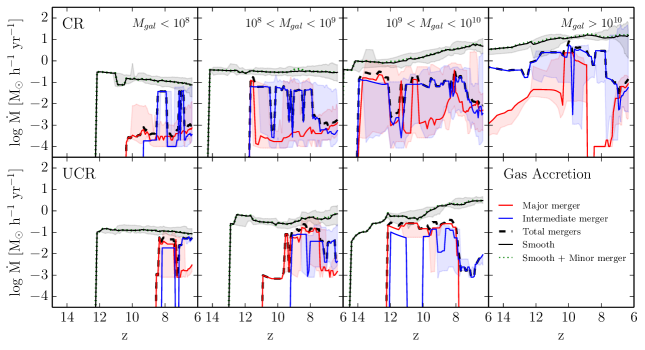
Figure 2 shows the mass-binned gas accretion rates for the CR and UCR simulations. Because the lower mass cutoff in minor mergers depends on the numerical resolution limit, and because their overall contribution is small, we have added them to the smooth accretion. As before, the trends provide the median of the distributions.
The mass-binned distributions clearly show that the smooth accretion rate dominates over the total merger contribution at all , in all mass bins and for both simulations. Furthermore, minor merger mass input rate appears to be insignificant when compared to the smooth accretion rate, as shown by the green-dotted lines which are almost identical to the the black lines representing smooth accretion. For the CR run, intermediate merger rate is more than an order of magnitude below the smooth accretion, and even its peaks reach only .
The major merger input rate is naturally more spiky, but generally falls well below that of the intermediate ones. For CR galaxies, mergers play some role only for (and only for bin), and an intermittent role at lower . However, their spiky median distributions and shadowed regions, which could overlap with the smooth accretion trends, indicate that sometimes their contribution can be substantial. Similarly for the UCR simulation — major mergers dominate among mergers at high- (although lower than CR due to the delayed evolution of the normal regions with respect to the overdense ones), and intermediate mergers contribute more at . Galaxies with exhibit a slow constant growthrate, while more massive objects show an accelerated exponential growth as discussed above. As these massive galaxies prefer an overdense environment, where the number density of potential mergers as well as of the background IGM is highly elevated, we observe this growthrate bifurcation. There is an overall decline of merger gas input rate after for massive galaxies because their gas fraction decreases with time.
Overall, Figure 2 shows that the gas supply rate to galaxies is dominated by the smooth accretion over the mergers. Among mergers, the intermediate ones dominate the major mergers, as seen from the thick dashed lane which nearly always coincides with the solid blue lane.
3.2. Stellar Accretion and Star Formation
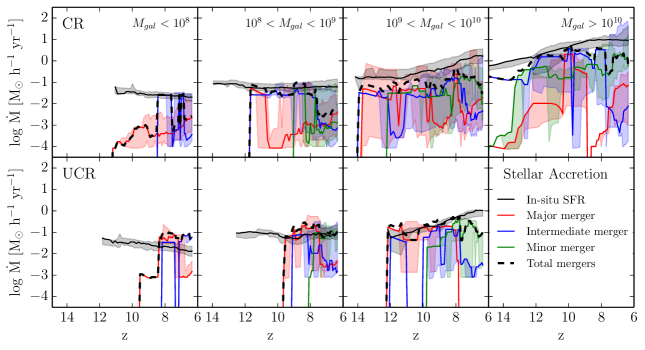
The behavior of stellar accretion mirrors that of the gas in many aspects but differs because of the in-situ SF. The SF rate dominates the stellar mass growth in galaxies for all mass-bins, independently of environment (Fig. 3). Here we show explicitly the minor merger contributions since there is no stellar counterpart of the smooth gas accretion. The SF rate successfully competes with the contributions from mergers in the CR and UCR simulations. For limited time periods of merger activity in the UCR simulation, the mergers can dominate.
The SF rate exhibits similar exponential growthrate with for , and is flat for the lower masses, where major merger activity dominates. The similarity in the SF rate to that of the smooth gas accretion serves an indication that most of the accreted gas is cold and metal-rich, thus able to facilitate the SF, as elaborated elsewhere.
We also note that for the CR galaxies located in overdense environment, , the overall merger mass input represents more than , mostly comprised of intermediate and minor mergers, although major mergers do contribute more to the growth of the stellar content than in the case of the gas.
The fraction of the total mass accumulated by the mergers is (CR) and (UCR) for . The fraction of stars in galaxies contributed by mergers is (CR) and (UCR).
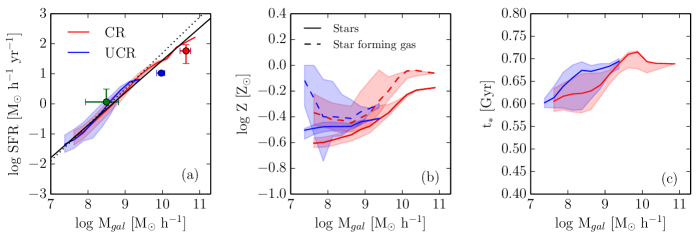
By analyzing the physical properties of galaxies in our simulations, we have determined that the tight correlations SFR and and metallicity of GOODS LBGs (Finlator et al., 2006, 2011) for the UCR can be extended to and to large overdensities (CR) (Figs. 4a-b), and show excellent agreement with few known observing points (Fig. 4a). We also observe that more massive galaxies have older median stellar populations (Fig. 4c) — the anticipated behavior at high when the SF rate is still rising.
The UCR simulations can be directly compared to Dayal et al. (2013), which are of lower resolution in mass and spatially. We find that indeed the merger mass input rate drops towards , but only for the gas. The stellar contribution from the mergers continues to compete with the in-situ SF. For the CR run, the relative contribution of mergers to the gas and stars is lower than in the UCR. Partly, this difference with Dayal et al. (2013) can be explained by their definition of a galaxy which is based on the minimum of 10 stellar particles, compared to our 500.
4. Discussion
We have used high-resolution zoom-in cosmological simulations to study the growth of galaxies in highly overdense and normal environments at . The initial conditions for the overdense field have been obtained by means of the Constrained Realizations (CR) method which allows to sample rare regions without the loss of generality, while no constraints have been applied in the normal (UCR) region. Using the same Gaussian random realization as the UCR run, the CR simulation box contains the seed of a massive DM halo of expected to collapse by . We have compared the galaxy MAHs for the CR and UCR simulations and have analyzed the contributions from the smooth accretion, minor, intermediate and major mergers to the growth of the gaseous and stellar components in galaxies.
Galaxies have been defined in terms of their stellar mass. The minimal resolved mass is (e.g., Ryan et al., 2014). For comparison, the most massive galaxy is situated in the halo at . Galaxies with can represent high- LBGs detected at (e.g., Utsumi et al., 2010). Note that the halo occupation number is larger than unity.
Our main result concerns the prevailing mode of galaxy growth. The overdense environment considered here is a typical one to obtain collapse of DM halo by in the top-hat model. The underlying DM structure of the region is responsible for the accelerated galaxy evolution observed in the CR. We find that the smooth accretion rate from cosmological filaments substantially dominates over that from mergers. Consequently, by , the assembled median galaxy mass which has been contributed by mergers (gasstars) falls by more than an order of magnitude below the accretion input for CR and by a factor of 5 for the UCR galaxies.
Second, we find that the growthrate of the stellar mass in mergers in overdense regions lies also below the in-situ SF rate. The accumulated stellar mass due to the merger contribution falls short of the locally-produced stars, only of the total stellar mass for the CR and for the UCR objects. Our median SF rates for galaxies with agrees nicely with the current measure of galaxies using Spitzer’s SURFS-UP survey (Ryan et al., 2014).
Finally, we find that the main difference between the normal and overdense regions lies in that galaxy evolution rate in the latter ones has been amplified and leads to the formation of more massive galaxies, which are absent in the normal regions. Fig. 1 underlines this trend: in both CR and UCR runs, only galaxies amplify their growth rate. This leads to the median stellar mass of the CR galaxies in the highest bin to ‘fatten’ by a factor of during .
Merger activity becomes relevant at , especially in the overdense regions and for the most massive galaxies. The decrease in the major merger activity in bringing in the gas indicates that the relative fraction of the gas in galaxies becomes lower with , which is confirmed directly.
The gas accretion does depend on the type of feedback mechanisms imposed in the numerical modeling. While in principle the AGN feedback (neglected here) could halt the smooth accretion which proceeds mainly along the filaments, this is rather inconclusive, as this feedback is known to be anisotropic.
Acknowledgments
We thank Volker Springel for providing us with the original version of GADGET-3 and Yehuda Hoffman for preparing the initial conditions using the Constrained Realizations. E.R.D. acknowledges support from the SFB 956 by the DFG. I.S. acknowledges partial support by the NSF, NASA and STScI. Simulations have been performed on the UK DLX Cluster.
References
- Barkana & Loeb (1999) Barkana, R. & Loeb, A. 1999, ApJ, 523, 54
- Baugh et al. (1998) Baugh, C.M., Cole, S., Frenk, C.S., & Lacey, C.G. 1998, ApJ, 498, 504
- Becker et al. (2007) Becker, G. D., Rauch, M., & Sargent, W. L. W. 2007, ApJ, 662, 72
- Bouwens et al. (2011) Bouwens, R. J., et al. 2011, ApJ, 737, 90
- Choi & Nagamine (2010) Choi, J. & Nagamine, K. 2010, MNRAS, 407, 1464
- Choi & Nagamine (2009) Choi, J.-H. & Nagamine, K. 2009, MNRAS, 393, 1595
- Dayal et al. (2013) Dayal, P., Dunlop, J. S., Maio, U., & Ciardi, B. 2013, MNRAS, 434, 1486
- Dekel & Birnboim (2006) Dekel, A. & Birnboim, Y. 2006, MNRAS, 368, 2
- Dekel, et al. (2009) Dekel, A., Birnboim, Y., Engel, G., et al. 2009, Nature, 457, 451
- Dow-Hygelund, et al (2005) Dow-Hygelund, C.C., et al. 2005, ApJ, 630, L137
- Dunkley et al. (2009) Dunkley, J., et al. 2009, ApJS, 180, 306
- Eisenstein & Hut (1998) Eisenstein, D. J. & Hut, P. 1998, ApJ, 498, 137
- Fan et al. (2003) Fan, X., et al. 2003, AJ, 125, 1649
- Finkelstein et al. (2010) Finkelstein, S. L., et al. 2010, ApJ, 719, 1250
- Finlator et al. (2006) Finlator, K., et al. 2006, ApJ, 639, 672
- Finlator et al. (2011) Finlator, K., Oppenheimer, B. D., & Davé, R. 2011, MNRAS, 410, 1703
- Hoffman & Ribak (1991) Hoffman, Y. & Ribak, E. 1991, ApJ, 380, L5
- Jaacks et al. (2012) Jaacks, J., Choi, J.-H., Nagamine, K., Thompson, R., & Varghese, S. 2012, MNRAS, 420, 1606
- Kauffmann et al. (2004) Kauffmann, G., et al. 2004, MNRAS, 353, 713
- Kereš et al. (2005) Kereš, D., Katz, N., Weinberg, D. H., & Davé, R. 2005, MNRAS, 363, 2
- Kereš et al. (2009) Kereš, D., Katz, N., Fardal, M., Davé, R., & Weinberg, D. H. 2009, MNRAS, 395, 160
- Kim et al. (2009) Kim, S., et al. 2009, ApJ, 695, 809
- Lai et al. (2007) Lai, K., et al. 2007, ApJ, 655, 704
- Lorenzoni et al. (2011) Lorenzoni, S., et al. 2011, MNRAS, 414, 1455
- Matthee et al. (2014) Matthee, J. J. A., et al. 2014, MNRAS, 440, 2375
- McCracken et al. (2012) McCracken, H. J., et al. 2012, A&A, 544, A156
- McLure et al. (2011) McLure, R. J., et al. 2011, MNRAS, 418, 2074
- Mortlock et al. (2011) Mortlock, D. J., et al. 2011, Nature, 474, 616
- Nagamine et al. (2004) Nagamine, K., Springel, V., Hernquist, L., & Machacek, M. 2004, MNRAS, 350, 385
- Ono etal. (2010) Ono, Y., et al. 2010, ApJ, 724, 1524
- Overzier et al. (2009) Overzier, R. A., et al. 2009, MNRAS, 394, 577
- Romano-Díaz et al. (2007) Romano-Díaz, E., et al. 2007, ApJ, 657, 56
- Romano-Díaz et al. (2009) Romano-Díaz, E., Shlosman, I., Heller, C., & Hoffman, Y. 2009, ApJ, 702, 1250
- Romano-Díaz et al. (2011a) Romano-Diaz, E., Shlosman, I., Trenti, M., & Hoffman, Y. 2011a, ApJ, 736, 66
- Romano-Díaz et al. (2011b) Romano-Díaz, E., Choi, J.-H., Shlosman, I., & Trenti, M. 2011b, ApJ, 738, L19
- Ryan et al. (2014) Ryan, Jr., R. E., et al. 2014, ArXiv e-prints
- Shlosman (2013) Shlosman, I. 2013, Secular Evolution of Galaxies, ed. J. Falcón-Barroso & J. H. Knapen, Cambride Univ. Press, 555
- Springel (2005) Springel, V. 2005, MNRAS, 364, 1105
- Springel & Hernquist (2002) Springel, V. & Hernquist, L. 2002, MNRAS, 333, 649
- Springel & Hernquist (2003) —. 2003, MNRAS, 339, 289
- Stiavelli et al. (2004) Stiavelli, M., Fall, S. M., & Panagia, N. 2004, ApJ, 610, L1
- Stiavelli et al. (2005) Stiavelli, M., et al. 2005, ApJ, 622, L1
- Trenti et al. (2012) Trenti, M., et al. 2012, ApJ, 746, 55
- Utsumi et al. (2010) Utsumi, Y., et al. 2010, ApJ, 721, 1680
- Willott et al. (2005) Willott, C. J., et al.2005, in Growing Black Holes: Accretion in a Cosmological Context, ed. A. Merloni, S. Nayakshin, & R. A. Sunyaev, Berlin:Springer, 102
- Willott et al. (2010) Willott, C. J., et al. 2010, AJ, 139, 906
- Yajima et al. (2012) Yajima, H., Li, Y., Zhu, Q., & Abel, T. 2012, MNRAS, 424, 884
- Yajima et al. (2014) Yajima, H., Nagamine, K., Thompson, R., & Choi, J.-H 2014, MNRAS, 439, 3073
- Yan & Windhorst (2004) Yan, H. & Windhorst, R. A. 2004, ApJ, 600, L1
- Zheng et al. (2006) Zheng, W., et al. 2006, ApJ, 640, 574