Molecular Gas in the X-ray Bright Group NGC 5044 as Revealed by ALMA
Abstract
An ALMA observation of the early-type galaxy NGC 5044, which resides at the center of an X-ray bright group with a moderate cooling flow, detected 24 molecular structures within the central 2.5 kpc. The masses of the molecular structures vary from M⊙ to M⊙ and the CO(2-1) linewidths vary from 15 to 65 km s-1. Given the large CO(2-1) linewidths, the observed structures are likely giant molecular associations (GMAs) and not individual molecular clouds (GMCs). Only a few of the GMAs are spatially resolved and the average density of these GMAs yields a GMC volume filling factor of about 15%. The masses of the resolved GMAs are insufficient for them to be gravitationally bound, however, the most massive GMA does contain a less massive component with a linewidth of 5.5 km s-1 (typical of an individual virialized GMC). We also show that the GMAs cannot be pressure confined by the hot gas. Given the CO(2-1) linewidths of the GMAs (i.e., the velocity dispersion of the embedded GMCs) they should disperse on a timescale of about 12 Myr. No disk-like molecular structures are detected and all indications suggest that the molecular gas follows ballistic trajectories after condensing out of the thermally unstable hot gas. The 230 GHz luminosity of the central continuum source is 500 times greater than its low frequency radio luminosity and probably reflects a recent accretion event. The spectrum of the central continuum source also exhibits an absorption feature with a linewidth typical of an individual GMC and an infalling velocity of 250 km s-1.
1 Introduction
Cooling flow groups and clusters contain large amounts of hot X-ray emitting gas that should be radiatively cooling on time scales less than a Hubble time (see Fabian, Nulsen & Canizares 1984 for an early review of cooling flows). The primary uncertainty in the original cooling flow scenario was the ultimate fate of the cooling gas. While diffuse H emission was commonly found within the central dominant galaxy (CDG) in cooling flows (Heckman 1981; Hu et al. 1985) and star formation was observed in cluster cooling flows as early as McNamara & O’Connell (1989), the observed star formation rates were orders of magnitudes less than the inferred mass deposition rates of the hot gas. The cooling flow scenario underwent a major modification after the launch of the Chandra and XMM-Newton X-ray telescopes. Chandra, with its high spatial resolution, discovered AGN-induced cavities and shocks within cooling flows (e.g., McNamara et al. 2000; Blanton et al. 2003; Fabian et al. 2003; Forman et al. 2007; Randall et al. 2011), while both XMM-Newton and Chandra found little spectroscopic evidence for large amounts of cooling gas (David et al. 2001; Peterson et al. 2003). By compiling observations of cooling flow clusters, several groups (Birzan et al. 2004; Dunn & Fabian 2006, O’Sullivan et al. 2011) have shown that the mechanical power of the AGN in the CDG is sufficient to prevent the bulk of the hot gas from cooling. While AGN feedback probably prevents most of the hot gas from cooling, star formation has now been detected in many CDGs residing at the centers of cooling flows (e.g., Allen et al. 1995; Rafferty et al. 2006; Donahue et al. 2007; Quillen et al. 2008) and there are many indications that the star formation is a product of the cooling flow, including: 1) a correlation between the star formation rate in CDGs and the spectroscopic mass deposition rate (O’Dea et al. 2008), 2) the existence of a sharp threshold for star formation that occurs when the cooling time of the hot gas is less than about 1 Gyr (Rafferty et al. 2008) or the entropy is less than 30 keV cm2 (Voit et al. 2008) and 3) a correlation between the star formation rate derived from Spitzer and Herschel data and the radiative cooling time of the hot gas (Egami et al. 2006a; Rawle et al. 2012).
Single dish CO surveys over the past decade have shown that a substantial fraction of CDGs in cluster cooling flows harbor molecular gas (Edge 2001; Salome et al. 2003). Warm molecular gas has also been detected in CDGs by emission from vibrationally excited molecular hydrogen (e.g., Jaffe & Bremer 1997; Donahue et al. 2000; Egami et al. 2006b). Recent Atacama Large (sub)Millimeter Array (ALMA) observations of A1664 (Russell et al. 2014) and A1835 (McNamara et al. 2014) show that both of these systems contain more than of molecular gas. There is also evidence that A1835 may have a high velocity molecular outflow driven by the radio jets or buoyant X-ray cavities.
In this paper we present the results of a cycle 0 ALMA observation of NGC 5044 in the CO(2-1) emission line. The NGC 5044 group of galaxies is the X-ray brightest group in the sky and has a very smooth and nearly spherically symmetric large scale X-ray morphology. However, the central region of NGC 5044 is highly perturbed with many AGN-inflated cavities, cool X-ray filaments, cold fronts and multiphase gas (Buote et al. 2003; Gastaldello et al. 2009; David et al. 2009; 2011). NGC 5044 also hosts a system of very bright H filaments (Caon et al. 2000; Sun et al. 2014). The presence of three cold fronts in the Chandra and XMM-Newton data (Gastaldello et al. 2013; O’Sullivan et al. 2014) and a peculiar velocity of 140 km s-1 relative to the group mean (Cellone & Buzzoni 2005) suggest that NGC 5044 is likely undergoing a sloshing motion within the group center. Large scale asymmetries in the X-ray morphology (Gastaldello et al. 2013) and regions of enhanced elemental abundances (O’Sullivan et al. 2014) suggest that the sloshing orbital plane of NGC 5044 is perpendicular to the plane of the sky based on the simulations in Roediger et al. (2011).
This paper is organized as follows. Section 2 contains a description of the ALMA data reduction. Our results concerning the mass and kinematics of the observed molecular structures and correlations between the molecular gas, dust, H filaments and hot gas are presented in . Implications concerning the origin, dynamics and confinement of the molecular gas are discussed in and our main results are summarized in .
2 Data Reduction
We observed NGC 5044 with ALMA during Cycle 0 of the scientific observations. A single pointing was made towards the center of NGC 5044 (RA=13:15:23.97, Dec-16.23.07.5) on 2012 January 13. The primary beam of ALMA at 1.3 mm is 27′′ arcsec at full-width half maximum and provides a field of view of 4.0 kpc at the distance of NGC 5044. The observation spanned 1.0 hr, for a total on-source integration time of 29 min. The quasar J1337-129, located from NGC 5044, served as the complex gain (secondary) calibrator. Scans of J1337-129 were made every 12 min bracketing scans of NGC 5044. The quasar 3C 279 served as the bandpass calibrator and Titan as the absolute flux (primary) calibrator. The amount of precipitable water vapor during our observation was 1.4 mm
The correlator was configured to provide four spectral windows in two linear polarizations (no measurements of the cross products were made in ALMA cycle 0). Each spectral window spanned a total bandwidth of 1875 MHz and was split into 3840 channels so that each channel had a width of 488.28125 kHz. One of the spectral windows was centered on the CO(2-1) line (1.3-mm band) at the systemic velocity of NGC 5044, providing a velocity resolution of 0.64 km s-1 in CO(2-1). The other three spectral windows (229.336-231.211 GHz, 241.270-243.145 GHz and 242.853-244.728 GHz) covered line-free regions to measure the continuum emission of NGC 5044, necessary for subtracting any continuum emission at the frequency of the CO(2-1) line. As explained below, we detected relatively strong continuum emission from the central AGN of NGC 5044.
The data were calibrated using the software package CASA by the ALMA observatory. The calibrated data, along with a set of continuum-subtracted channel maps in CO(2-1), were delivered to us on 2013 March 4. To make channel maps suitable to our own needs, we performed our own continuum subtraction in the CO(2-1) line and made channel maps at our own desired velocity resolutions and weightings of the visibility data. The synthesized beam attained in our cycle 0 ALMA observation was 1.4′′ by 2.2′′ FWHM (210 by 330 pc). We adopt a systemic velocity of 2758 km s-1 for NGC 5044 and a luminosity distance of 31.2 Mpc (Tonry et al. 2001), which gives a physical scale in the rest frame of NGC 5044 of pc.
3 Results
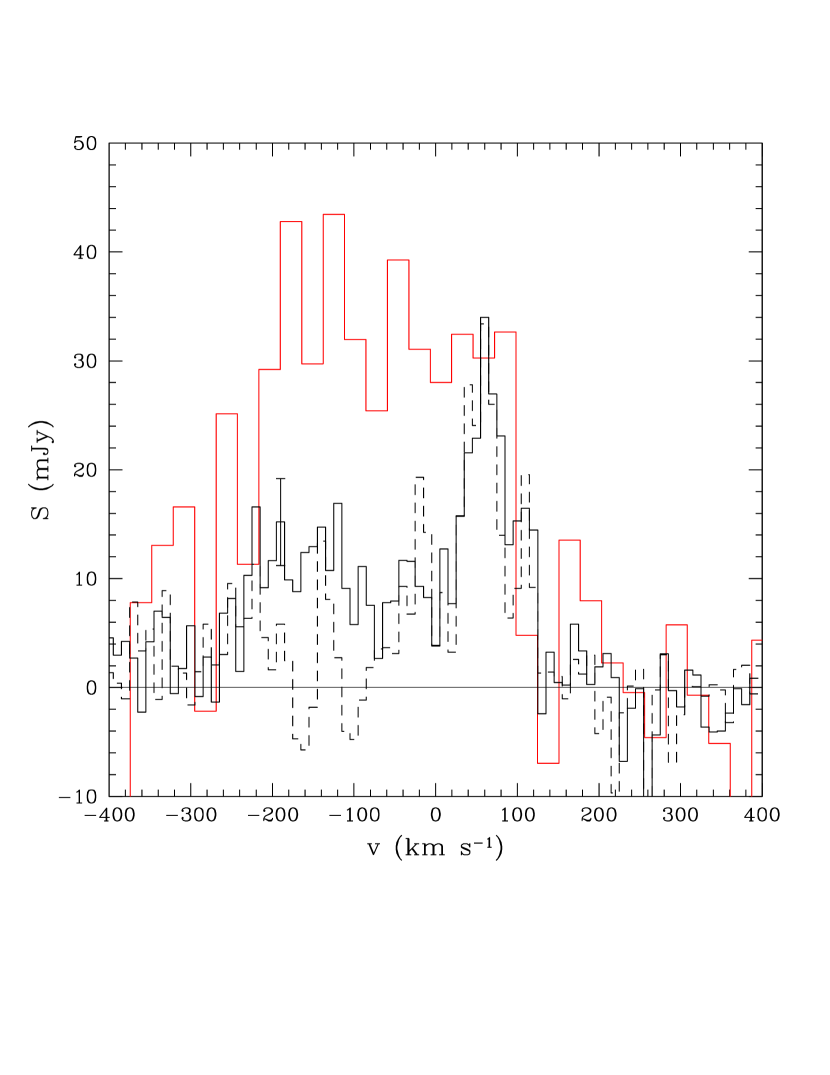
The most significant CO(2-1) feature in the ALMA Cycle 0 spectrum within the central 1 kpc diameter region is the redshifted emission between 0 and 120 km s-1 with a sharp peak at 60 km s-1 (see Fig. 1). The blueshifted emission within this region is broader and less peaked, with emission spanning a velocity range from -300 to 0 km s-1. For comparison, we also show in Fig.1 the IRAM 30m CO(2-1) spectrum and the ALMA CO(2-1) spectrum extracted from within a 11′′ diameter region (i.e., the full-width half maximum of the IRAM 30m primary beam). While the redshifted portions of the IRAM 30m and ALMA spectra are in reasonably good agreement, the integrated flux density in the blueshifted portion of the ALMA spectrum is only 20% of that in the IRAM 30m data. Similar results were found by Russell et al. (2014) for Abell 1664 and McNamara et al. (2014) for Abell 1835 when comparing IRAM 30m and ALMA data and is presumably due to the presence of diffuse CO(2-1) emission in these systems that is resolved out in the ALMA data.
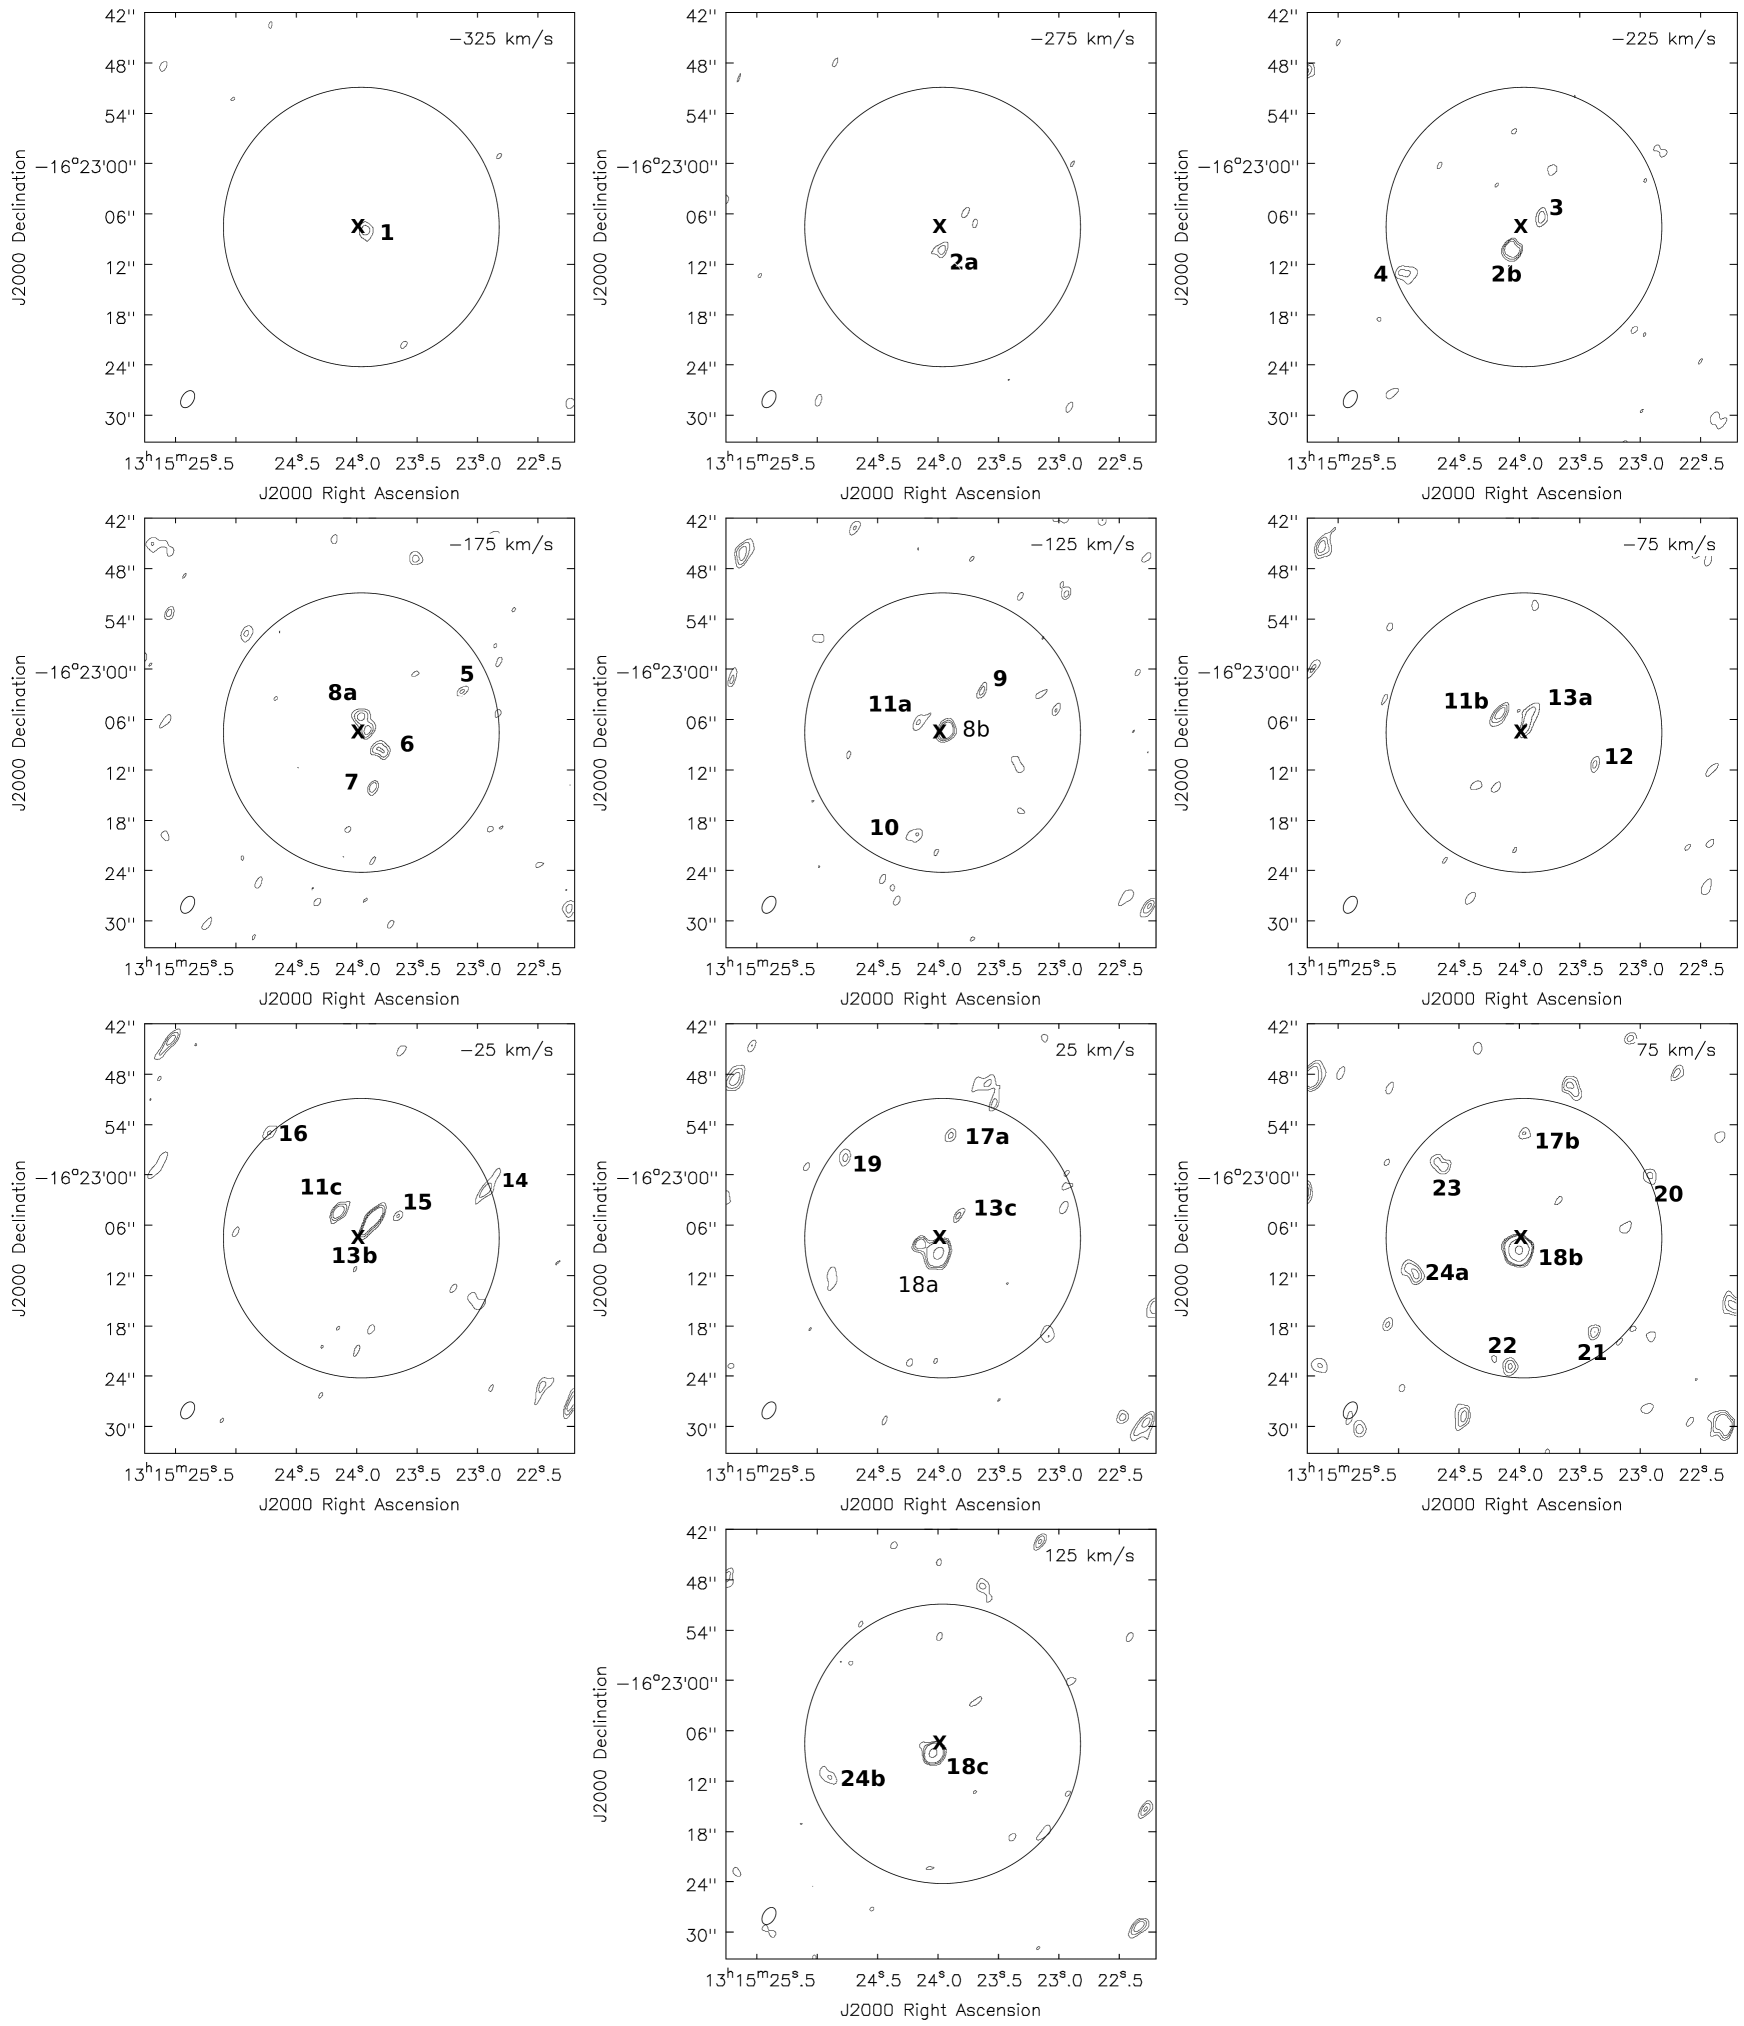
To search for discrete molecular structures in NGC 5044, we binned the ALMA data cube into velocity slices with bin widths ranging from 10 to 100 km s-1. We found that a bin width of 50 km s-1 optimized the signal-to-noise of the emission lines. Fig. 2 displays channel maps between -350 km s-1 and 150 km s-1 in 50 km s-1 slices. A total of 24 molecular structures are detected with a CO(2-1) surface brightness exceeding within the central 2.5 kpc (16.7′′) where the primary beam response is greater than 0.3. More structures are detected at larger radii, but we limit all further analysis in this paper to these 24 molecular structures. Our ALMA data covered a velocity range from -400 to 400 km s-1 centered
on the systemic velocity of NGC 5044. No molecular structures were detected in emission with redshifts between 150-400 km s-1 or blueshifts between 350-400 km s-1. However, an absorption feature is detected in the central continuum source at 250 km s-1 and is discussed further in .
The channel maps show that the velocity distribution of the molecular structures in NGC 5044 is highly asymmetric. There are 16 blueshifted structures and only 8 redshifted structures within the central 2.5 kpc. The blueshifted structures span a broad range in velocity, while the redshifted structures are more localized in velocity space. The blueshifted structures also are more centrally concentrated (at least in projection) compared to the redshifted structures.
CO(2-1) spectra were extracted for all 24 molecular structures identified in Fig. 2 and fit to a Gaussian profile. The best-fit mean velocity, linewidth and integrated flux density are shown in Table 1 and the spectra are shown in Fig. 3. For some molecular structures, the signal-to-noise was insufficient to obtain a well constrained fit. In addition, the spectra of some structures are not well described by a simple Gaussian. For example, see the spectrum of molecular structure 13 in Fig. 3, which has a extended blue wing. For these molecular structures, only the mean velocity and integrated flux density are listed in Table 1. The molecular mass was computed using the relation in Bolatto et al. (2013),
| (1) |
where is the integrated CO (1-0) flux density in units of Jy km s-1 and is the luminosity distance in units of Mpc. This relation is based on the galactic CO-to-H2 conversion factor of cm-2 (K km s-1)-1. We assume a CO(2-1) to CO (1-0) flux density ratio of 3.2 to estimate the molecular mass based on the observed CO(2-1) to CO (1-0) brightness temperature ratio of 0.8 for molecular clouds in spiral galaxies (e.g., Braine & Combes 1992) and the factor of two in frequency.
The molecular masses of the structures range from M⊙ (corresponding to the sensitivity limit) to M⊙ and the linewidths vary from 15 to 65 km s-1. While resolved GMCs in the Milky Way and local group galaxies can have masses up to M⊙, linewidths seldom exceed 10 km s-1 (Solomon et al. 1987; Blitz et al. 2006; Fukui et al. 2008; Bolatto et al. 2013) and we therefore refer to the molecular structures detected in NGC 5044 as giant molecular associations (GMAs).
The total molecular mass of the GMAs listed in Table 1 is M⊙, the mean velocity is km s-1 and the velocity dispersion is 122 km s-1, which is less than the stellar velocity dispersion of 237 km s-1. While there is a significant difference in the number of red and blueshifted GMAs, the molecular mass is evenly divided between the red and blueshifted GMAs. This is due to the massive redshifted GMA 18 which contains 20% of the total molecular mass.
3.1 The central region
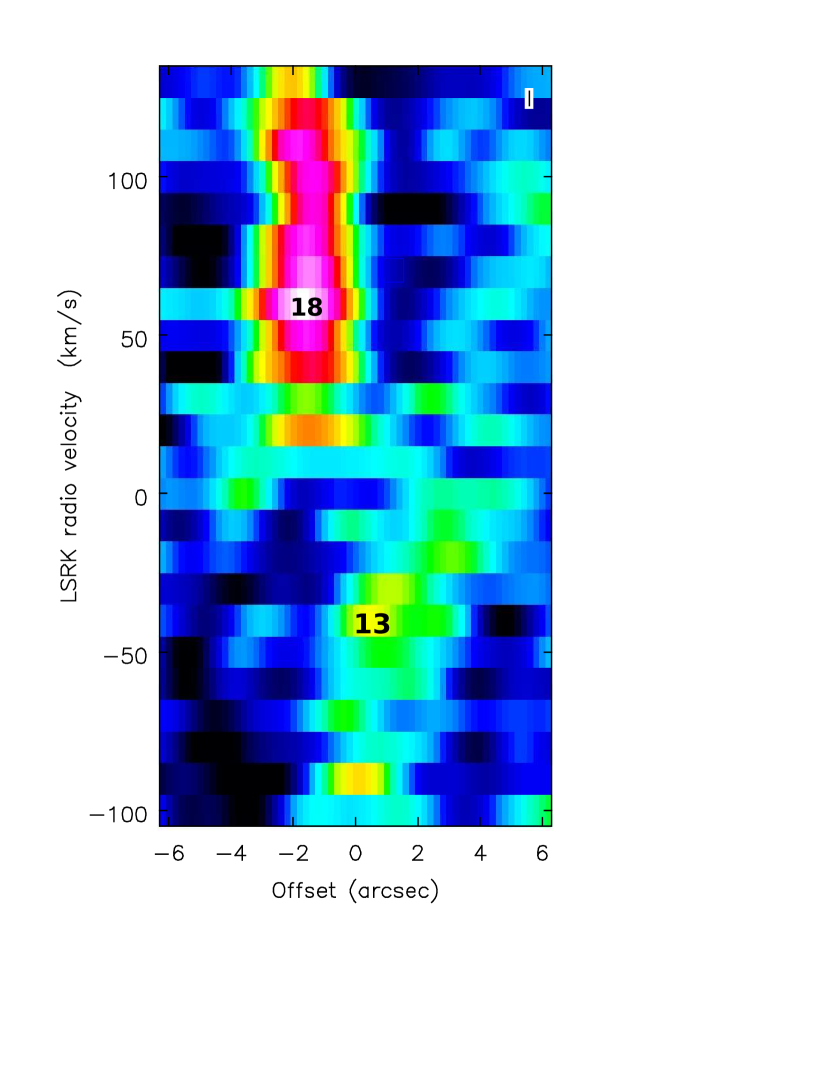
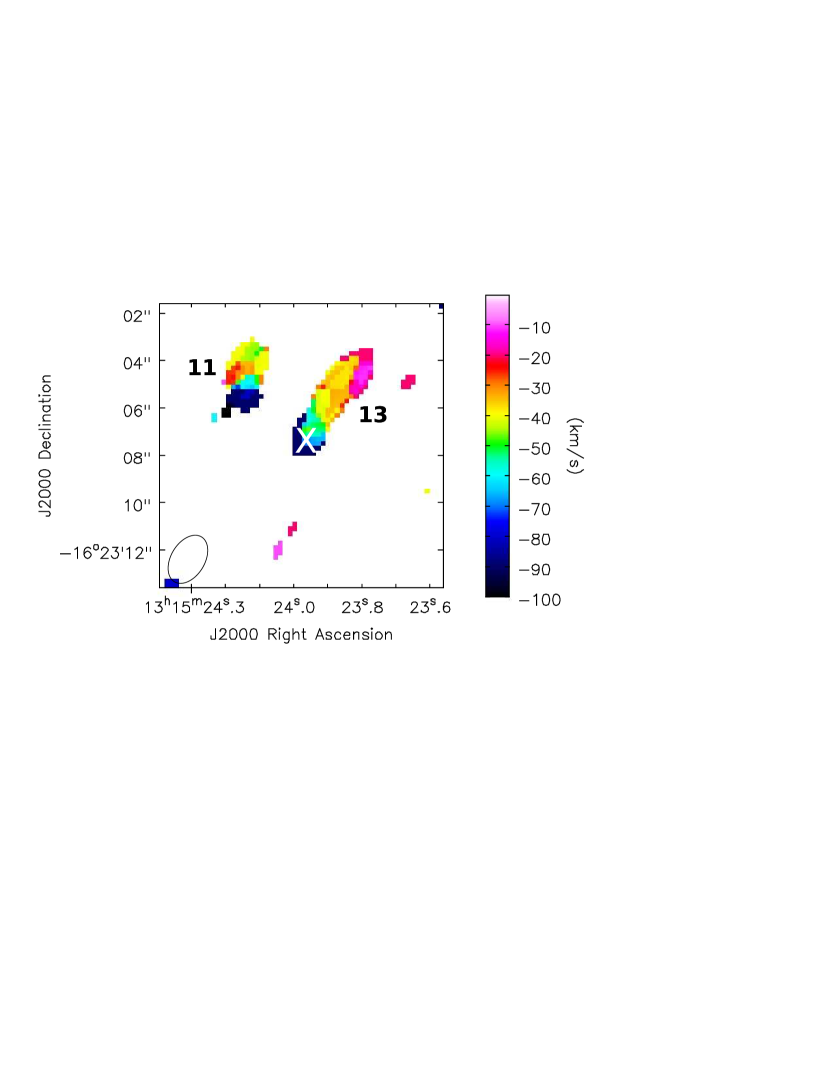
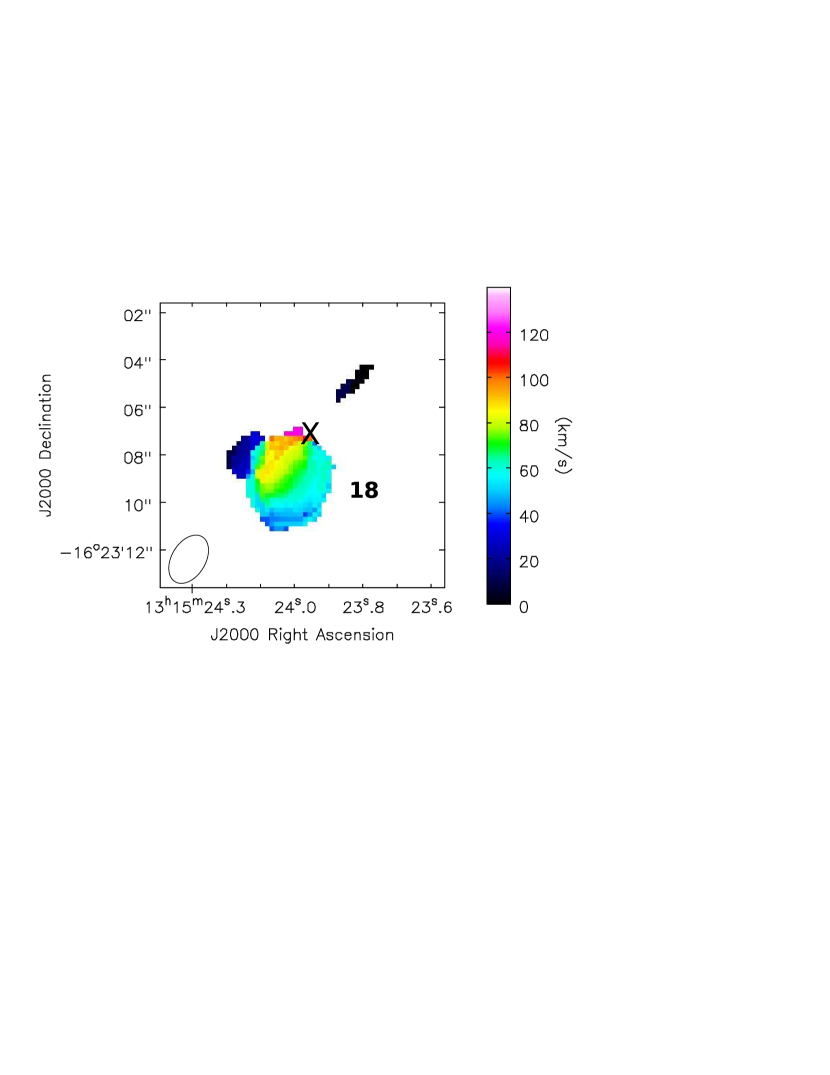
There are several GMAs within the central 1 kpc diameter region that span more than one channel map. The channel maps suggest the possibility that GMAs 13 and 18 are contiguous across the central AGN, however the position-velocity diagram in Fig. 4 shows that GMAs 13 and 18 are distinct molecular structures. Fig. 4 also shows that there is no molecular structure with a smooth transition in velocities (from redshifted to blueshifted) across the systemic velocity of the galaxy, which would indicate the presence of a central disk. To further investigate the kinematics of the central GMAs we generated velocity maps in two separate velocity slices (from -100 to 0 km s-1 and from 0 to 130 km s-1) to prevent projection effects along the line of sight. Fig. 5 shows that GMAs 11 and 13 have velocities near the systemic velocity of NGC 5044 at large radii and monotonically increasing blueshifted velocities close to the central AGN. The blue shifted emission from GMA 13 is also visible in Fig. 3. This suggests that these two GMAs are falling into the center of the galaxy from the far side of the galaxy, similar to the situation observed in Perseus (Lim et al. 2008). Fig. 6 shows that the gas velocity in GMA 18 increases along a SW to NE direction and suggests that GMA 18 is falling into the central region of the galaxy from the near side of the galaxy. The feature in Fig. 6 toward the NE of GMA 18 at a velocity of 20 km s-1 shows up as a separate molecular structure in Fig. 4.
The results shown in Table 1 were derived by fitting spectra binned into 10 km s-1 channels. GMA 18 produces 20% of the total flux within the central 2.5 kpc and the signal is strong enough to permit a higher resolution study. Fig. 7 shows a 1 km s-1 per channel spectrum of GMA 18 which clearly shows the presence of two separate components. Fitting a double Gaussian model yields a mean velocity, linewidth and molecular mass for the narrow-line component of 58.7 km s-1, 5.5 km s-1 and M⊙. While the molecular mass of the narrow-line component in GMA 18 is comparable with some of the lower mass GMAs detected in NGC 5044, the linewidth is much smaller and more typical of an individual GMC (Solomon et al. 1987; Blitz et al. 2006; Fukui et al. 2008; Bolatto et al. 2013).
Using the CASA task imfit, we fit 2D Gaussians to GMAs 11, 13 and 18 (the best resolved molecular structures in the center of NGC5044 which also comprise 35% of the total observed

molecular mass). The task imfit computes the best-fit FWHM along the major and minor axes of the 2D Gaussian. We define the cloud radius as , where FWHM/2.35, and obtain deconvolved cloud radii of , and pc for GMAs 11, 13 and 18, respectively. Using these radii and the molecular cloud masses listed in Table 1, we obtain surface mass densities of , and pc-2, and volume densities of , and cm-3 for GMAs 11, 13 and 18, respectively. Assuming an average density of cm-3 for true GMCs, the average GMC volume filling factor for the three GMAs is 15%.
The virial parameter,
| (2) |
can be used to determine if a cloud is self-gravitating () or self-gravitating and in virial equilibrium (). For GMA 11 and the broad-line component of GMA 18, and 24, respectively, indicating that these GMAs are not self-gravitating. We do not estimate for GMA 13 since its spectrum does not follow a simple Gaussian profile. While GMA 18 as a whole
is gravitationally unbound, the presence of the narrow-line feature seen in Fig. 7 shows that GMA 18 contains at least one virialized GMC.
3.2 The Central AGN and Absorption Feature
The central AGN in NGC 5044 is surprisingly bright in the ALMA data with a flux density of mJy and luminosity of erg s-1 measured in a line-free region. We used the CASA task imfit to confirm that the central emission is consistent with a point source. For comparison, the total flux densities (central point source plus extended emission) for 5044 at 235 MHz and 610 MHz from GMRT data are 229 mJy and 39 mJy (Giacintucci et al. 2008). Thus, the 230 GHz luminosity of the central AGN is at least 500 times greater than its luminosity at 610 MHz and a factor of a few greater than the bolometric X-ray luminosity (Giacintucci et al. 2008; David et al. 2009). As mentioned above, the large number of X-ray cavities within the central region of NGC 5044 are probably due to multiple AGN outbursts over the past yrs. The detection of 230 GHz continuum emission from the AGN shows that it is presently undergoing another outburst, probably due to a recent accretion event.
It is unlikely that thermal emission from dust makes a substantial contribution to the 230 GHz continuum emission. Spitzer data shows that the 70 dust emission is extended (Temi et al. 2007). In addition, even if all of the 70 emission was assumed to originate from within the central region, the dust emission models developed by Temi et al. (2007) predict a flux density at 230 GHz of less than 1 mJy. The models in Temi et al. assume a steady-state balance between dust production and ion sputtering and include heating from starlight and inelastic collision with thermal electrons. The FIR emissivity was computed by integrating over the local grain size (and therefore) temperature distribution.
A pronounced absorption feature is seen in the CO(2-1) spectrum of the central continuum source (see Fig. 8.). Fitting a Gaussian profile to the absorption feature gives a mean velocity of km s-1 and a linewidth of km s-1. The line-of-sight velocity is a significant fraction of the circular velocity indicating that the cloud is falling into the central region of the galaxy on a nearly radial orbit. The optical depth at line center is , indicating that either 30% of the continuum
source is covered by an optically thick cloud or that the entire continuum source is covered by diffuse molecular gas with . Due to the presence of faint line emission near the AGN, we were limited to a maximum extraction region of 2′′ by 2′′ for the AGN spectrum shown in Fig. 8 which excludes some of the AGN continuum emission. The use of a smaller aperture does not affect the fraction of the continuum flux that is absorbed which is the main parameter of interest. We confirmed this by extracting spectra in several smaller regions and found that 30% of the continuum flux is absorbed at line-center in all spectra. The linewidth of the absorber is typical of an individual GMC. Assuming the linewidth-size relation in Solomon et al. (1987), we obtain a size for the absorbing cloud of 27 pc, implying that the radius of the continuum emission is less than 50 pc. Alternatively, the absorption could be due to diffuse molecular gas that fully covers the continuum emission. In this case, the column density of the diffuse CO must be cm-2. Since the ratio of to varies significantly in diffuse molecular gas (Burgh et al. 2007; Liszt 2012) we cannot accurately estimate .
3.3 Correlations between the molecular gas, H filaments, dust and hot gas
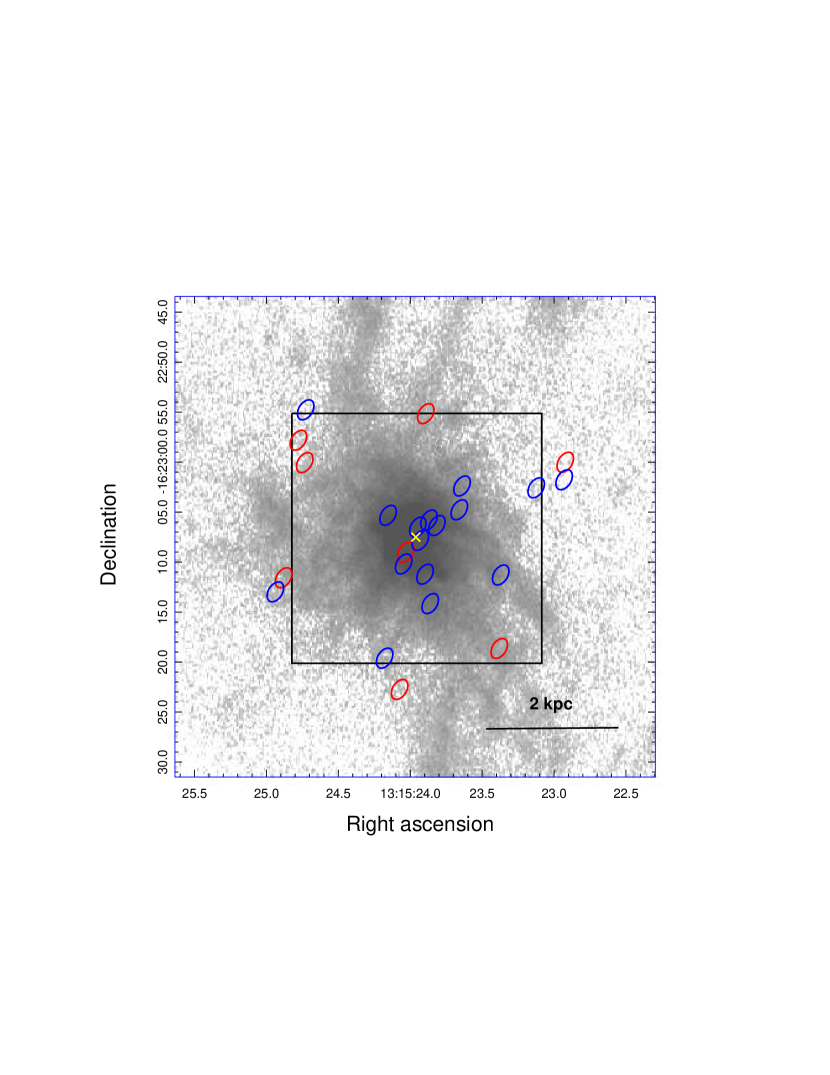
The distribution of the 24 GMAs listed in Table 1 is shown on an HST dust extinction map in Fig. 9. This map was created based on a F791W image obtained with the WFPC2 Planetary Camera. The two-dimensional surface brightness distribution of the galaxy was fit with two Sersic components using GALFIT (Peng et al. 2002; 2010). The original image was divided by the best fitting model and resulting ratio image was converted to magnitudes. While the most massive molecular structure, GMA 18 (the red circle close to the center of the figure), is spatially coincident with the highest extinction region toward the SE of the AGN, and a few of the GMAs trace the dust filaments toward the NW, there is not an obvious spatial correlation between the population of GMAs and the dust. Most GMCs have visual extinctions significantly greater than 1 mag (Pineda et al. 2010), which would be easily identified in Fig. 9. On theoretical grounds, it is difficult for CO to form with less shielding (Wolfire et al. 2010). It is possible that the GMAs not associated with regions of high extinction are located in dusty regions on the far side of the galaxy which would not produce much extinction.

NGC 5044 has the brightest system of H+[NII] filaments among groups of galaxies (Sun et al. 2014). The H+[NII] filaments primarily extend along a north-south direction (see Fig. 10). Most of the GMAs are concentrated within the central region of the H+[NII] emission. Due to the limited ALMA field-of-view, it is difficult to determine how well the molecular gas traces the H+[NII] filaments at larger radii. Caon et al. (2000) measured the kinematics of the H+[NII] filaments in NGC 5044 using long slit spectroscopy. They found that the velocity profiles along the slits were fairly irregular, but the bulk of the H+[NII] emission was blueshifted by 60-100 km s-1 relative to the systemic velocity of NGC 5044. The predominance of blueshifted H+[NII] emission is consistent with the presence of mostly blueshifted GMAs in the central region.
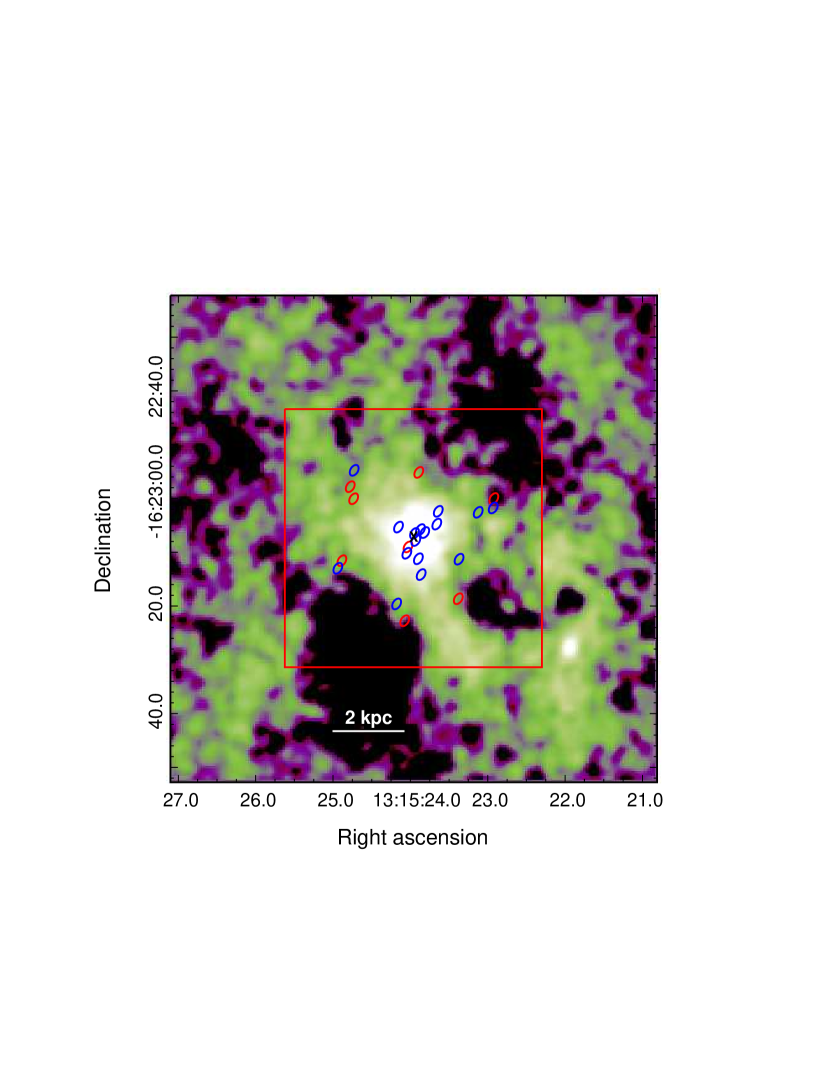
The unsharp masked 0.5-2.0 keV Chandra ACIS image from David et al. (2009) is shown in Fig. 11 along with the GMAs detected in the ALMA data. Most of the GMAs are clustered within the central region which contains the coolest and lowest entropy X-ray emitting gas. The radiative cooling time of the hot gas in the central region is about yr, which is well below the observed threshold for triggering star formation (Rafferty et al. 2008; Voit et al. 2008). The limited ALMA field-of-view does not permit a detailed comparison between the molecular gas and the larger scale structure seen in the ACIS image.
Werner et al. (2014) recently presented Herschel observations of a sample of eight elliptical galaxies. All six galaxies in their sample with H emission were detected in [C II] (which is produced in the photodissociation region surrounding molecular clouds), including NGC 5044. The spatial resolution of Herschel at the [CII] emission line is and is insufficient to perform a detailed comparison between the GMAs and the [CII] emission. Overall, the [CII] emission is elongated in a north-south direction, similar to the H emission. The velocity structure of the [C II] emission is also similar to the GMAs with predominately blueshifted emission relative to the systemic velocity of the galaxy near the center of NGC 5044 and mostly

redshifted emission at larger radii. However, the [C II] emission is only detected over a velocity range of about 120 km s-1 compared to a velocity range of 450 km s-1 for the CO(2-1) emission.
4 Discussion
4.1 Source of the Molecular gas
We detect 24 GMAs above a surface brightness limit of 0.16 Jy beam-1 with a total mass of within the central 2.5 kpc in NGC 5044. The molecular gas in NGC 5044 has a roughly azimuthally symmetric distribution, no evidence of any disk-like structures and a velocity dispersion less than the stellar velocity dispersion. Werner et al. (2014) found that only systems like NGC 5044 with thermally unstable gas, based on the Field criterion, contain [C II] emitting gas. All these characteristics point to an intrinsic (i.e., cooling flow) and not extrinsic (i.e., merger with a gas rich system) origin for the molecular gas. To estimate the mass shed from evolving stars we use the 2MASS data to compute , a specific stellar mass loss rate of s-1 (Renzini & Buzzoni 1986, Mathews 1989) and a mass-to-light ratio of (based on dynamical measurements of early-type galaxies by Humphrey et al. 2006). Within the central 10 kpc, the stellar mass loss rate is = 0.23 M⊙ yr-1. There is evidence for multiphase hot gas out to at least 10 kpc in NGC 5044 (Buote et al. 2003; David et al. 2009), indicating that even in the presence of multiple AGN outbursts, some hot gas is able to cool. The classical mass deposition rate () within the central 10 kpc is 5.1 M⊙ yr-1. It is unclear what fraction of the X-ray emitting gas is able to cool due to AGN feedback. Fitting a cooling flow model to the ACIS data within the central region of NGC5044 does not provide useful constraints on the spectroscopic mass deposition rate since the ambient gas temperature is only 0.7 keV and the ACIS response declines rapidly below 0.5 keV. The cavity power derived in David et al. (2009) is about one-half of the X-ray luminosity within the
central 10 kpc, but this number depends on the uncertain volume of the cavities. As long as 5% of the hot gas is able to cool, mass deposition from the cooling flow will be the dominant supply mechanism for the molecular gas.
Neglecting the suppression of gas cooling by AGN feedback, the molecular mass contained within the 24 GMAs can be produced by gas cooling within the central 10 kpc in approximately 8 Myr. Due to the limited sensitivity and coverage in our cycle 0 ALMA data, the 24 GMAs we detect is probably a lower limit. The H and [C II] emission, which traces molecular gas, extend to at least 7 kpc. The integrated CO(2-1) flux density in the IRAM 30m data is significantly greater than that in the ALMA data (especially in the blueshifted emission) which is presumably due to a significant component of diffuse molecular gas that is resolved out in the ALMA data. Any additional molecular gas or reduction in the mass deposition rate due to AGN feedback would require a longer accumulation time for the molecular gas.
4.2 Cloud Dynamics
There are several indications of infalling molecular gas in NGC 5044 (i.e., the absorption feature seen against the central continuum source and the velocity gradients in GMAs 11 and 13) and no indications of disk-like structures. The smooth X-ray morphology of the NGC 5044 group on large scales indicates that the gas is in nearly hydrostatic equilibrium, but the observed structure within the central region (see Fig. 11) suggests that there is some AGN-driven turbulence. However, the turbulent velocities are probably a small fraction of the sound speed of the hot gas. Turbulent velocities greater than 20-40 km s-1 would generate a heating rate due to the dissipation of turbulent kinetic energy that exceeds the radiative cooling rate of the hot gas (David et al. 2011). The linewidth of an individual GMA should reflect the turbulent velocity of the hot gas from which it formed. It is interesting to note that the observed linewidths of the GMAs in NGC 5044 are comparable to that required to balance radiative cooling with the dissipation
of turbulent kinetic energy in the hot gas.
The kinematics of the molecular gas in NGC 5044 are very different from that observed in the more massive clusters A1835 (McNamara et al. 2014) and A1664 (Russell et al. 2014). ALMA cycle 0 observations show that both of these systems have more than of molecular gas. Abell 1664 has a massive central disk-like molecular structure and several high velocity clumps ( km s-1) which could be either infalling or outflowing. The molecular gas in A1835 is distributed between a nearly face-on disk and a bipolar outflow, possibly driven by radio jets or buoyant X-ray cavities (McNamara et al. 2014).
Both A1664 and A1835 host much more powerful AGNs compared to NGC 5044. The cavity power in NGC 5044 is erg s-1 (David et al. 2009), compared to erg s-1 in A1664 (Russell et al. 2014) and erg s-1 in A1835 (McNamara et al. 2014). For buoyancy to have a significant impact on the molecular gas, the displaced mass in the X-ray cavities must equal the molecular gas mass. For NGC 5044 this would require the displacement of all the hot gas within the central 2 kpc, which obviously has not happened (see Fig. 11). The total displaced gas mass in the cavities seen in Fig. 11 is approximately , which is only 15% of the observed molecular gas mass. While an X-ray cavity could still affect the dynamics of an individual GMA, there is no observed correlation between the velocities of the GMAs and their proximity to X-ray cavities. GMRT observations also show that NGC 5044 does not have a large scale collimated jet (Giacintucci et al. 2011). Thus, due to the presence of only a weak AGN in NGC 5044, we conclude that the molecular gas essentially follows ballistic trajectories after condensing out of the hot X-ray emitting gas.
4.3 Are the GMAs confined?
We showed above that GMAs 11 and 18 would have to be more than 20 times more massive to be gravitationally bound. While we cannot make a general statement about the entire GMA population in NGC 5044, it is clear that the largest GMAs
are not gravitationally bound. From the Chandra ACIS data we can compute the thermal pressure of the X-ray emitting gas and determine if the GMAs are pressure confined. The thermal pressure of the hot gas in the vicinity of GMA 18 is K cm-3, assuming GMA 18 is located at a radial distance equal to its projected distance. The CO(2-1) linewidth in GMA 18 is approximately 90 times the sound speed of the gas (assuming a kinetic temperature of 30 K), indicating that the pressure in GMA 18 is dominated by supersonic turbulence. The turbulent pressure in GMA 18 is K cm-3, which is a factor of four greater than the thermal pressure of the surrounding hot gas, suggesting that GMA is not pressure confined. However, even if the computed turbulent pressure was less than the thermal pressure of the hot gas, it is doubtful that GMA 18 could be confined by the hot gas. Our estimate for the turbulent pressure assumes that the bulk of GMA 18 is filled with gas at the volume-averaged density and that all of this gas has a turbulent velocity equal to the observed CO(2-1) linewidth. Both of these assumptions are probably not valid. As mentioned above, the volume filling factor of the few resolved GMAs is fairly small, so the observed CO(2-1) linewidths should be thought of as the velocity dispersion of the embedded GMCs, each of which has a smaller internal velocity dispersion and higher density. Due to the factor of contrast in densities between the embedded GMCs and the X-ray emitting gas, the thermal pressure of the hot gas will not decelerate and confine the ballistically moving GMCs within a GMA. Thus, it appears unlikely that the few resolved GMAs in NGC 5044 are confined by either self-gravity or thermal pressure.
Individual GMCs will only be dynamically affected by the hot gas after sweeping up a mass equal to their own mass. Typical GMCs have radii of a few pc and must therefore travel a few kpc due to the factor of contrast in density between the cold and hot gas before sweeping up their own mass. This distance is more than an order of magnitude greater than the largest observed GMA. Since the GMAs are not confined by self-gravity or thermal pressure, they should disperse in the time it takes a GMC to cross the GMA. Given the observed radius and linewidth of GMA 18, embedded GMCs should traverse the GMA in a time of =12 Myr, which is less than the central 40 Myr cooling time of the hot gas. This implies that the embedded GMCs within a GMA must condense out of the hot gas at the same time and that the observed GMAs in NGC 5044 probably arise from local concentrations of thermally unstable parcels of hot gas. One possible mechanism for producing a local concentration of cooling parcels of hot gas is the presence of dust, possibly transported outward by AGN outbursts as discussed in Temi et al. (2007). Dust grains accelerate the cooling of the hot gas due to inelastic collisions between the thermal electrons and the dust (Mathews and Brighenti et al. 2003). Reducing the cooling time of the gas also helps the non self-gravitating GMAs maintain their integrity as they cool.
4.4 Effects of Star Formation
The star formation rate in NGC 5044 based on GALEX and WISE data is 0.073 M⊙ yr-1 (Werner et al. 2014). NGC 5044 also has unusual polycyclic aromatic hydrocarbon (PAH) line ratios compared to other early-type galaxies (Vega et al. 2010) and a highly uncertain stellar age (Marino et al. 2010), both of which may result from episodes of star formation over the past few Gyrs. The depletion time of the molecular gas due to star formation is approximately 700 Myr, which is typical for molecular gas in brightest cluster galaxies embedded in cooling flows (O’Dea et al. 2008; Voit & Donahue 2011), but the IRAM 30m data shows that there may be a significant amount of diffuse molecular gas that was undetected in the ALMA data which would substantially increase the depletion time.
The Kennicutt (1998) relation between star formation rate and gas surface density predicts a combined star formation rate from GMAs 11, 13 and 18 of 0.03 M⊙ yr-1. Considering that these three GMAs comprise about 35% of the observed molecular gas, this estimate is in reasonably good agreement with the observed star formation rate. Assuming that one Type II supernova (SNeII) is produced for every 100 M⊙ consumed into stars and that each SNeII produces erg, the SNeII heating rate in GMA 18 should be erg s-1. If we assume that GMA 18 has a lifetime of 12 Myr (i.e., the crossing time of an individual GMC), then a total of erg of energy will be released by SNeII during this time, which corresponds to 60% of the turbulent kinetic energy in GMA 18. Thus, depending on the how SNeII energy is partitioned between radiative and mechanical energy, SNeII could play a role in driving the internal turbulence and dissipation of the GMAs.
5 Summary
Our ALMA cycle 0 observation shows that the cooling flow in the X-ray bright group NGC 5044 is a breeding ground for molecular gas. The CO(2-1) emission within the central 2.5 kpc is distributed among 24 molecular structures with a total molecular mass of . Only a few of the molecular structures are spatially resolved and the observed radii, linewidths and masses of the these structures indicate that they are not gravitationally bound. Given the large CO(2-1) linewidths of the structures, they are likely giant molecular associations and not individual clouds. The average density of the few resolved GMAs yields a GMC volume filling factor of 15%. One narrow line component is detected within the largest GMA with a linewidth comparable to a virialized GMC.
While the large scale spatial distribution of the GMAs is azimuthally symmetric, there are some systematic differences in velocity space. Approximately 20% of the molecular gas is contained in a single massive, redshifted GMA near the center of NGC 5044. The remainder of the molecular gas is divided between many lower mass GMAs with a greater central concentration among the blueshifted GMAs compared to the redshifted GMAs. On global scales, the kinematics of the molecular gas is similar to that observed in the H filaments (Caon et al. 2000) and [C II] emitting gas (Werner et al. 2014).
There are no disk-like molecular structures observed in NGC 5044. Two of the GMAs have velocity maps suggesting that they are falling into the center of NGC5044 from the far side of the galaxy. There is also an absorption feature seen in the CO(2-1) spectrum of the central continuum source with an infalling velocity of 250 km s-1 and a linewidth typical of an individual GMC. Combining these results with the presence of infalling molecular gas in the Perseus cluster (Lim et al. 2008) suggest that infalling molecular gas is common in cooling flows. The observed molecular mass and distribution and kinematics of the GMAs in NGC 5044 are consistent with a scenario in which the molecular gas condenses out of the thermally unstable hot gas and then follows ballistic trajectories. AGN-inflated buoyant cavities should not have a major impact on the dynamics of the molecular gas as a whole, except possibly in the immediate proximity of an X-ray cavity.
The integrated CO(2-1) flux density in the IRAM 30m observation of NGC 5044 is significantly greater than that produced by the molecular structures detected in the ALMA data. This is presumably due to a significant component of diffuse molecular gas that has been resolved out in the ALMA data. Due to the lack of gravitational or pressure confinement, the GMAs detected in NGC 5044 should disperse on a timescale of about 12 Myr, which is less than the 40 Myr central cooling time of the hot gas, so the embedded GMCs within a GMA must condense out of the hot gas at the same time. Thus, the observed GMAs probably arise from local concentrations of over dense, thermally unstable regions in the hot gas.
The wealth of information obtained from our 30 minute cycle 0 ALMA observation of the near by NGC 5044 group shows that it is an ideal target for investigating the formation of molecular gas in cooling flows and the long standing question about the ultimate fate of the cooling gas. More sensitive and higher resolution ALMA observations in future cycles promise to illuminate the internal structure of the GMAs detected in the cycle 0 observation.
This paper makes use of the following ALMA data: ADS/JAO.ALMA#2011.0.00735.S. ALMA is a partnership of ESO (representing its member states), NSF (USA) and NINS (Japan), together with NRC (Canada) and NSC and ASIAA (Taiwan), in cooperation with the Republic of Chile. The Joint ALMA Observatory is operated by ESO, AUI/NRAO and NAOJ. The National Radio Astronomy Observatory is a facility of the National Science Foundation operated under cooperative agreement by Associated Universities, Inc. This work was supported in part by NASA grant GO2-13146X. ACE acknowledges support from STFC grant ST/I001573/1. We would like to thank M. Birkinshaw for assistance in learning CASA and analyzing the ALMA data and B. McNamara and P. Nulsen for discussions about their cycle 0 ALMA observations of clusters of galaxies.
References
- (1) Allen, S. 1995, MNRAS, 276, 947.
- (2) Amblard, A., Riguccini, L., Temi, P., Im, S., Fanelli, M. & Serra, P. 2014, ApJ, 783, 135.
- (3) Blanton, E., Sarazin, C. & McNamara 2003, ApJ, 585, 227.
- (4) Blitz, L., Fukui, Y., Kawamura, A., et al. 2007, in Protostars and Planets V, ed. B. Reipurth, D. Jewitt, & K. Keil (Tucson, AZ: Univ. of Arizona Press), 81.
- (5) Birzan, L., Rafferty, D., McNamara, B., Wise, M.& Nulsen, P. 2004, ApJ, 607, 800.
- (6) Braine, J. & Combes, F. 1992, A&A, 433, 443.
- (7) Bolatto, A., Wolfire, M. & Leroy, A. 2013, ARA&A, 51, 207.
- (8) Buote, D., Lewis, A., Brighenti, F. & Mathews, W. 2003, 594, 741.
- (9) Burgh, E., France, K. & McCandliss, S. 2007, ApJ, 658, 454.
- (10) Caon, N., Machetto, D. & Pastoriza, M. 2000, ApJS, 127, 39.
- (11) Cellone, S. & Buzzoni, A. 2005, NNRAS, 356, 41.
- (12) David, L., Nulsen, P. E. J., McNamara, B., Forman, W., Jones, C., Ponman, T., Robertson, B. & Wise, M. 2001, ApJ, 557, 546.
- (13) David, L., Jones, C., Forman, W., Nulsen, P., Vrtilek, J., O’Sullivan, E., Giacintucci, S. & Raychaudhury, S. 2009, ApJ, 705, 624.
- (14) David, L., O’Sullivan, E.,Jones, C., Giacintucci, S., Vrtilek, J., Raychaudhury, S., Nulsen, P., Forman, W., Sun, M. & Donahue, M. 2011, ApJ, 728, 162.
- (15) Donahue, M., Mack, J., Voit, G., Sparks, W., Elston, R. & Maloney, P. 2000, ApJ, 545, 670.
- (16) Donahue, M., Sun, M., O’Dea, C., Voit, G., Cavagnolo, K. 2007, AJ, 134, 14.
- (17) Dunn, R. & Fabian, A. 2006, MNRAS, 373, 959.
- (18) Edge, A. 2001, MNRAS, 328, 762.
- (19) Egami, E., Misselt, K., Rieke, G., Wise, M., Neugebauer, G., Kneib, J., Le Floc’h, E., Smith, G., Blaylock, M., Dole, H., Frayer, D., Huang, J., Krause, O., Papovich, C., Pérez-González, P. & Rigby, J. 2006a, ApJ, 647, 922.
- (20) Egami, E., Rieke, G., Fadda, D. & Hines, D. 2006b, ApJ, 652, 21.
- (21) Fabian, A., Nulsen, P. E. J. & Canizares, C. 1984, Nature, 310, 733.
- (22) Fabian, A., Sanders, J, Allen, S., Crawford, C., Iwasawa, K., Johnstone, R., Schmidt, W. & Taylor G. 2003, MNRAS, 344, 43.
- (23) Forman, W. et. al. 2007, ApJ, 665, 1057.
- (24) Fukui, Y. et al. 2008, ApJS, 178, 56.
- (25) Gastaldello, F., Buote, D., Temi, P., Brighenti, F., Mathews, W., Ettori, S. 2009, ApJ, 693, 43.
- (26) Gastaldello, F. et al. 2013, ApJ, 770, 56.
- (27) Giacintucci, S., Vrtilek, J., Murgia, M., Raychaudhury, S., O’Sullivan, E., Venturi, T., David, L., Mazzotta, P., Clarke, T., Athreya, R. 2008 ApJ, 682, 186.
- (28) Heckman, T. 1981, ApJ, 250, 59.
- (29) Hu, E., Cowie, L. & Wang, Z. 1985, ApJSuppl, 59, 447.
- (30) Humphrey, P., Buote, D., Gastaldello, F., Zappacosta, L., Bullock, J., Brighenti, F. & Mathews, W. 2006, ApJ, 646, 899.
- (31) Jaffe, W. & Bremer, M. 1997, MNRAS, 284, 1.
- (32) Kennicutt, R. 1998, ApJ, 498, 541.
- (33) Larson, R. 1981, MNRAS, 194, 809.
- (34) Lim, J., Ao, Y. & Trung, D. 2008, ApJ, 672, 252.
- (35) Liszt, H. & Pety, J. 2012, A&A, 541, A58.
- (36) Marino, A., Rampazzo, R., Bianchi, L., Annibali, F., Bressan, A., Buson, L. M., Clemens, M., Panuzzo, P. & Zeilinger, W. 2010, MNRAS, 411, 311.
- (37) Mathews, W. 1989, AJ, 97, 42.
- (38) Mathews, W. & Brighenti, F. 2003, ApJ, 599, 992.
- (39) Sun, M. et al. 2014 (in preparation).
- (40) McNamara, B. et al. 2000, ApJ, 534, 135.
- (41) McNamara, B. & O’Connell, R. 1989, AJ, 98, 2018.
- (42) McNamara, B. et al. 2014, ApJ, 785, 44.
- (43) O’Dea, C. et al. 2008, ApJ, 681, 1035.
- (44) O’Sullivan, E., Giacintucci, S., David, L., Gitti, M., Vrtilek, J., Raychaudhury, S. & Ponman, T. 2011, ApJ, 735, 11.
- (45) O’Sullivan, E., David, L. & Vrtilek, J. 2014, MNRAS, 437, 730.
- (46) Peng, C., Ho, L., Impey, C. & Rix, H.-W 2002, AJ, 124, 266.
- (47) Peng, C., Ho, L., Impey, C. & Rix, H.-W 2010, AJ, 139, 2097.
- (48) Peterson, J., Kahn, S., Paerels, F., Kaastra, J., Tamura, T., Bleeker, J., Ferrigno, C. & Jernigan, J. 2003, ApJ, 590, 207.
- (49) Pineda, J., Goldsmith, P., Chapman, N., Snell, R., Li, D., Cambresy, L. & Brunt, C. 2010, ApJ, 721, 686.
- (50) Quillen, A. et al. 2008, ApJSuppl, 176, 39.
- (51) Rafferty, D., McNamara, B. Nulsen, P. & Wise, M. 2006, ApJ, 652, 216.
- (52) Rafferty, D., McNamara, B. & Nulsen, P. 2008, ApJ, 687, 899.
- (53) Randall, S. Forman, W., Giacintucci, S., Nulsen, P., Sun, M., Jones, C., Churazov, E., David, L., Kraft, R., Donahue, M., Blanton, E., Simionescu, A. & Werner, N. 2011, ApJ, 726, 86.
- (54) Roediger E., Bruggen M., Simionescu A., Bohringer H., Churazov E., Forman W. R., 2011, MNRAS, 413, 2057
- (55) Rawle, T. et al. 2012, ApJ., 747, 29.
- (56) Russell, H. et al. 2014, ApJ, 784, 78.
- (57) Salome, P. & Combes, F. 2003, A&A, 412, 657.
- (58) Salome, P., Combes, F., Edge, A. C., Crawford, C., Erlund, M., Fabian, A. C., Hatch, N. A., Johnstone, R. M., Sanders, J. S. & Wilman, R. J. 2006, A&A, 454, 437.
- (59) Solomon, P., Rivolo, A., Barrett, J. & Yahil, A. 1987, ApJ, 319, 730.
- (60) Temi, P., Brighenti, F. & Mathews, W. 2007, ApJ, 666, 222.
- (61) Tonry, J., Dressler, A., Blakeslee, J., Ajhar, E., Fletcher, A., Luppino, G., Metzger, M. & Moore, C. 2001, ApJ, 546, 681.
- (62) Vega, O., Bressan, A., Panuzzo, P., Rampazzo, R., Clemens, M., Granato, G., Buson, L., Silva, L. & Zeilinger, W. 2010, ApJ, 721, 1090.
- (63) Voit, G. M., Cavagnolo, K., Donahue, M., Rafferty, D., McNamara, B., Nulsen, P. 2008, ApJ, 681, 5.
- (64) Voit, G. M. & Donahue, M. 2011, ApJ, 738, L24.
- (65) Werner, N. et al. 2014, MNRAS, 439, 2291.
- (66) Wolfire, M., Hollenbach, D. & McKee, C. 2010, ApJ, 716, 1191.
| ID | ||||
|---|---|---|---|---|
| (km s-1) | (km s-1) | (Jy km s-1) | ( M⊙) | |
| 1 | ||||
| 2 | ||||
| 3 | ||||
| 4 | ||||
| 5 | ||||
| 6 | ||||
| 7 | ||||
| 8 | ||||
| 9 | ||||
| 10 | ||||
| 11 | ||||
| 12 | ||||
| 13 | ||||
| 14 | ||||
| 15 | ||||
| 16 | ||||
| 17 | ||||
| 18 | ||||
| 19 | ||||
| 20 | ||||
| 21 | ||||
| 22 | ||||
| 23 | ||||
| 24 |
This table gives the GMA ID number, mean velocity, linewidth, integrated CO(2-1) flux density and molecular mass. The S/N for GMAs 14 and 20 is insufficient to fit a Gaussian distribution. In addition, GMAs 8 and 13 do not have a simple Gaussian profile. No linewidths are listed for these GMAs.