Superconductivity in Noncentrosymmetric Iridium Silicide Li2IrSi3
Abstract
The effects of lithium absorption on the crystal structure and electronic properties of IrSi3, a binary silicide with a noncentrosymmetric crystal structure, were studied. X-ray and neutron diffraction experiments revealed that hexagonal IrSi3 (space group ) transforms into trigonal Li2IrSi3 (space group ) upon lithium absorption. The structure of Li2IrSi3 is found to consist of a planar kagome network of silicon atoms with Li and Ir spaced at unequal distances between the kagome layers, resulting in a polar structure along the -axis. Li2IrSi3 exhibited type-II superconductivity with a transition temperature of 3.8 K, displaying a structure type that no previous superconductors have been reported to have.
Silicides constitute a wide variety of superconducting materials. Depending on the various silicon networks, such materials may exhibit superconductivity at relatively high transition temperatures . Prominent examples of such superconductors include clathrate Ba8Si46 ( = 8 K) [1, 2], honeycomb CaSi2 ( = 14 K at 12 GPa) [3] and BaSi2 ( = 6.8 K) [4], hyper-honeycomb SrSi2 ( = 3.1 K) [5], and pyrochlore Ca(Al,Si)2 ( = 2.6 K) [6]. Transition metal silicides also exhibit superconductivity [7, 8], as best exemplified by the superconductivity in V3Si ( = 17 K) [7]. Most silicides, including the aforementioned ones, crystallize with centrosymmetric crystal structures and exhibit conventional -wave superconductivity. In contrast, some silicides are known to crystallize with polar noncentrosymmetric crystal structures. Such crystals lack spatial inversion symmetry, and because of the antisymmetric spin-orbit coupling (ASOC), the parity of the superconducting wave function can be mixed, and the pairing state cannot be classified as either singlet or triplet and may be of mixed character [9, 10, 11]. This may result in novel superconducting properties, for instance, an upper critical field exceeding the Pauli limiting field. Prominent examples of such superconductors include heavy fermion superconductors with polar noncentrosymmetric structures such as CePt3Si ( = 0.75 K and = 5 T) [12] and CeRhSi3 ( = 1.1 K and = 30 T) [13]. In contrast, superconductors of transition metal silicides with similar noncentrosymmetric crystal structures but without cerium exhibit rather conventional behaviors, as reported for CaIrSi3 ( = 3.6 K and = 0.27 T) [14], CaPtSi3 ( = 2.3 K and = 0.15 T) [14], BaPtSi3 ( = 2.25 K) [15], and SrAuSi3 ( = 1.54 K and = 0.22 T) [16], although these compounds consist of heavy transition metal elements such as Ir, Pt, and Au that are subjected to strong ASOC. The observation of unconventional superconductivity in transition metal compounds with noncentrosymmetric crystal structures has been limited to platinum boride Li2Pt3B, in which spin triplet superconductivity has been confirmed by nuclear magnetic resonance (NMR) measurements [17]. Thus, further exploration of noncentrosymmetric compounds with a different class of silicon networks should help to identify unconventional superconductivity in heavy transition metal silicides.
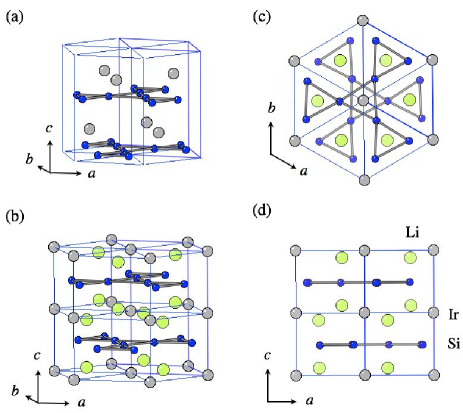
In this paper, we report that superconductivity emerges at = 3.8 K upon the lithium intercalation of noncentrosymmetric IrSi3. IrSi3 crystallizes in a hexagonal structure with the space group ( 186) [18]. This structure consists of infinite, planar, four-connected layers of silicon atoms, i.e., a distorted kagome network, perpendicular to the -axis, with each iridium atom spaced at unequal distances between the adjacent silicon layers [18]; therefore, the crystal structure is strongly polar noncentrosymmetric along the -axis, as shown in Fig. 1(a). We demonstrate that hexagonal IrSi3 absorbs lithium to form Li2IrSi3 with a noncentrosymmetric trigonal structure with the space group ( 159). Electrical and magnetic measurements reveal that Li2IrSi3 exhibits superconductivity at 3.8 K, and specific heat and measurements indicate conventional superconductivity. The absence of unconventional superconductivity is likely due to the weakened inversion symmetry breaking by lithium absorption.
Polycrystalline samples of LixIrSi3 were prepared by the arc-melting method. First, we synthesized IrSi3, the precursor, by arc-melting Ir and Si powders under Ar atmosphere. Then, Li and IrSi3 with a ratio of :1 (0 3) were arc-melted. An almost single-phase LixIrSi3 was obtained for 2. The structure of the samples was examined by electron diffraction, powder X-ray diffraction, and powder neutron diffraction measurements. The magnetization was measured from 1.8 to 4.5 K under a magnetic field of 10 Oe using a SQUID magnetometer (Quantum Design MPMS). The electrical resistivity and specific heat were measured using a Quantum Design PPMS. Electron diffraction patterns were taken using a transmission electron microscope (JEOL JEM-2100F). Synchrotron X-ray powder diffraction (SXRD) data were collected with a large Debye-Scherrer camera installed at the BL02B2 beamline of SPring-8 [19], and analyzed using the RIETAN-FP program [20]. We performed neutron powder diffraction measurements of Li2IrSi3 (weight: 1.047 g) using the HB-2A high-resolution powder diffractometer (at 295 K with a wavelength of 1.5395 Å and collimations of 12’-open-6’) of the High Flux Isotope Reactor (HFIR) at the Oak Ridge National Laboratory (ORNL). The structural parameters were refined by the Rietveld method using the GSAS program [21, 22].
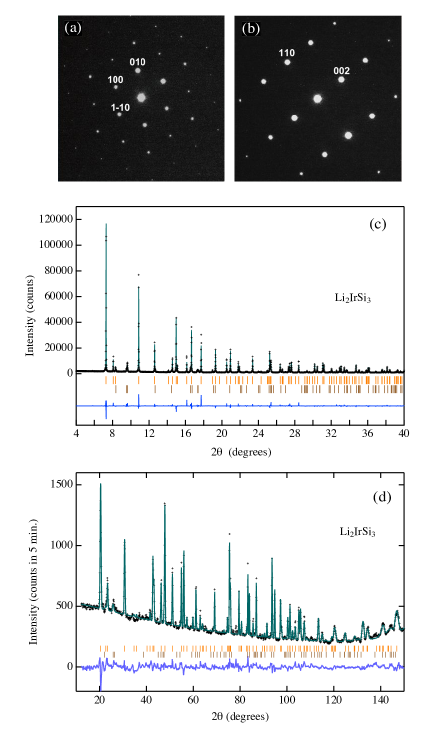
Figures 2(a) and 2(b) show the electron diffraction patterns of the LixIrSi3 () phase taken along the [001] and [10] zone axes, respectively. These patterns show the LixIrSi3 phase to have a trigonal or hexagonal unit cell with lattice parameters of 5.0 Å and 7.8 Å, and the reflections are indexed accordingly. There are systematic absences in the reflections: the reflection conditions are 00 with and with , confirming that the space group is either ( 159), ( 163), ( 186), ( 190), or ( 194). Because of the similarities in composition and lattice parameters, the PuRu3B2 structure with a Ru kagome network was chosen as the initial structural model. Rietveld analysis of SXRD data gave satisfactory low -factors only for ( 159) with a distorted Si kagome network, as shown in Fig. 2(c). Finally, the Rietveld refinements of neutron diffraction data were performed on this model, as shown in Fig. 2(d). The refined lattice parameters and , atomic positions, and occupancy of Li are summarized in Table I. A lithium vacancy exists, and therefore = 1.8 for LixIrSi3. Here, we use the nominal chemical formula Li2IrSi3 for LixIrSi3 with = 1.8.
Figure 1(b) shows the crystal structure of Li2IrSi3. The structure consists of an infinite-planar kagome network of silicon atoms perpendicular to the -axis; therefore, the kagome network of IrSi3 was preserved in Li2IrSi3. Each iridium atom was spaced at unequal distances between the two silicon layers, making the crystal structure polar noncentrosymmetric along the -axis. The displacement from the symmetrical equidistant planes is along the -axis, which is one order of magnitude smaller than that of for IrSi3, suggesting that the polar symmetry breaking is considerably weakened in Li2IrSi3. Lithium atoms are located out of the iridium planes, as shown in Fig. 1(d). The distortion of the silicon kagome network is also weakened in Li2IrSi3; bond alternation in the silicon kagome network of 2.107 and 2.536 Å for IrSi3 is reduced to 2.402 and 2.616 Å for Li2IrSi3, respectively. Another feature of interest is that the corner-sharing Si triangles in the kagome network rotate alternately by 2.4∘ for Li2IrSi3, as shown in Fig. 1(c), while there exists no rotation for IrSi3. The alternate rotation is an additional source of broken spatial inversion symmetry that is characteristic of Li2IrSi3 with the symmetry of the space group .
| Li2IrSi3 | |||||
| Trigonal with a space group ( 159). | |||||
| 5.0139(2) Å, = 7.8397(3) Å. | |||||
| atomic positions | |||||
| site | occupancy | (Å2) | |||
| 2a | Ir 1.0 | 0.00 | 0.00 | 0.00 | 0.70(4) |
| 2b | Li 0.89(4) | 1/3 | 2/3 | 0.0589(10) | 0.35(24) |
| 2b | Li 0.89 | 2/3 | 1/3 | 0.0589 | 0.35 |
| 6c | Si 1.0 | 0.81424 | 0.65238 | 0.24317 | 0.40(5) |
Figure 3 shows the temperature dependences of the electrical resistivity for polycrystalline IrSi3 and Li2IrSi3. Both compounds exhibited metallic behavior. It was found that the Li absorption of IrSi3 reduces the residual resistivity (0) and thus increases the residual resistivity ratio (RRR); (0) = 9.8 cm and RRR 11 in Li2IrSi3, whereas (0) = 234 cm and RRR 1.3 in IrSi3. The marked reduction in (0) suggests that the absorbed lithium atoms donate a substantial number of charge carriers to Li2IrSi3. The decrease in resistivity can be seen at low temperatures in Fig. 3, suggesting the occurrence of superconductivity in Li2IrSi3. No superconductivity was observed down to 2 K in IrSi3, as shown in Fig. 3.
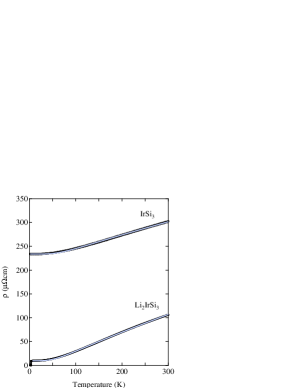
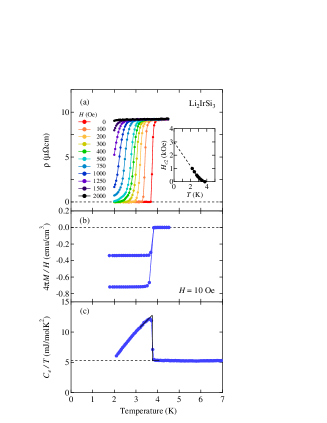
Figure 4(a) shows the low-temperature data for the electrical resistivity of Li2IrSi3. The resistivity decreases sharply below 3.9 K and becomes zero at 3.7 K. The 10–90% transition width was 0.1 K. The bulk superconductivity of Li2IrSi3 was evidenced by the temperature dependences of the magnetization and the specific heat , as shown in Figs. 4(b) and 4(c), respectively. exhibited a diamagnetic behavior below 3.8 K. The shielding and flux exclusion signals correspond to 72 and 34% of perfect diamagnetism, respectively. The electronic specific heat exhibited a clear jump at the superconducting transition. We estimated the superconducting transition temperature to be 3.75 K and the specific heat hump to be 7.4 mJ/(mol K2) by assuming the standard entropy conservation at .
As shown in Fig. 4(a), decreases with increasing magnetic field and decreases below 2 K at 0.2 T. The magnetic field dependence demonstrates that Li2IrSi3 is a type-II superconductor. The inset of Fig. 4(a) shows the temperature dependence of the upper critical field as determined from the midpoint of the resistive transition. exhibited an upward curvature with a visible change in the slope near = 3.8 K in the low-magnetic-field region. Thus, we tentatively estimated to be 0.3 T from a linear extrapolation of the data at low temperatures between 2.2 and 2.8 K. The Ginzburg–Landau coherence length was estimated to be 330 Å from = , where is the magnetic flux quantum. The small , which is comparable to those reported for the typical noncentrosymmetric silicide superconductors CaIrSi3 [14], CaPtSi3 [14], and SrAuSi3 [16], suggests a conventional superconducting state of Li2IrSi3. No spin triplet mixing can be anticipated because is considerably smaller than that expected from the Pauli limiting field, = 6.9 T, for the BCS weak coupling limit. Despite the low , the upward curvature of may be interesting because it suggests a multiband/multigap superconductivity in Li2IrSi3. Similar behavior has been observed in MgB2 [23, 24], YNi2B2C [25, 26], LaFeAsO0.89F0.11[27], and SrPtAs [28].
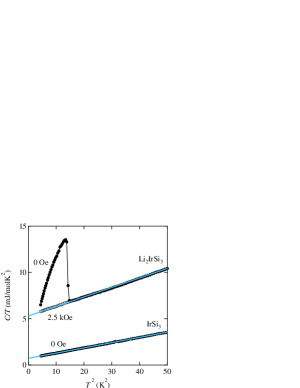
The absence and emergence of superconductivity in IrSi3 and Li2IrSi3, respectively, can partly be explained by the difference in the electronic density of states (DOS) at the Fermi level between the two compounds; the specific heat data exhibit a considerable increase in the DOS at the Fermi level with the lithium absorption of Li2IrSi3. The standard analysis of the normal-state specific heat, shown in Fig. 5, yielded the electronic specific heat coefficient = 0.73 mJ/(mol K2) and Debye temperature = 516 K for IrSi3, and = 5.3 mJ/(mol K2) and = 484 K for Li2IrSi3. Electronic exhibits a sevenfold increase, and phononic shows a small change from IrSi3 to Li2IrSi3, suggesting the major role of the increased and thus the electronic DOS at the Fermi level in the emergence of superconductivity. Using this estimated , we estimated to be 1.41 for Li2IrSi3, which is comparable to that of the BCS weak-coupling limit ( = 1.43), suggesting that Li2IrSi3 is a conventional phonon-mediated superconductor.
The presence of electron-phonon interactions can be anticipated from the temperature-dependent resistivity ( at low temperatures) for both IrSi3 and Li2IrSi3. As shown in Fig. 3, the data of both compounds can be well fitted using the phonon-assisted Bloch-Grüneisen formula:
| (1) |
| (2) |
where is the saturation resistivity; , the transport Debye temperature; and , a constant depending on the material. The least-squares fitting yielded = 397 and 330 K for IrSi3 and Li2IrSi3, respectively. The difference in is small, consistent with the thermally estimated , indicating that the difference between the phonon spectra of IrSi3 and Li2IrSi3 is small. This in turn supports the importance of the large DOS at the Fermi level for the occurrence of superconductivity.
Although no noticeable unique nature of superconductivity has been identified in the present thermodynamic and transport measurements of Li2IrSi3, further investigation will be worthwhile for examining a possible broken time-reversal symmetry in the superconducting state. A prototypical example could be SrPtAs ( = 2.4 K and = 0.2 T) with a locally noncentrosymmetric hexagonal structure [28]; SR measurements detected the emergence of a finite spontaneous magnetic field, indicative of a broken time-reversal symmetry, in the superconducting state of SrPtAs [29], for which a chiral -wave superconducting state has been proposed [30] although NMR measurements suggest conventional superconductivity [31]. Another example is Mg10Ir19B16 ( 5 K) with a noncentrosymmetric cubic structure [32], although no sign of a spontaneous magnetic field has been detected [33].
In conclusion, we identified that Li2IrSi3 crystallizes to a novel trigonal structure with the space group , which consists of an alternate stacking of planar silicon kagome planes and Li and Ir planes. The structure is weakly noncentrosymmetric owing to the displacement of kagome planes along the -axis and the staggered rotation of silicon triangles in the kagome planes. Superconductivity at 3.8 K was discovered in Li2IrSi3, although no superconductivity was detected in IrSi3, which is strongly polar noncentrosymmetric. Weakened inversion symmetry breaking, together with the increased electronic DOS at the Fermi level, plays a key role in the superconductivity of Li2IrSi3. Silicides exhibit various silicon networks – clathrates, honeycombs, hyper honeycombs, and pyrochlore – and the present Li2IrSi3 is another example of a silicon network, namely, a kagome network. This finding will help in further understanding the relationship between noncentrosymmetric crystal structures and electronic states of silicide superconductors.
Acknowledgements.
Part of this work was performed at the Advanced Science Research Center, Okayama University. The synchrotron radiation experiments were performed at SPring-8 with the approval of the Japan Synchrotron Radiation Research Institute (2012A1665). Research conducted at ORNL’s High Flux Isotope Reactor was sponsored by the Scientific User Facilities Division, Office of Basic Energy Sciences, US Department of Energy. This work was partially supported by the U.S.-Japan Collaborative Program on Neutron Scattering, Grants-in-Aid for Young Scientists (B) (24740238, 26820291, and 26800180), Creative Scientific Research (26106507), Scientific Research (B) (25287094 and 26287082), and (C) (25400372) from the Japan Society for the Promotion of Science (JSPS), and the Funding Program for World-Leading Innovative R&D on Science and Technology (FIRST Program) from JSPS.References
- [1] H. Kawaji, H. Horie, S. Yamanaka, and M. Ishikawa, Phys. Rev. Lett. 74, 1427 (1995).
- [2] S. Yamanaka, E. Enishi, H. Fukuoka, and M. Yasukawa, Inorg. Chem. 39, 56 (2000).
- [3] S. Sanfilippo, H. Elsinger, M. Núñez-Regueiro, O. Laborde, S. LeFloch, M. Affronte, G. L. Olcese, and A. Palenzona, Phys. Rev. B 61, R3800 (2000).
- [4] M. Imai, K. Hirata, and T. Hirano, Physica C 245, 12 (1995).
- [5] J. Evers, G. Oehlinger, and H. R. Ott, J. Less-Common Met. 69, 389 (1980).
- [6] M. Tanaka, S. Zhang, K. Inumaru, and S. Yamanaka, Inorg. Chem. 52, 6039 (2013).
- [7] G. F. Hardy and J. K. Hulm, Phys. Rev. 89, 884 (1953).
- [8] H. F. Braun, J. Less-Common Met. 100, 105 (1984).
- [9] L. P. Gor’kov and E. I. Rashba, Phys. Rev. Lett. 87, 037004 (2001).
- [10] P. A. Frigeri, D. F. Agterberg, A. Koga, and M. Sigrist, Phys. Rev. Lett. 92, 097001 (2004).
- [11] P. A. Frigeri, D. F. Agterberg, and M. Sigrist, New J. Phys. 6, 115 (2004).
- [12] E. Bauer, G. Hilscher, H. Michor, C. Paul, E. W. Scheidt, A. Gribanov, Y. Seropegin, H. Noël, M. Sigrist, and P. Rogl, Phys. Rev. Lett. 92, 027003 (2004).
- [13] N. Kimura, K. Ito, H. Aoki, S. Uji, and T. Terashima, Phys. Rev. Lett. 98, 197001 (2007).
- [14] G. Eguchi, D. C. Peets, M. Kriener, Y. Maeno, E. Nishibori, Y. Kumazawa, K. Banno, S. Maki, and H. Sawa, Phys. Rev. B 83, 024512 (2011).
- [15] E. Bauer, R. T. Khan, H. Michor, E. Royanian, A. Grytsiv, N. Melnychenko-Koblyuk, P. Rogl, D. Reith, R. Podloucky, E.-W. Scheidt, W. Wolf, and M. Marsman, Phys. Rev. B 80, 064504 (2009).
- [16] M. Isobe, H. Yoshida, K. Kimoto, M. Arai, and E. Takayama-Muromachi, Chem. Mater. 26, 2155 (2014).
- [17] M. Nishiyama, Y. Inada, and G.-q. Zheng, Phys. Rev. Lett. 98, 047002 (2007).
- [18] J. G. White and E. F. Hockings, Inorg. Chem. 10, 1934 (1971).
- [19] E. Nishibori, M. Takata, K. Kato, M. Sakata, Y. Kubota, S. Aoyagi, Y. Kuroiwa, M. Yamakata, and N. Ikeda, Nucl. Instrum. Meth. A 467-468, 1045 (2001).
- [20] F. Izumi and K. Momma, Solid State Phenom. 130, 15 (2007).
- [21] A. C. Larson and R. B. Von Dreele, “General Structure Analysis System (GSAS)”, Los Alamos National Laboratory Report LAUR 86-748 (2000).
- [22] B. H. Toby, J. Appl. Cryst. 34, 210 (2001).
- [23] A. Gurevich, Physica C 456, 160 (2007).
- [24] A. Gurevich, Phys. Rev. B 67, 184515 (2003).
- [25] M. Nohara, M. Isshiki, F. Sakai, and H. Takagi, J. Phys. Soc. Jpn. 68, 1078 (1999).
- [26] S. V. Shulga, S.-L. Drechsler, G. Fuchs, K.-H. Müller, K. Winzer, M. Heinecke, and K. Krug, Phys. Rev. Lett. 80, 1730 (1998).
- [27] F. Hunte, J. Jaroszynski, A. Gurevich, D. C. Larbalestier, R. Jin, A. S. Sefat, M. A. McGuire, B. C. Sales, D. K. Christen, and D. Mandrus, Nature (London) 453, 903 (2008).
- [28] Y. Nishikubo, K. Kudo, and M. Nohara, J. Phys. Soc. Jpn. 80, 055002 (2011).
- [29] P. K. Biswas, H. Luetkens, T. Neupert, T. Stürzer, C. Baines, G. Pascua, A. P. Schnyder, M. H. Fischer, J. Goryo, M. R. Lees, H. Maeter, F. Brückner, H.-H. Klauss, M. Nicklas, P. J. Baker, A. D. Hillier, M. Sigrist, A. Amato, and D. Johrendt, Phys. Rev. B 87, 180503(R) (2013).
- [30] M. H. Fischer, T. Neupert, C. Platt, A. P. Schnyder, W. Hanke, J. Goryo, R. Thomale, and M. Sigrist, Phys. Rev. B 89, 020509(R) (2014).
- [31] K. Matano, K. Arima, S. Maeda, Y. Nishikubo, K. Kudo, M. Nohara, and G.-q. Zheng, Phys. Rev. B 89, 140504(R) (2014).
- [32] T. Klimczuk, Q. Xu, E. Morosan, J. D. Thompson, H. W. Zandbergen, and R. J. Cava, Phys. Rev. B 74, 220502(R) (2006).
- [33] A. A. Aczel, T. J. Williams, T. Goko, J. P. Carlo, W. Yu, Y. J. Uemura, T. Klimczuk, J. D. Thompson, R. J. Cava, and G. M. Luke, Phys. Rev. B 82, 024520 (2010).