Quantitative patterns in drone wars
Abstract
Attacks by drones (i.e., unmanned combat air vehicles) continue to generate heated political and ethical debates. Here we examine the quantitative nature of drone attacks, focusing on how their intensity and frequency compare with that of other forms of human conflict. Instead of the power-law distribution found recently for insurgent and terrorist attacks, the severity of attacks is more akin to lognormal and exponential distributions, suggesting that the dynamics underlying drone attacks lie beyond these other forms of human conflict. We find that the pattern in the timing of attacks is consistent with one side having almost complete control, an important if expected result. We show that these novel features can be reproduced and understood using a generative mathematical model in which resource allocation to the dominant side is regulated through a feedback loop.
pacs:
89.65.-s,89.75.Da,89.75.Fb,89.75.-kIntroduction
Dating back to physicist L. F. Richardson’s pioneering work nearly 100 years ago Richardson (1948), the quantitative analysis of human conflict has attracted research interest from across the social, biological, economic, mathematical and physical sciences Morgenstern et al. (2013); Cederman (2003); Clauset et al. (2009, 2007); Bohorquez et al. (2009); Dedeo et al. (2011). As in a wide range of other human activities Barabási (2005); Gabaix et al. (2003), power laws have been identified in the severity distribution of individual attacks in insurgencies and terrorism Johnson et al. (2013); Clauset et al. (2009, 2007); Bohorquez et al. (2009), and in the temporal trend in events Johnson et al. (2013, 2011); Clauset et al. (2007). These studies found that across a diverse catalogue of insurgent wars in which a relatively small opponent such as an insurgency (Red Queen Johnson et al. (2011)) fights a larger one such as a state (Blue King Johnson et al. (2011)), the probability distribution for the severity —the number of fatalities—of an event (i.e., clash or attack) is given by where , while the trend in the timing of attacks is given by , where is the time interval between events and , and is the escalation parameter. When , the Blue King and Red Queen are evenly matched, with both effectively running on the same spot—hence the terminology surrounding the Red Queen Johnson et al. (2011). When , there is an escalation in the frequency of attacks which can be interpreted as a relative advantage between the Red Queen and the Blue King Johnson et al. (2011). The power-law finding for the distribution of event severities is consistent with the Red Queen (i.e., insurgent force) evolving dynamically as a self-organizing system composed of cells (i.e., clusters) that sporadically either fragment under the pressure of the Blue King (e.g., state) or coalesce to create larger cells, and taking the severity of attacks as proportional to the sizes of the resulting cells Bohorquez et al. (2009).
Here, we examine event patterns in the new form of human conflict offered by unmanned combat air vehicles (drones) Hall and Coyne (2013). We focus on Pakistan and Yemen because of their association with drone strike campaigns, using data from the New America Foundation and the South Asia Terrorism Portal databases. The situation of drone wars differs from the typical situation for insurgencies and terrorism in that the attacks are now carried out by the Blue King on the Red Queen. Moreover, the sophistication of the action-at-a-distance technology means that any delay in the Blue King’s next attack is likely to have come from a constraint within Blue itself (e.g., political opposition) as opposed to any direct counter-adaptation by the Red Queen. Our findings show that drone attacks tend to deviate from the universal patterns observed in the severity and timing for insurgencies and terrorism, and instead suggest a new regime in which the Blue King has almost complete control over the conflict. We develop a generative model in which the timing of attacks is determined solely by the resources of the Blue King, but are regulated by a positive feedback loop due to the Blue King’s internal sociopolitical and economic constraints. We show that this simple model reproduces the main features of the original data and hence the unique nature of drone warfare.
Results and Discussion
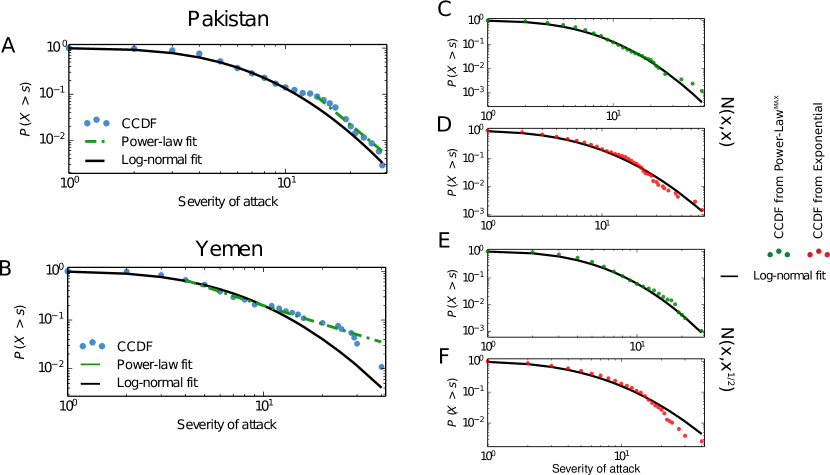
Figs. 1A–B show the complementary cumulative distribution function (CCDF) of the severity of drone attacks using the New America Foundation database. We fit power-law and lognormal distributions (dashed green and solid black lines respectively; see Methods) for attacks in Pakistan (Figs. 1A) and Yemen (Figs. 1B). We find that the severity of the strikes is approximately described by lognormal distributions, particularly in the case of Pakistan. In the case of Yemen, for which we have far less data, the lognormal is more tentative with the larger events deviating most. This finding of approximate log-normality is consistent with the notion that a drone has a specific design and targets (predominantly houses and vehicles) and hence a pre-determined order of magnitude of the range of destruction and likely severity. This contrasts with attacks by terrorist or insurgent clusters whose size and hence lethality crosses multiple scales, yielding scale-free (power-law) severity distributions.
In drone attacks, an approximate lognormal distribution can arise through at least two mechanisms: First, the fact that the severity of the attack is the result of many independent processes (e.g., successful reporting, good visibility, compact target group, etc.) will itself produce a lognormal distribution in the attack size. Second, if we take the uncertainty in the casualty number to scale with the target size, this also produce an approximate lognormal distribution for many underlying distributions of target sizes. For example, suppose attacks target the largest known or available Red group, drawn from a power-law distribution. Setting the mean and standard deviation of a zero-truncated normal distribution to this value then reproduces an approximate lognormal distribution (Figs. 1C). Similarly, we can imagine that most attacks target small groups, where the chances of civilian casualties are lower, and that the probability of targeting larger groups decreases exponentially. Setting the mean and standard deviation to a random value from a exponential distribution again yields an approximate lognormal distribution (Figs. 1D). The same pattern is recovered if the standard deviation is set to scale with the square root of the mean (Figs. 1E–F). We note that further reduction in the uncertainty of group size increases the weight of the underlying distribution. For the case where the largest known group is targeted, this can explain the fat tail observed for the Yemen data.
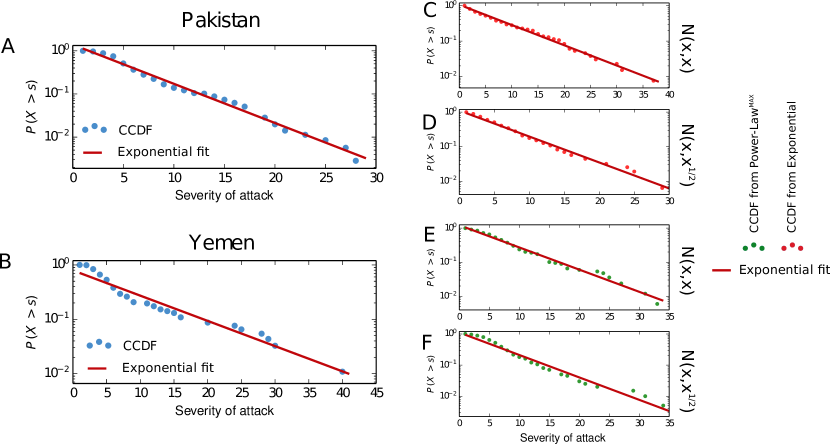
Although we have chosen to focus on fitting lognormal distributions as the alternative to power laws, other distributions can also provide good fits. For example, the data agrees well with an exponential distribution (see Fig. 2A–B). Scenarios where the size of the Red groups is exponentially distributed, as is the case if the probability of joining a group is constant and independent of the number of members, would naturally yield exponential distributions (Fig. 2C–D). Approximate exponential distributions can also be achieved if the groups are power-law distributed (Fig. 2E–F). Our purpose has not been to identify the best alternative to a power-law distribution, but to show that in contrast with conventional warfare and terrorism, the data does not follow a power-law distribution and hence feedback processes are not present across all scales.
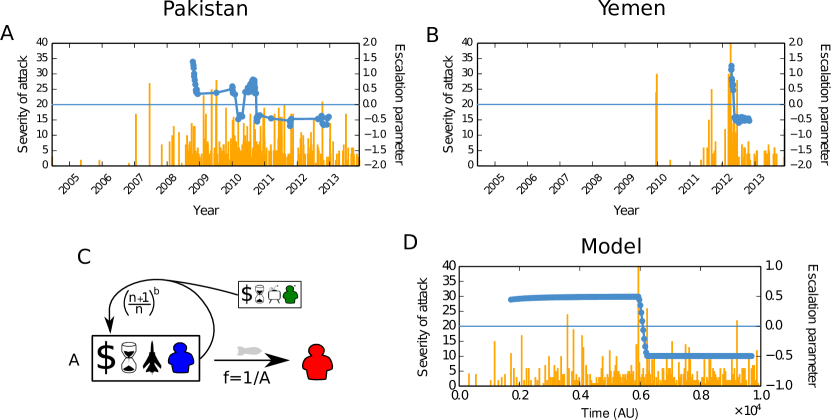
We now turn to the timing of attacks in order to gain insight into the temporal dynamics of the Blue King-versus-Red Queen activity. Following previous work Johnson et al. (2013), we plot the time interval between consecutive attacks as a function of the cardinal number of the attack . The escalation parameter is the exponent of the power-law fit , which will be the slope of the best-fit line on a double logarithmic plot. In the organizational development literature in which subsequent events are related to production, this is referred to as a development curve while in the psychology literature, where subsequent events correspond to completing a certain task, it is referred to as a learning curve Johnson et al. (2011). In this sense, the ‘production’ or ‘completion’ of drone attacks has a natural connection to human activity in these wider fields. For both Pakistan and Yemen, we find that the parameter fails to stabilize around zero (Figs. 3A–B), which is the expected value in a steady state where both sides are adapting well to the opponent’s advances. Instead, the drone attacks exhibit a large initial escalation (i.e., large positive ) which then transitions to a de-escalation (i.e., large negative ). Given the difficulty for a Red Queen without air defenses to thwart drone attacks directly, Figs. 3A–B suggest that one side (Blue King) effectively holds complete control for an extended period of time, and that some internal constraints then arise within the Blue King entity that eventually de-escalate drone attacks. This is consistent with the decrease in the escalation rate following the closure of a main drone base in 2011 Benjamin (2013). Even so, we note that there is some evidence of Red adaptation to Blue attacks as described in a recent report by “The Bureau of Investigative Journalism”, which shows a decrease in Red vehicle usage after 2011 corresponding to a peak in attacks on vehicles http://wherethedronesstrike.com/report/76. This suggests that the Red Queen may be able to limit the severity of attacks.
Fig. 3C shows our simple model for explaining these drone attack patterns. This model is of course over-simplified given the wealth of unknowns, yet we believe that it is a plausible first step in explaining the empirical observations. We regard the Blue King as possessing certain resources, for example experience, units, and funding. These resources degrade over time if no investment is made in the Blue King’s activity, i.e. if the government does not invest in its own drone development or information research. We assume that if there exists investment (i.e., funding, time, etc.) then the available resources increase due to a positive feedback loop, according to the escalation observed , where corresponds to the advantage of the Blue King over the Red Queen. Similar feedback loops have been proposed in models of conventional terrorism Clauset and Gleditsch (2012), and can be affected by external agents, for example public opinion or budget changes. For simplicity we take the frequency of attacks as directly proportional to the resource level, while the severity of the attack is independent of resources.
These minimal features are able to replicate the drone strike data (Figs. 1C–F,Figs. 1D. The results are achieved when the resources increase as a power-law—hence this is only sustainable for short periods of time. A constant , corresponding to the frequency of attacks decreasing continuously, is achieved if the resources decrease continuously, i.e. when there is little or no investment. Assuming that each drone acts individually, that the severity of attack varies slowly with the available resources (which is in turn consistent with some form of adaptation by the Red side) and that an increase in precision requires significant amounts of development effort, we are able to recreate approximate lognormal and exponential distributions for the severity of attacks.
In summary, our analysis reveals and helps explain patterns in the severity and timing of attacks in drone wars, which themselves represent a new form of action-at-a-distance human conflict. We have purposely stepped aside from issues of ethics or technology, choosing instead to focus on the event data since they represent a quantitative measure of drone war impact. We have shown that a simple model, in which the production of drones evolves from a shared pool of resources controlled by a feedback loop, is able to recreate the original data and therefore explain the overall dynamics of the Blue King’s drone campaign. Going forward, our model could be also used to explore how wars might unfold when drones are used by two or more sides in conflicts.
Methods
We obtained all data from the New America database: http://securitydata.newamerica.net/.newamerica.net/ and crosschecked with the South Asia Terrorism Portal database: http://www.satp.org/satporgtp/countries/pakistan/.
We obtained the best fit to power-law distributions following Clauset et al. Clauset et al. (2009). We fitted lognormal distributions using the maximum likelihood estimators. For the escalation rate analysis, , we plotted the number of attack vs. the time between attacks on a log-log scale. We used a rolling window of 50 attacks and accepted every value of that allowed for a correlation greater than 20%, which allows us to measure fast transitions.
We simulated 200 attacks with our model. The initial advantage was set to . The time to the next attack is equal to , where the 323 mimics for the Pakistan conflict. At every step (attack) the advantage of the Blue King changed by the factor , where is the attack number. For the first 50 attacks ; for the last 50 attacks .
Acknowledgements.
PSD was supported by NSF CAREER Grant No. 0846668.References
- Richardson (1948) L. F. Richardson, Journal of the American Statistical Association 43, 523 (1948).
- Morgenstern et al. (2013) A. P. Morgenstern, N. Velasquez, P. Manrique, Q. Hong, N. Johnson, and N. Johnson, American Journal of Physics 81, 805 (2013).
- Cederman (2003) L.-E. Cederman, American Political Science Review 97, 135 (2003).
- Clauset et al. (2009) A. Clauset, C. R. Shalizi, and M. E. J. Newman, SIAM Review 51, 661 (2009).
- Clauset et al. (2007) A. Clauset, M. Young, and K. Gleditsch, Journal of Conflict Resolution 51, 58 (2007).
- Bohorquez et al. (2009) J. C. Bohorquez, S. Gourley, A. R. Dixon, M. Spagat, and N. F. Johnson, Nature 462, 911 (2009).
- Dedeo et al. (2011) S. Dedeo, D. Krakauer, and J. Flack, Journal of the Royal Society Interface 8, 1260 (2011).
- Barabási (2005) A.-L. Barabási, Nature 435, 207 (2005).
- Gabaix et al. (2003) X. Gabaix, P. Gopikrishnan, V. Plerou, and H. E. Stanley, Nature 423, 267 (2003).
- Johnson et al. (2013) N. F. Johnson, P. Medina, G. Zhao, D. S. Messinger, J. Horgan, P. Gill, J. C. Bohorquez, W. Mattson, D. Gangi, H. Qi, P. Manrique, N. Velasquez, A. Morgenstern, E. Restrepo, N. Johnson, M. Spagat, and R. Zarama, Scientific Reports 3, 3463 (2013).
- Johnson et al. (2011) N. Johnson, S. Carran, J. Botner, K. Fontaine, N. Laxague, P. Nuetzel, J. Turnley, and B. Tivnan, Science Magazine 333, 81 (2011).
- Hall and Coyne (2013) A. R. Hall and C. J. Coyne, Defence and Peace Economics 25, 445 (2013).
- Benjamin (2013) M. Benjamin, Drone warfare: Killing by remote control (Verso Books, 2013).
- Clauset and Gleditsch (2012) A. Clauset and K. S. Gleditsch, PloS ONE 7, e48633 (2012).