Spectroscopy of 7 Radio-Loud QSOs at : Giant Lyman- Emission Nebulae Accreting onto Host Galaxies
Abstract
We performed long-slit optical spectroscopy (Gran Telescopio Canarias - Optical System for Imaging and low Resolution Integrated Spectroscopy) of 6 radio-loud QSOs at redshifts , known to have giant (–100 kpc) Lyman- emitting nebulae, and detect extended Lyman- emission for 4, with surface brightness ergs and line full width at half-maximum 400–1100 (mean 863) km . We also observed the radio-loud QSO, SDSS J2228+0110, and find evidence of a kpc extended Lyman- emission nebula, a new discovery for this high-redshift object.
Spatially-resolved kinematics of the 5 nebulae are examined by fitting the Lyman- wavelength at a series of positions along the slit. We found the line-of-sight velocity profiles to be relatively flat. However, 3 of the nebulae appear systematically redshifted by 250–460 km relative to the Lyman- line of the QSO (with no offset for the other two), which we argue is evidence for infall. One of these (Q0805+046) had a small ( km ) velocity shift across its diameter and a steep gradient at the centre. Differences in line-of-sight kinematics between these 5 giant nebulae and similar nebulae associated with high-redshift radio galaxies (which can show steep velocity gradients) may be due to an orientation effect, which brings infall/outflow rather than rotation into greater prominence for the sources observed ‘on-axis’ as QSOs.
keywords:
galaxies: active – galaxies: high redshift – quasars: emission lines – quasars: absorption lines – ISM: kinematics and dynamics1 Introduction
High redshift () QSOs (quasi-stellar objects) and other Active Galactic Nuclei (AGN) are of great importance in cosmology and the study of galaxy evolution, being the most luminous of all long-duration sources and hosted by the most massive galaxies existing at these redshifts. At the same redshifts, surrounding these powerful AGN or other very active galaxies, are found the uncommon and visually spectacular ‘Lyman- blobs’ or giant high-redshift Lyman- Nebulae (HzLAN). HzLAN typically extend over diameters to at least 120 kpc and emit most strongly in the Lyman- line (), with luminosities ergs , of the same order as the line emission from QSOs or massive starburst galaxies. As a class of sources they are diverse and may be powered by photoionization from intense bursts of star-formation, e.g. in galaxy mergers (Yajima, Li and Zhu 2013), AGN, or mixtures of both (e.g. Colbert et al. 2011).
Many of the largest and brightest HzLANs are associated with powerful high-redshift radio galaxies (HzRGs) (e.g. Ojik et al. 1997; Villar-Martín et al. 2003; Sánchez and Humphrey 2009) or radio-loud QSOs (e.g. Heckman et al. 1991a,b). In these cases, some Lyman- emission could have been shock-excited by the radio jets interacting with dense clouds (also triggering star-formation) (Bicknell et al. 2000). Indeed, there is much evidence to suggest that radio-mode feedback can have an important impact on the gas dynamics in HZRGs (e.g., Humphrey et al. 2006; Nesvadba et al. 2008). Detections of Lyman- polarization in two HzLAN (Hayes et al. 2011; Humphrey et al. 2013b) imply that some fraction of the Lyman- photons may be nuclear emission resonantly scattered by extended neutral hydrogen (HI), in addition to in-situ emission from the photoionized nebula.
Some radio-quiet AGN, both QSOs and type-2, at these redshifts also have (usually slightly less luminous) HzLANs (Christensen et al. 2006; Smith et al. 2009). Most known HzLAN are at , however the highest redshift examples are ‘Himiko’ at , now identified as a triple-galaxy merger undergoing starburst with (Ouchi et al. 2009, 2013), and the quasar CFHQSJ2329-301 (Willott et al. 2011).
Radio-loud (RL-) QSOs and HzRGs, according to the unified scheme of active galaxies, are essentially the same class of AGN viewed at different orientations: for the QSOs, along/near the radio axis, so the AGN is directly visible as an intense point-source; for the RGs, at a large or perpendicular angle, so the nucleus is obscured by a central torus but the radio jets are extended to either side. The orientation should have little or no effect on the visibility of a giant Lyman- nebula (in e.g. narrow-band imaging), as this is far larger than the AGN and torus structure.
Heckman et al. (1991a, hereafter H91) obtained Lyman- and broad-band imaging on a sample of 18 RL-QSOs at and found 15 to have extended Lyman- emission from nebulae, with diameters arcsec kpc, surface brightness ergs , fluxes to ergs , and hence ergs , clearly putting them in the class of HzLAN. As these galaxies are QSOs, their total UV flux is dominated by the central point-source, but the HzLANs were bright enough to contribute – in Lyman-. Although some HzLAN were too round to define a position angle, for most the long axis was aligned within deg of the radio axis, with the brightest Lyman- and radio emission coinciding (on the same side of the AGN). Heckman et al. (1991b) took long-slit optical spectroscopy (with the Kitt Peak National Observatory 4m Mayall telescope) for 5 of the H91 RL-QSOs, and found the nebular Lyman- lines to have large velocity dispersions of –1500 km ; they did not detect velocity gradients across the nebulae, but their relatively low spectral resolution of would not have well-constrained this.
Van Ojik et al. (1997) obtained higher-resolution long-slit spectra of 17 HzRGs and one RL-QSO with extended Lyman- emission (2–17 arcsec) at . The majority (11) were found to show one or more narrow absorption lines within the broader (–1600 km ) Lyman- emission. These narrow, strong absorption lines in most cases covered the whole spatial extent of the nebula, with only small velocity offsets from the QSO emission (mostly km ), implying the absorbing structures were large and physically associated with the radio galaxies. Binette et al. (2000) proposed that absorption seen in both Lyman- and CIV in a HzRG spectrum was caused by a large shell of low-metallicity and low-density gas, even further out from the galaxy than the emitting nebula and the radio jets, perhaps a vestige from galaxy formation and predating the AGN activity. Humphrey et al. (2008), with integral-field and long-slit spectroscopy of another HzRG at , found a double set of absorption lines at large blueshifts and 2000 km , in Lyman- and several other lines such as SiIV(1393,1402), again covering the whole emission nebula.
Villar-Martín et al. (2003), using long-slit spectroscopy (Keck-Low Resolution Imaging Spectrometer, ) of 10 radio galaxies at , found the spectra of the giant nebulae to show, in addition to the strong Lyman-, HeII1640 and in some cases CIV1550 and/or NV1240 emission lines. These nebula lines showed relatively moderate velocity dispersions (–800 km ), and in most cases significant velocity shifts of a few hundred km across the kpc nebula diameter. The nebulae were described as ‘halos of kinematically quiescent gas’, and as ‘a common ingredient of high redshift radio galaxies’.
Integral-field spectroscopy (Very Large Telescope - Visible Multi Object Spectrograph, VLT-VIMOS) of three radio galaxies (Villar-Martín et al. 2007) found the nebular Lyman- emission to be aligned with the radio axes, and in two examples double-peaked, with radial-velocity offsets between the components of a few hundred km (suggestive of rotating systems), while in the third HzLAN the centre was redshifted relative to the edges (a pattern suggestive of infall). Humphrey at al. (2007) described an interesting correlation seen in almost all radio galaxies with HzLAN – the more redshifted side of the nebula is the brighter in both Lyman- and radio flux. The interpretation was that this was the near-side relative to the observer – so here the radio jet is approaching and is Doppler-boosted while the Lyman- is less obscured. The relative redshift of the near side would then imply the emitting nebula has a significant component of infall towards the nucleus (whether or not it is also rotating about it). Adams, Hill and MacQueen (2009) fit their observations of a bimodal Lyman- profile in one RG with a somewhat similar model of an photoionized bicone within a massive, infalling and resonantly scattering HI halo. Sánchez and Humphrey (2009), with integral-field spectroscopy, found two more HzRG giant nebulae to emit in CIV and HeII1640 as well as Lyman- (confirming the gas is photoionized by the obscured AGN); one (4C+40.36) showed a rather extreme velocity gradient, km across the nebula, which is more than expected from rotation alone and most easily explained by infall/outflow.
Humphrey et al (2013) observed the one RL-QSO/HzLAN in the van Ojik et al. (1997) sample, TXS1436+157 at , with the new OSIRIS long-slit spectrograph on the 10.4m Gran Telescopio Canarias (GTC). The choice of QSO rather than radio galaxy was motivated by the direct view of the intense AGN light against which absorption would more sensitively be revealed, and also for a comparison of RL-QSO nebulae with HzRGs – if the nebulae are aligned with the radio axes, the different orientation of these two classes of source is likely to influence how the internal velocity structure of the nebula appears when viewed along the line-of sight as an emission-line velocity map. For TXS1436+157 a strong absorption line is seen within the broader Lyman- emission, mildly blueshifted ( km ) and partially absorbing over the whole nebula. This was interpreted as a large (radius kpc) and massive () shell of hydrogen (with small amounts of heavy elements), formed where an expanding super bubble of hot gas, driven outward by supernovae following a starburst in the central galaxy, encounters and sweeps up a low-metallicity intergalactic medium (expanding superbubbles around radio galaxies have also been seen in [OIII]5007 emission; Humphrey et al. 2009). In contrast, the HzLAN in TXS1436+157 is slightly redshifted (110 km ) relative to the AGN, suggesting infall.
Further GTC-OSIRIS long-slit spectroscopy was proposed, targeting a larger sample of RL-QSOs from H91, to study at spectral resolution both the extended Lyman- emission and intrinsic absorbers. So far we have observed 6 of these galaxies, and present the first results in this paper. Additionally we observed at similar resolution a much fainter RL-QSO, one of the most distant known, discovered by Zeimann et al. (2011) at .
Section 2 of this paper lists the observed galaxies, and describes the observations and data reduction. Section 3 presents our spectra for the 7 RL-QSOs and extended nebulae. Section 4 is a further analysis of the spatially-resolved kinematics of the nebulae, using the Lyman- profiles. Our findings are discussed and compared with previous observations of radio galaxies and QSOs in Section 5, and finally Section 6 summarizes the main conclusions.
Magnitudes are given in the AB system where log (in ergs ). We assume throughout a spatially flat cosmology with km , and , for which the age of the Universe is 13.86 Gyr and 1 arcsec is (8.596,7.942,5.916) kpc at z=(2,3,6).
2 Data
2.1 Sample
Our spectroscopy sample consists of 6 of the H91 RL-QSOs already known to have giant nebulae, plus the QSO SDSS J22280110 (Zeimann et al. 2011), discovered in the Sloan Digital Sky Survey (SDSS) deep Stripe 82 (matched with a VLA radio survey). It is much fainter than the first six ( compared to ), and like almost all QSOs has a strong Lyman- emission line, but little else is known. Table 1 lists the 7 targets, with positions and redshifts.
The H91 RL-QSOs were originally selected from a larger sample of 105 QSOs observed by Barthel et al. (1988) in the radio (6cm/4.9GHz) with the Very Large Array (VLA), giving 0.5-arcsec resolution radio maps. The distant SDSSJ2228+0110 has only a single, much fainter, flux measurement of 0.31mJy at 1.4 GHz (Zeimann et al. 2011), but this is still sufficient to be defined as a RL-QSO with a radio loudness index .
The Heckman et al. (1991b) optical spectroscopy of 5 of the H91 QSOs included two of our sample, Q0758+120 and Q0805+046. Using parallel apertures, they extract separate spectra (with a relatively low resolution ) for both AGN and the associated nebulae. We shall compare our results, and with the higher-resolution OSIRIS observations will be able more sensitively characterise the kinematics. Also Lehnert and Becker (1998) took long-slit Keck spectroscopy of Q2338+042 and its nebula. Lehnert et al. (1999) imaged 5 RL-QSOs, including Q1658+575 and Q2338+042, with HST WFPC2 in the broad-band F555W and in narrow rest frame Lyman- bands, which showed the brighter regions of the nebulae at much higher resolution.
2.2 GTC-OSIRIS Observations
The observations presented here were all obtained using OSIRIS (Optical System for Imaging and low Resolution Integrated Spectroscopy) on the 10.4m GTC as part of observing proposals GTC3-11AMEX (May/June/July 2011) and GTC2-11BMEX (October 2011). Table 1 details the observations, which were taken in service mode. The instrument was operated in long-slit spectroscopy mode with 100 kHz CCD readout (see OSIRIS manual). The VPH(volume-phased holographic) gratings were chosen to best observe Lyman- at the galaxy redshift with sufficient spectral resolution (the grating numbers refer to lines/mm): R2500U covers 3440–4610 with resolution , R2000B covers 3950– with , and R2500I covers 7330– with . Observations for galaxies Q1658+575 and Q2338+042 were flagged as ‘attempted’ by the instrument operator indicating observing conditions were to some degree non-optimal.
| QSO | R.A. | Dec | Redshift | Date obs. | Total | Grating | PA | width | seeing | |
|---|---|---|---|---|---|---|---|---|---|---|
| (NED) | (2011) | (sec) | deg | arcsec | arcsec | |||||
| Q1354+258 | 209.276879 | 25.624711 | 2.0013 | 27 Jul | 2436 | 3 | R2500U | -45 | 1.0 | 1.0 |
| Q1658+575 | 254.940530 | 57.525565 | 2.173 | 5 May/2 Jun | 4060 | 5 | R2500U | 20 | 1.0 | 1.2 |
| Q0758+120 | 120.252016 | 11.889886 | 2.6716 | 23/24 Oct | 3200 | 4 | R2000B | -55 | 0.8 | 1.2 |
| Q0805+046 | 121.9897438 | 4.5429253 | 2.877 | 25 Oct | 2400 | 3 | R2000B | -55 | 0.8 | 1.0 |
| Q2338+042 | 355.2415218 | 4.5210618 | 2.594 | 29 Oct | 2400 | 3 | R2000B | -50 | 0.8 | 1.3 |
| Q2222+051 | 336.311068 | 5.452616 | 2.323 | 3 Jun | 2436 | 3 | R2000B | 35 | 0.8 | 1.2 |
| J2228+0110 | 337.181250 | 1.175611 | 5.95 | 23 Jul | 2340 | 3 | R2500I | -52 | 0.6 | 0.8 |
2.3 Data Reduction
Data reduction was carried out using the standard IRAF package. With OSIRIS operated in pixel binning, each spatial pixel in our data is 0.254 arcsec, and the spectral dispersion is (0.62,0.86,1.36) for (R2500U, R2000B, and R2500I ). Firstly, bias frames (median combined for each night) were subtracted from all images. Flat fields (using dome and lamp), were combined to a single flat for each night, normalized to a mean of unity by dividing out by a fit to the spectral-axis dependence, using IRAF ‘flat1d’). After flat-fielding and, where necessary, spatial registration, the 3, 4 or 5 exposures for each object were combined (with IRAF ‘crrej’ cosmic ray removal), wavelength calibrated using the arc lamp spectra, and rebinned to a linear wavelength scale. The sky background and lines were subtracted (using IRAF ‘background’). Contemporaneous exposures on spectrophotometric standard stars (Ross 640, Feige 110, G157-34, or Feige 34) were processed in the same way to obtain spectra, and, with standard IRAF techniques, define sensitivity functions for each of the observed targets. Each spectrum could then be flux-calibrated in , units ergs . We correct for Galactic reddening using IRAF ‘deredden’ and the Galactic values from the NED database (‘New Landolt’), which in the order of Table 1 are magnitudes.
One-dimensional spectra were extracted (using IRAF ‘apall’) from the 2D spectra. These spectra, in apertures fitted to the peaks in flux, will essentially be for the AGN and host galaxies. For associated extended nebulae visible on the 2D spectra, we also extract 1D spectra in parallel (close but not overlapping) apertures.
3 Results
(a)
![[Uncaptioned image]](/html/1407.4046/assets/x1.png)
![[Uncaptioned image]](/html/1407.4046/assets/x2.png)
![[Uncaptioned image]](/html/1407.4046/assets/x3.png)
![[Uncaptioned image]](/html/1407.4046/assets/x4.png)
![[Uncaptioned image]](/html/1407.4046/assets/x5.png)
![[Uncaptioned image]](/html/1407.4046/assets/x6.png)
![[Uncaptioned image]](/html/1407.4046/assets/x7.png)
![[Uncaptioned image]](/html/1407.4046/assets/x8.png)
![[Uncaptioned image]](/html/1407.4046/assets/x9.png)
![[Uncaptioned image]](/html/1407.4046/assets/x10.png)
(b)
(c)
(d)
(e)
(f)
(g)
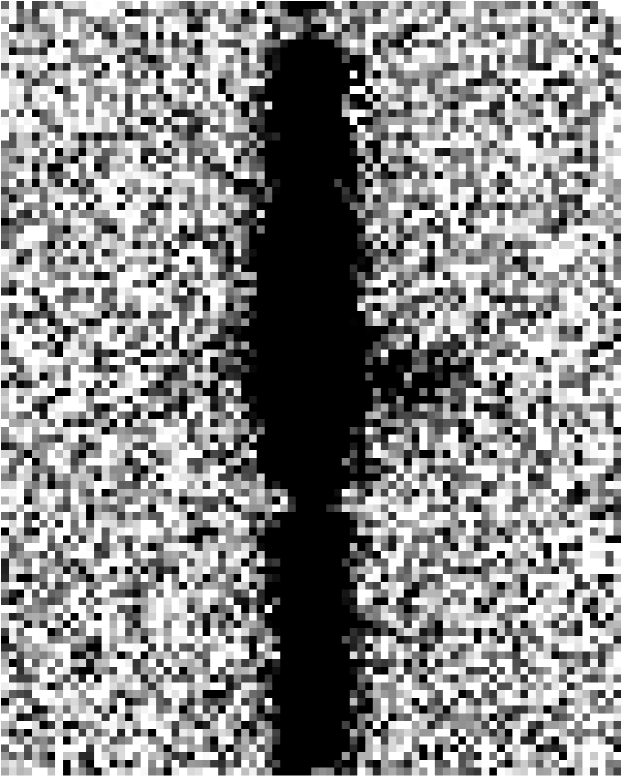
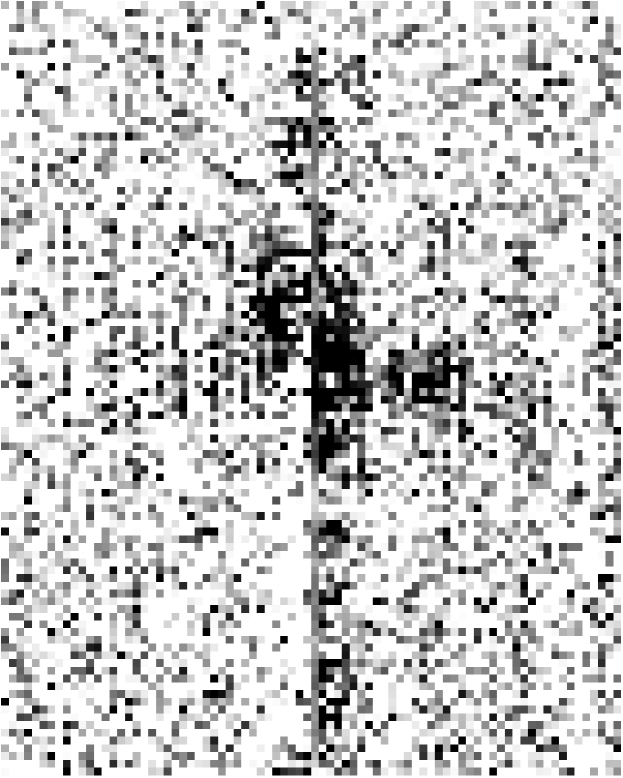
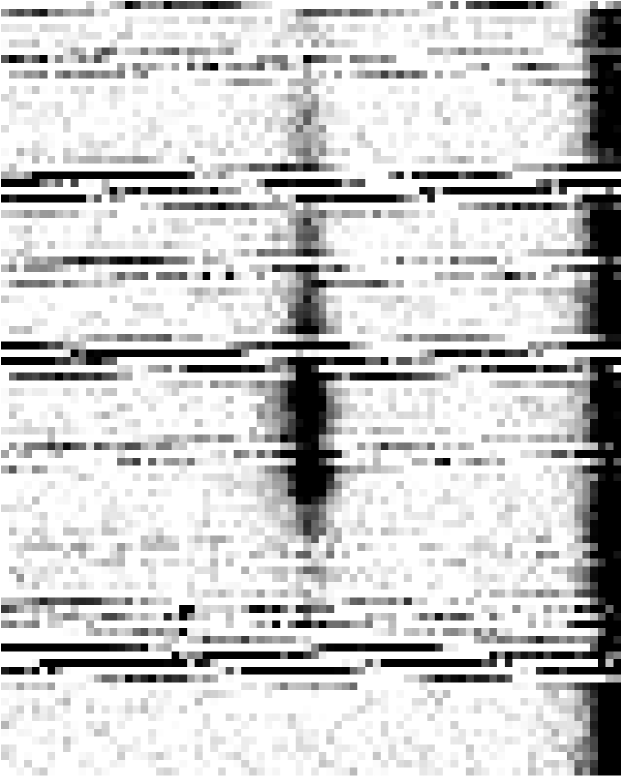
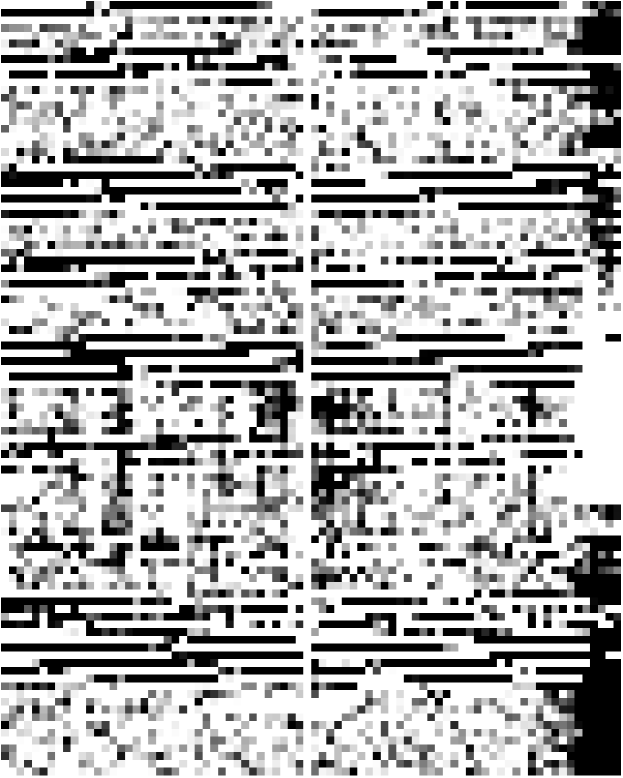
Firstly, a strong Lyman- emission line is seen on all 7 of the quasar spectra. Fig 1 shows the Lyman- regions of the 2D spectra. In addition, we measure the QSO spectrum PSF in spectral regions slightly blueward and redward of the Lyman-, and multiply this by the central ‘ridge’ of the spectrum, to give a 2D spectrum representing the QSO and host galaxy only. This is then subtracted from the observed 2D spectrum, to leave only the extended emission from the nebula (where present), which is shown in the right panels of Fig 1. There is visible evidence of HzLAN, with the Lyman- emission extending up to several arcsec outside the galaxy spectrum, in five cases (Q1658+575, Q0758+120, Q0805+046, Q2222+051 and probably SDSSJ2228+0110). In this section we examine in turn the extracted 1D spectra of both the galaxies/AGN and nebulae. We fit the Lyman- lines with a Gaussian on a continuum-subtracted (by fitting high-order spline function) spectrum and, as there are no strong and narrow emission lines (e.g. HeII1640) within our relatively narrow wavelength ranges, use the QSO Lyman- wavelength to define the velocity centre of each galaxy.
3.1 Q1354+258
This is the lowest redshift galaxy in our sample and the Lyman- emission line (we fit giving ) is at the far blue end of the spectrograph’s range where the sensitivity falls off. Even so the line is strongly detected; we measure an integrated flux ergs . We could not see extended line emission, but with the relatively low sensitivity at this near-UV wavelength the uncertainty on this is large, ergs . In comparison the mean surface brightness of the extended emission detected by H91, ergs . Our non-detection might suggest our choice of slit PA was not optimal for this one source (H91 found the most extended emission to the south).
The spectrum of the galaxy/QSO (Fig 2) shows no less than four strong (observer-frame equivalent width ) absorption lines within the broad Lyman- emission line. These could be HI structures or shells associated with the QSO host galaxy, but distinct from each other as they are spread over km in velocity, with the first two blueshifted relative to the peak emission. We detect intrinsic absorption lines for the NV(1238,1242) and SiIV(1393,1402) doublets, which all match the redshift of the second HI absorber. CIV(1548,1550) is redward of our spectrograph range, but this QSO was also observed in the SDSS Baryon Oscillation Spectroscopic Survey (BOSS) (with identifier SDSS J135706.53+253724.4) and the SDSS spectrum (covering a redder range) shows a CIV absorption doublet within the broad CIV emission, again with about the same redshift and (-444 km ) as the second HI absorber.
There are other absorption lines which do not match the wavelengths of any expected intrinsic lines, and are probably lower redshift galaxies on the line of sight (using the doublet ratios we identity one MgII and two CIV absorbers); these are outside the scope of this paper and not discussed further. See Section 6 for tabulated wavelength and other data for identified intrinsic and line-of-sight absorbers.

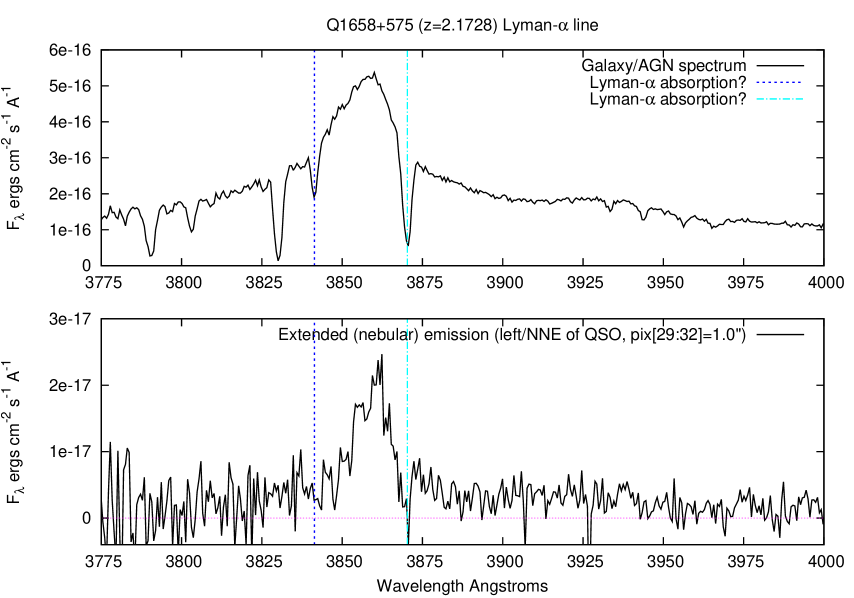
3.2 Q1658+575
The two observing blocks for this galaxy were flagged as ‘attempted’, due to presence of some clouds, but this seemed to have affected seriously only the first exposure (observing log: ‘primer espectro muy debil’), and combining the remaining 5 produced an apparently good quality spectrum (Fig 3). The galaxy/QSO shows a strong Lyman- emission line, we fit , giving , a flux ergs and a FWHM km .
There is broad emission at from SiII1304, and at from SiIV, consistent with the Lyman- redshift. Blueward are many Lyman- forest lines, of which one is close enough ( km ) to the Lyman- peak it could be an intrinsic HI absorber, and there is a stronger absorption line at about the same redward.

On the 2D spectrum, the Lyman- emission visibly extends on the left (NNE) side of the AGN, but only for 1–2 arcsec (9–17 kpc), in agreement with the WFPC2 imaging of Lehnert et al. (1999) which showed the brightest nebular emission extending in a broad plume 1–2 arcsec to the NE (it then curves to the north). This is sufficient to extract a spectrum for the HzLAN (with minimal contamination from the AGN) in a separate, parallel, narrow (4 pixels wide = 1 arcsec) aperture.
Figure 4 compares the nebula and galaxy/QSO spectra in the region of Lyman-. For the nebula we see emission only in Lyman-, and fit this with (redshifted by km relative to the AGN emission line), km , narrower than the AGN line), and flux ergs .
A question of interest is whether the two absorption lines in the blue and red wings of the AGN Lyman- emission line also absorb the nebular emission, as this would confirm the absorber as both intrinsic and extended (i.e. bigger than the nebula; kpc). Indeed on our nebula spectrum there is some sign of an absorption line (we fit with EW ) at the same wavelength as the line in the QSO spectrum, but this remains inconclusive from these data due to the narrower emission profile of the nebula.
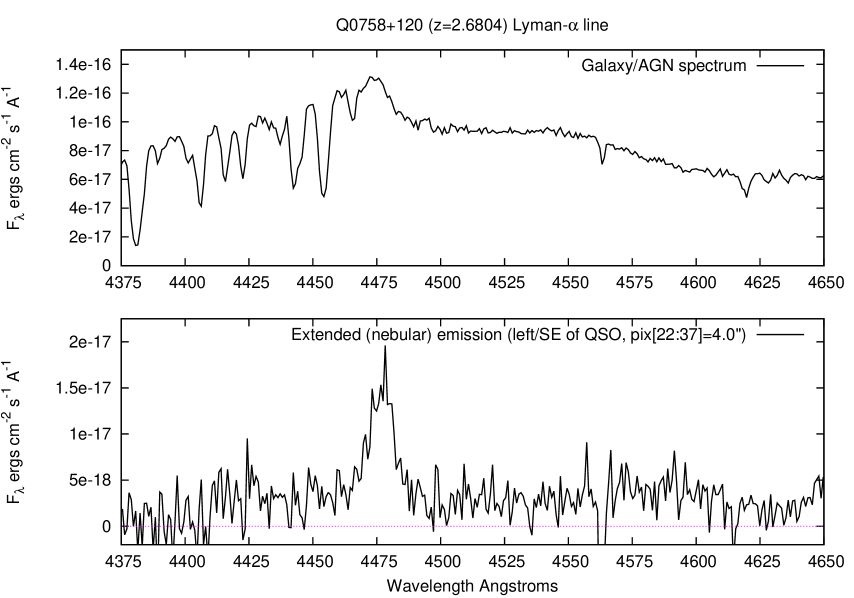
3.3 Q0758+120
The galaxy/AGN spectrum (Fig 5) shows a Lyman- line with a sharp peak; we fit , giving , a flux ergs and a FWHM of km . There are many ‘forest’ absorption lines in the blue wing of Lyman- and one is close enough to the peak it could be intrinsic. There is broad emission from CII1334 at and SiIV at , giving the same redshift .

On the 2D spectrum, extended Lyman- emission is visible, almost all on the left side (SE), where it extends to some 26 pixels= 6.6 arcsec (54 kpc) from the nucleus (H91 also found this HzLAN to be large). A spectrum of the nebula was extracted, isolated from the AGN’s, in a separate aperture of width 16 pixels = 4.0 arcsec (there is no obvious velocity shift across this distance). This spectrum (Fig 6) shows emission only in Lyman- (HeII1640 will be out of the spectrograph range); we fit with , a flux ergs , and FWHM km . The nebular emission line is again less broad than the AGN’s, and redshifted by km .
This QSO was previously observed spectroscopically (at lower resolution) by Heckman et al. (1991b), who found the Q0758+120 nebula spectrum dominated by the Lyman- line with ergs (through slit), , km , and km relative to the QSO.
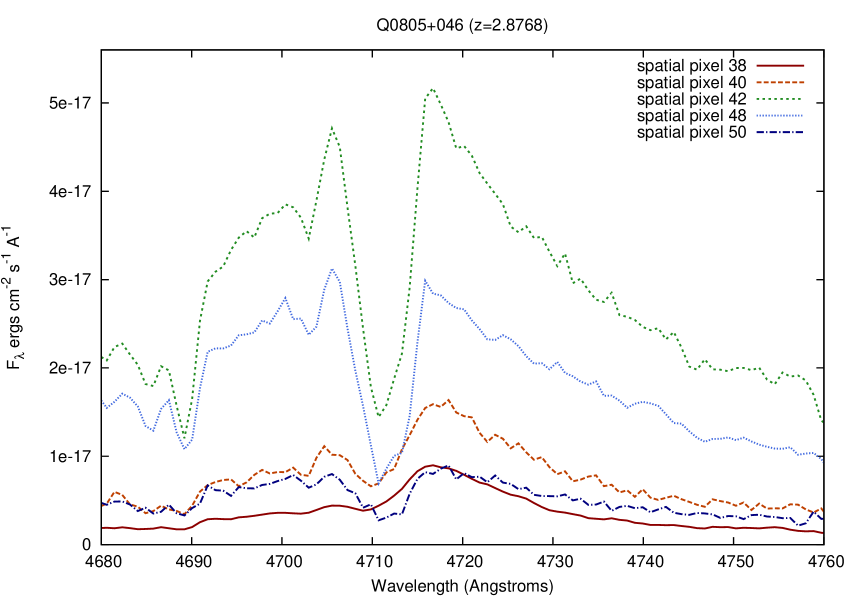
3.4 Q0805+046
The spectrum (Fig 7) is dominated by strong Lyman- emission; we fit giving , flux ergs (the brightest of any QSO in this sample) and a very broad FWHM km . The most obvious feature is a huge absorption line neatly bisecting the quasar’s Lyman-. Blueward of this, there are many ‘Lyman- forest’ absorption lines, redward, one absorption doublet is identified as intrinsic NV, others as metal lines from lower redshift galaxies. A broad emission feature at could be SiII1304 at the QSO redshift .
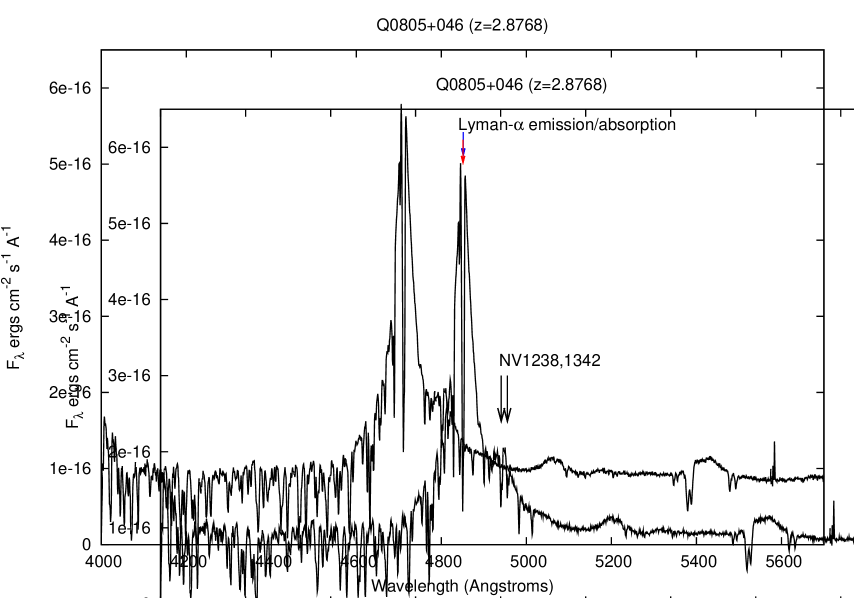
The 2D spectrum shows extended Lyman- emission, visible on both sides of the QSO, and spanning as much as arcsec (72 kpc), with greater brightness and extension on the left (SE) side. H91 found this to be the largest and brightest nebula in their sample, similarly with ‘the bulk of the high surface brightness emission arising from the SE side of the QSO)’. We extract the nebular spectrum in two strips, one of width 13 pixels (3.3 arcsec) on the left, the other a 10 pixel aperture (2.5 arcsec) on the right/NW. Both (Fig 8) show a single Lyman- emission line, at about the same wavelengths as the half of the QSO line redwards of the bisecting absorption. For the SE side nebula we fit , flux ergs and FWHM km , and for the NW side line, , flux ergs and FWHM km .
Thus again the nebular line, on both sides, is less broad than, and redshifted with respect to, the QSO line; with (SE) and km (NW). The blue edge of the nebular emission is near the wavelength of the strong absorption line, but on Figure 8 there is still some nebular flux at the line centre, so the absorber likely has a smaller covering factor for the nebula than for the AGN.
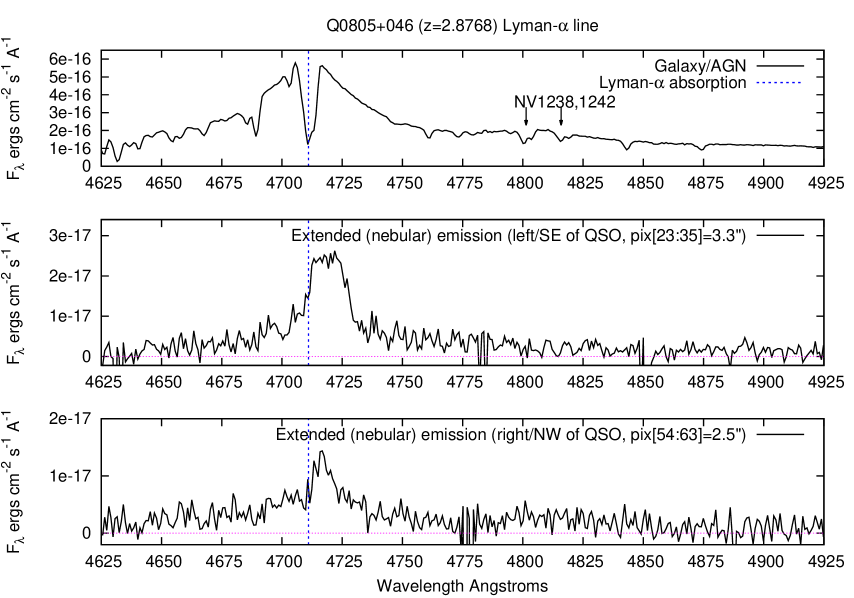
Heckman et al. (1991b) obtained a spectrum for this nebula and measured a Lyman- flux ergs , and a velocity offset km . They also detect a weak (7% strength of Lyman-) narrow CIV emission line, which cannot be verified here as it falls redward of our spectrograph range. For this and the previous QSO, the through-slit fluxes of Heckman et al. (1991b) are dex higher than ours, simply because they sample larger areas of the nebulae, due to their wider slit (1.5 compared to 0.8 arcsec) and our cautious (i.e. well away from AGN) choice of apertures. Their kinematic measurements and ours are consistent within the uncertainties.
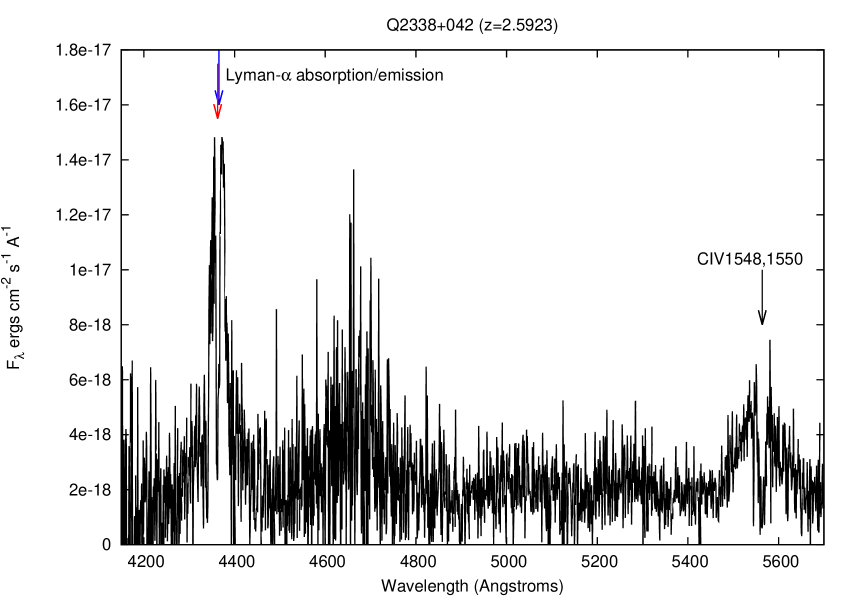
3.5 Q2338+042
This observing block was flagged as ‘attempted’ due to unspecified bad conditions and indeed all our spectra appear very faint. We combine the 3 exposures to obtain the spectrum on Fig 9. The flux and signal-to-noise are low compared to all the other H91 targets, suggesting there was significant cloud. Even so, the Lyman- emission line is clearly visible, split in half by a very strong (saturated) absorption line. For the emission we fit , giving , an integrated flux ergs (only 2% the previous object!) and FWHM km . The other feature of note is strong and broad CIV emission, again bisected by a strong absorption line (probably from the same absorber) in which saturation has merged the two components of the 1548,1550 doublet.
On the 2D image we cannot see extended emission and, due to poor signal-to-noise and very non-photometric conditions, cannot even give a lower limit on this. Extended Lyman- emission was previously detected here by H91, with a NW/SE orientation, and again by Lehnert and Becker (1998) in Keck spectroscopy and by Lehnert et al. (1999) in HST narrowband imaging. On this basis our slit angle ( W of N) was correct and the non-detection can probably be blamed on poor conditions.
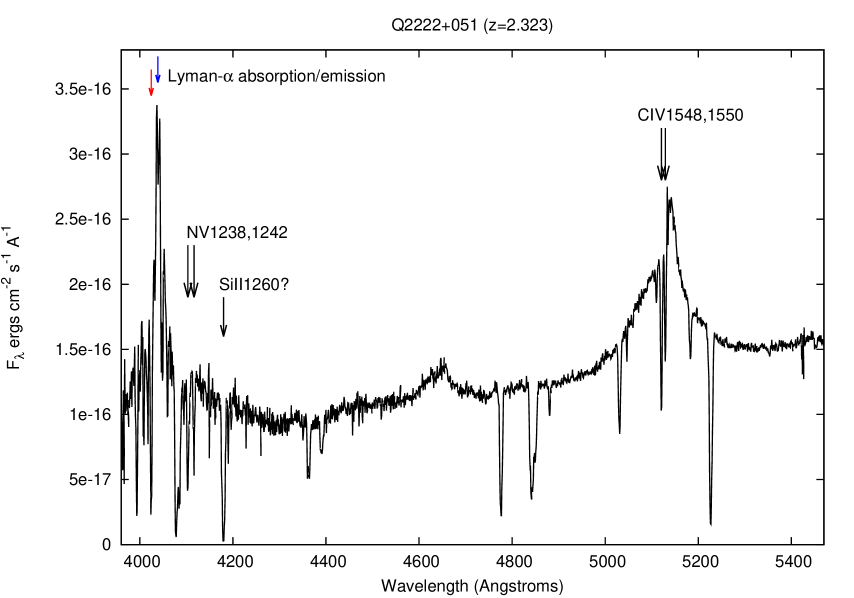
3.6 Q2222+051
The galaxy/QSO spectrum (Fig 10) shows strong Lyman- emission – we fit , giving , flux ergs and FWHM km . The CIV emission peak is also very prominent – we fit () and a flux – giving a high CIV/Ly ratio of , and the continuum is redder than the other QSOs (despite our correction for the strong Galactic reddening which had reduced the flux by at the blue end).
We identify one single strong absorption line as probably intrinsic SiII1260. The absorption line in the blue wing of the Lyman- emission, together with the strong NV and CIV doublets, are likely intrinsic, but very blueshifted km . It is also possible that the blueshifted absorption is produced by a neighbouring galaxy, such as the large disk galaxy ‘4C 05.84 ER1’ observed by Stockton et al. (2008) using NICMOS, arcsec W of the QSO and (on the basis of photometry) at the same redshift, with a massive () and old ( Gyr) stellar population.
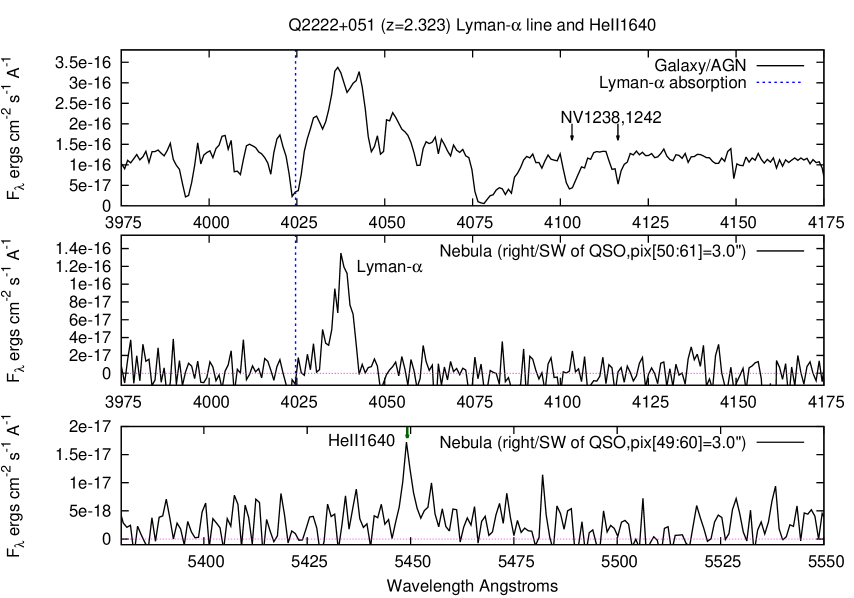
On the 2D spectrum, extended emission is clearly visible, almost all on the right (SW or SSW) of the AGN spectrum, where is extends to at least 5 arcsec (42 kpc) from the nucleus (H91 similarly reported ‘the brightest and most extended emission to the SSW’). There is also at least a hint of much fainter emission extending for about 1 arcsec on the left (NE), but the signal-to-noise was too poor to extract a useful spectrum here. Hence we extract the nebular spectrum on the right of the AGN, in a 12 pixel (3.0 arcsec) aperture (Fig 11). It shows Lyman-, with , FWHM of km and a flux ergs . Again the nebula Lyman- line is narrower than the QSO’s, but in this case it is not redshifted with respect to it, with km . In this aperture we also find a much fainter emission line at , matching closely the expected wavelength for HeII1640, for the Lyman- redshift of either the QSO (formally, with km ) or the nebula. In the 3.0 arcsec aperture we measure the HeII1640 flux as ergs , giving the Lyman-/HeII ratio here as , in the same range as for the nebula of TXS1436+157 (Humphrey et al. 2013) and for the radio galaxy 4C40.36 (Sanchez and Humphrey 2009). These ratios are all consistent with AGN photoionization as the primary source of Lyman-, with or without a smaller contribution from star-formation. The HeII line is very narrow with km , shows no significant velocity gradient within the 3 arcsec aperture, and is not seen at all outside of this aperture, not even in the QSO spectrum. HeII emission might be associated only with the brightest radio hotspot, 2–3 arcsec SW of the nucleus.
3.7 SDSSJ2228+0110
We also observed the much fainter QSO, SDSSJ2228+0110, using the R2500I grating. Inevitably, the signal-to-noise is poorer than for the H91 sources, furthermore the Lyman- line is redshifted into a region of the near-infrared with a high sky background and many sky lines, adding to the noise. The spectrum (Fig 11) shows broad Lyman- emission in the midst of narrower bands of noise from the sky, with the continuum visible redwards of the line. Immediately blueward, there is a sharp break to a near-zero flux, as expected (due to absorption from the intergalactic medium) for all sources at this high redshift (e.g. Roche et al. 2012).
For the Lyman- line we fit giving , a flux ergs and FWHM km . The peak of the line appears to be split by a possible absorption line with and . If genuine it would be slightly blueshifted – km . Two brighter objects happened to fall on our spectrograph slit and neither of their spectra show an absorption feature at this wavelength, implying it is intrinsic to the QSO, but sky lines increase the noise here and more data is needed to confirm this. There may be weaker broad emission at NV1238,1242. Zeimann et al. (2011), from their Keck LRIS spectrum, measure a slightly broader FWHM 1890 km for the Lyman-, and a rest-frame (i.e. divided by ) EW of ; we agree, finding ( they do not mention any absorption line).
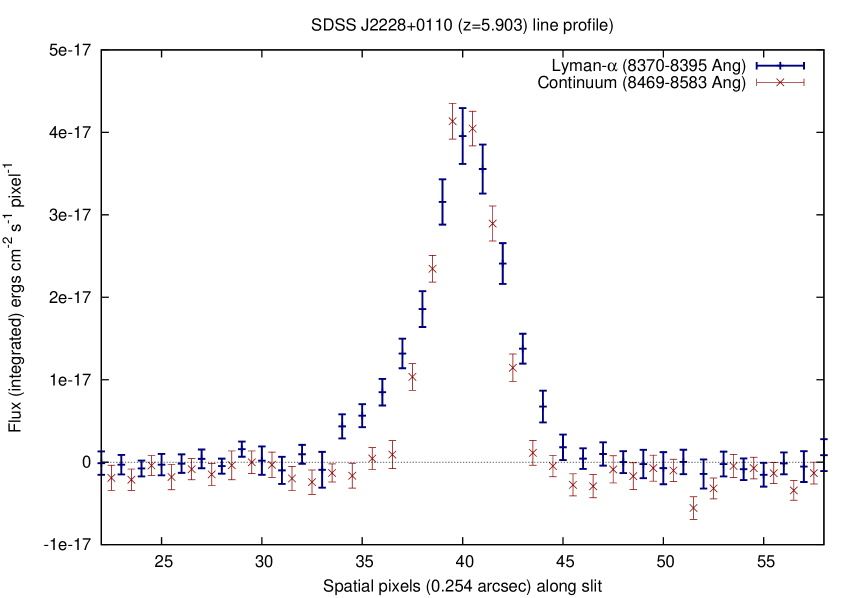
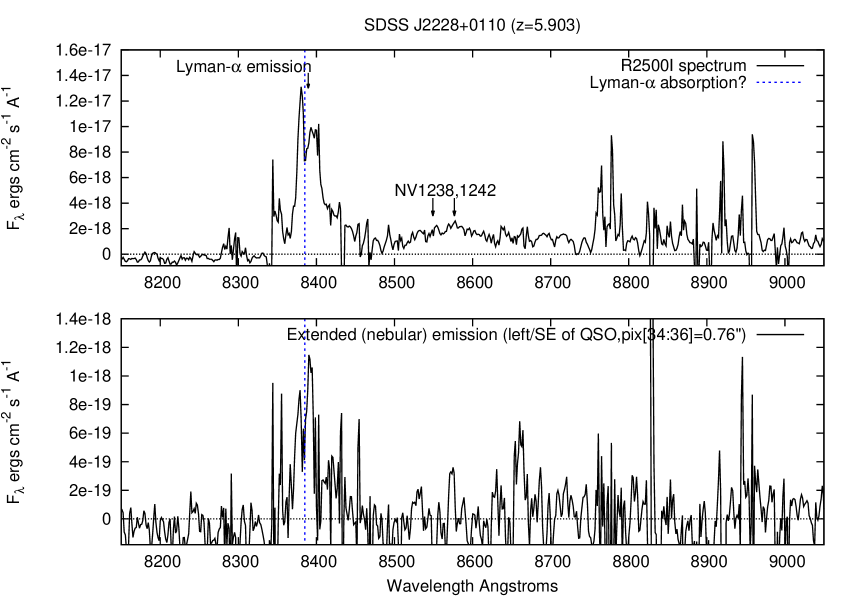
On our 2D spectrum there is some sign that Lyman- emission is a little ( arcsec) extended to the left of the galaxy/QSOs spectrum. So (Fig 12) we compare the spatial profiles of the spectra summed over most of the the Lyman- line and over a region of the continuum with a similar total flux a short distance redward (in both cases avoiding spectral regions with strong sky lines). The spatial profile is more extended on the Lyman- line than for the continuum, with a Gaussian-fit FWHM of compared to arcsec, and it also looks asymmetric. This is evidence of an associated HzLAN, and we extract a nebula spectrum in a narrow 3 pixel (0.76 arcsec) aperture just leftward (SE) of the AGN (Fig 13); it shows noisy but significant Lyman- emission (amidst a continuum consistent with zero). We measure a flux ergs and centre ; the FWHM is poorly constrained with ( km ), and the velocity shift would be , consistent with zero.
Thus we find evidence that this much higher redshift RL-QSO (at Universe age 1.0 Gyr) shows a bright, extended (at least 1.5 arcsec = 9 kpc) emission-line nebula, and possibly blueshifted absorption, similar to its many counterparts e.g. in the H91 sample. But at , this is one of very few examples of HzLAN: see Section 5.2.
4 Spatially Resolved Kinematics of the Nebulae
![[Uncaptioned image]](/html/1407.4046/assets/x27.png)
![[Uncaptioned image]](/html/1407.4046/assets/x28.png)
![[Uncaptioned image]](/html/1407.4046/assets/x29.png)
![[Uncaptioned image]](/html/1407.4046/assets/x30.png)
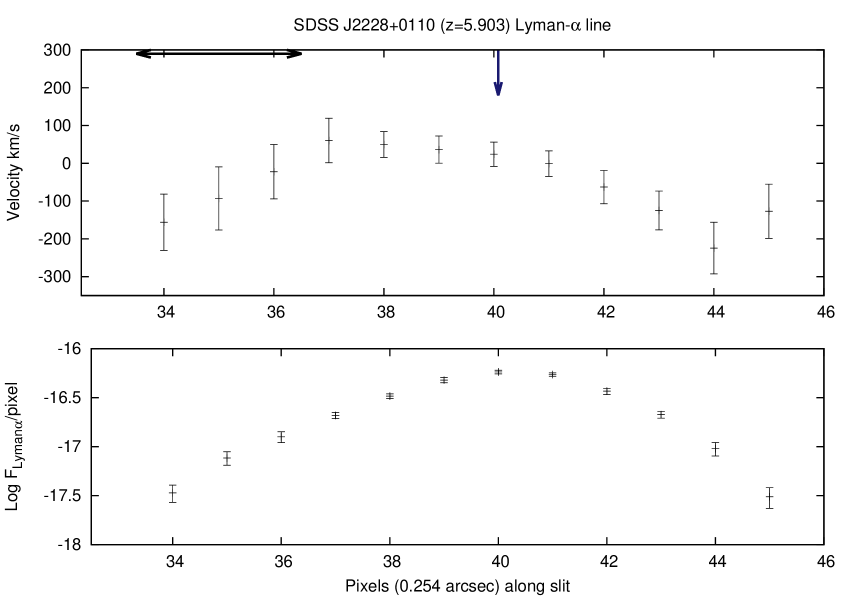
In the previous Section we found that three of the nebulae are redshifted by 250–460 km relative to the AGN. We can make further use of the high resolution in the two available (spatial and spectral) dimensions to study the internal kinematics of the nebulae, from the wavelength of peak Lyman- emission as a function of distance along the slit.
For each flux-calibrated 2D spectrum, we proceed along the slit in the spatial direction, pixel-by-pixel, and interactively fit a Gaussian to the continuum-subtracted Lyman- line in each 1-pixel strip, wherever it is visible above the sky noise. Before the fitting, each 2D spectrum is smoothed by a pixel boxcar, sufficient to reduce sky noise by a factor and thus aid the profile fitting but with very minor loss of resolution. These fits give us the Lyman- central wavelength as a function of spatial distance, across the nebula, host galaxy and AGN. Figure 14 shows the Lyman- velocity offset in the one-pixel strips, calculated as (where is the Lyman- wavelength measured for the QSO in the previous section), and (below) line flux (per pixel).
We see again that three of the emission nebulae (Q0805+046, Q1658+575 and Q0758+120) are redshifted by –500 km and the other two are approximately at rest on the line-of-sight axis, relative to the QSO. Examination of the spectra at higher spatial resolution has not revealed large monotonic velocity gradients (i.e. several hundred km ) across the nebulae that might indicate kinematics dominated by rotation (at any large angle to the line of sight). The V-shaped velocity curves of Q1658+575 and Q0805+046 flatten in the outer parts and so appear to be due to a systematic redshifting of the whole nebula relative to the QSO, rather than to the nebula’s internal motion.
In Q0805+046, we find a small velocity shift, km over arcsec (64 kpc), across the nebula (see also Fig 8), and a much steeper velocity gradient, in the same direction, across the central peak of the profile (pixels 40–48); km across 2 arcsec (16 kpc). The strong absorption line at may complicate interpretation and velocity measurements, but a close-up examination of the line profile (Fig 15) indicates a genuine shift in the emission line; note the highest emission peak lies blueward of the bisecting absorption line on the left of the AGN, but is redward on the right side. One possibility for producing a steep gradient might be Lyman- emission from star-formation in a rapidly rotating host galaxy, or an ongoing merger, but the line is very broad here ( km ) and we do not see an obvious narrow component. More likely, the velocity gradient might be attributed to the nebular emission, if its central region is very bright and had much more active/turbulent kinematics than the relatively quiescent outer region, with a rapidly rotating inner disk and/or a localised outflow (e.g. in a narrow jet towards the observer, as in Nesvadba et al. 2008).
The faint left/NE side of the Q2222+051 nebula also appears on our plot to be redshifted (by as much as km ) relative to the QSO and (non-redshifted) right side, but the signal-to-noise is very poor here. There is also a peak in the FWHM. If this is genuine it is probably due to a localised outflow, rather than an overall rotation, because this velocity curve remains very flat at on the right/SW side.
5 Discussion
5.1 Kinematics of the Giant Nebulae
| Nebula | Ly SB ergs | FWHM | |
|---|---|---|---|
| km | km | ||
| Q1658+575 | |||
| Q0758+120 | |||
| Q0805+046(SE) | |||
| Q0805+046(NW) | |||
| Q2222+051 | |||
| J2228+0110 |
We examined the nebular Lyman- lines (summarized in Table 2) and found little indication of systematic velocity gradients across the nebulae. This implies that if these nebulae are rotating structures, the rotation axes are close to the line-of-sight. However, 3/5 of the nebulae do show overall redshifts in their Lyman- emission relative to the AGN, of –460 km . For Q2338+042 we were unsuccessful in seeing a nebula due to poor conditions; but previously Lehnert and Becker (1998) detected the extended nebula up to 5 arcsec on both sides of the AGN, and with Keck LRIS data and essentially the same methods as ours investigated its kinematics. From their findings the Q2338+042 nebula fits the same pattern as the rest of our sample with a broad FWHM of up to 1300 km , a small redshift relative to the AGN (–200 km ) and little or no internal velocity gradient.
Previously, Villar-Martín et al. (2003), performed long-slit Keck and VLT spectroscopy of 10 radio galaxies with extensive nebulae (–14 arcsec) at . The HeII1640 and Lyman- emission lines gave similar curves, showing velocity shifts across the nebula diameters ranging from near-zero to km . In at least 4 and probably 6 of the 10 RGs the velocity fields were consistent with rotating systems, with the velocities giving dynamical masses a few (consistent with massive galaxies). Orbiting satellite galaxies might contribute to the velocity shifts, but it was considered the line emission would probably be dominated by the gaseous halo.
Of course the observed would also depend (as sin ) on the orientation of the rotation axis relative to the line of sight. Hence if (i) radio galaxies and RL-QSOs differ only by orientation, with the axis or ‘bi-cone’ where the AGN emission is not obscured by the torus being close to the line-of-sight in the RL-QSOs but closer to the sky plane in HzRGs, and (ii) the nebulae are rotating and/or undergoing ordered, anisotropic motion (infall or outflow) with an axis aligned with the optical/radio emission axis of the AGN, then the nebula velocity maps (as observed on the line-of-sight) would show different patterns for radio galaxies and RL-QSOs. Less orientation-dependent nebular properties (luminosity, line ratios, diameter, velocity FWHM etc.) would remain closely similar. Indeed there is already evidence for this.
Using VLT-VIMOS integral field spectroscopy, Villar-Martín et al. (2006 and 2007) studied the Lyman- nebula kinematics of four further radio galaxies. Three had double components in Lyman- (matching the radio peaks) with velocity separation a few 100 km , suggesting rotation and/or two orbiting or merging galaxies. The other nebula (MRC 1558-003) is rounded with the centre redshifted by km relative to the outermost regions, a pattern more suggestive of infall.
Humphrey et al. (2007), using a sample of 11 HzRG nebulae at , which had internal velocity shifts –770 km , found a correlation of asymmetries: in addition to the known radio/Lyman- alignment, the side of the HzLAN brighter in both Lyman- and radio (i.e. the near side) was almost always the more redshifted side. They interpreted this as evidence for (anisotropic) infall of the nebulae onto the host galaxies (ultimately to fuel the AGN and star-formation). The greater prominence of infall in the nebula velocity map of MRC 1558-003 could then be explained by its orientation, with its emission cone axis closer to the line of sight ( from) than for the others; there is evidence for this in the spectrum of this galaxy which shows broad emission from the AGN broad line region. As this galaxy is closer to the RL-QSO class than most radio galaxies (if only by its alignment), the implication is the nebulae of RL-QSOs would show similar (i.e. infall-dominated) velocity maps.
Christensen et al. (2006) observed a sample of high- QSOs with the Potsdam Multi Aperture Spectrophotometer (PMAS) integral field spectrograph, and for two detected HzLAN of sufficient Lyman- brightness (similar to our sample) to map the line velocity. One (the radio-loud Q1759+7539) showed a fairly uniform km relative to the QSO emission-line, the other (the radio-quiet Q1425+606) a radial gradient with decreasing to 200 km at 3.5 arcsec (which is similar to MRC 1558-003 mentioned above). Most recently, Humphrey et al (2013) in GTC-OSIRIS spectroscopy of the RL-QSO TXS 1436+157 found a relatively small, 110 km redward shift in HeII1640 from the AGN to the nebula (on its east side): this again was interpreted as evidence for infall of the nebula, at – onto the galaxy.
In our RL-QSO sample, the nebular Lyman- have a mean FWHM of 863 km with range 400–1100 km , which is similar to radio galaxy nebulae; a little less than the FWHM of 700–1600 km in van Ojik et al. (1997), a little greater than in the Villar-Martín et al. (2003) sample with 250–850 km , and in the same 400–1500 km range as the Villar-Martín et al. (2007) integral-field spectroscopy of 3 HzRGs. Similarly Christensen et al. (2006) found Lyman- FWHM km for the bright nebulae around two QSOs. However, whereas almost all of the radio galaxy nebulae in Villar-Martín et al. (2003, 2006, 2007) and Humphrey et al. (2007) show substantial velocity gradients (shears), amounting to –770 km across the nebular diameter, our 5 RL-QSO nebulae have much flatter velocity profiles (Fig 14). Neither do we find examples of nebulae with more redshifted centres (like Q1425+606 and MRC 1558-003), although such an effect (if limited to a small central area) might have been hidden within the much stronger broad-line emission from the QSOs. These RL-QSOs appear more similar to Q1759+7539 of Christensen et al. (2006), a RL-QSO at with a large nebula redshifted by 200–300 km with little or no internal velocity gradient.
In the Q0805+046 nebula, the brighter side appears to be slightly ( km ) more redshifted, in agreement with the correlation described by Humphrey et al (2007) for HzRGs. We also find a much steeper ( km in 2 arcsec) velocity gradient across the centre or host galaxy of Q0805+046, suggesting more complex kinematics at the very centre of the nebula, such as fast rotation or a localised outflow. On the basis of the interesting velocity curve and high surface brightness nebula, this object especially would merit further investigation by high-resolution integral-field spectroscopy. Q2222+051 is possibly a counterexample to the Humphrey at al. (2007) correlation, in that our line fitting found a region on the fainter, left side to be the more redshifted (the line is also very broad in FWHM here) – this might even be an outflow directed away from the observer.
It should be noted that a Lyman- emission line can be redshifted (by up to a few 100 km ) in a number of ways, e.g. infall of an emission nebula, an outflowing jet directed away from the observer, or thirdly, as in the models of Verhamme et al (2008) and Schaerer et al. (2011), which represent galaxies as central starbursts within expanding HI shells. In these models the approaching HI shell causes a blueshifted Lyman- absorption line while backscattering from the receding side redshifts the Lyman- emission that reaches the observer. However, this may be less effective for the much broader emission lines of powerful AGN. Detection of polarisation in a few HzLAN (e.g. Hayes et al. 2011; Humphrey et al. 2013b) implies that some percentage of their Lyman- may indeed be back-scattered, yet we consider it more likely that for HzLAN the majority of the observed photons come from the ionized nebulae directly and show its true velocity, rather than being the nuclear photons reflected in a moving HI ‘mirror’. We did find some blueshifted intrinsic absorbers in the QSO spectra, but their lines are narrow and unsaturated (except in Q2338+042), suggesting the effects of HI scattering on Lyman- are relatively small. Also, detection of extended HeII emission tracing the same velocity as Lyman-, from the Q2222+051 nebula here, and many others (e.g. Villar-Martín et al. 2003; Sánchez and Humphrey 2009), suggests the photoionized gas is in HzLAN observed directly, as HI could not back-scatter the HeII line in the same way as Lyman-. And the correlation of Humphrey et al. (2007), followed by at least Q0805+046 in this sample, implies that redshifted Lyman- usually comes (directly) from the near side of the nebulae.
Martin et al (2014) discovered that a QSO with extended Lyman- emission was also associated with two long Lyman- emitting filaments, with relative +100 and +600 km, which were believed to be accreting onto the host galaxy. Recent models predict (Dekel et al. 2008, Sánchez Almeida et al. 2014) that massive galaxies at (in general) are being fuelled by accretion from the ‘cosmic web’ at rates –200 . This web of filaments forms HzLAN around (within kpc of) active galaxies, where the accreting gas becomes orders of magnitude more luminous due to fluorescence (Cantalupo et al. 2014). The filaments, extending hundreds of kpc (so far exceeding the sizes of any HI-rich galaxies) must be observed directly in Lyman-, giving their true kinematics, and the same might apply for the HzLAN, which are like bright knots in the web.
These inflowing streams could be simultaneous with powerful AGN/starburst-driven outflows, most likely to be seen as blueshifted emission regions with high FWHM and very steep velocity gradients (e.g. Nesvadba et al. 2008; Villar-Martín et al. 2011). As noted above, such signatures of outflows might be seen in one or two locations in our data, but most of the extended Lyman- in this sample is more consistent with nebulae slowly infalling (e.g. as in Weidinger et al. 2005), or that appear stationary (e.g. Q2222+051 and the ‘blob’ of Yang et al. 2014) with . The latter might actually have mixed infall and outflow, or infall with scattering as in the models of Dijkstra, Haiman and Spaans (2005), although their lines appear single rather than double-peaked, which could set limits on this.
For the Q0805+046 nebula the (14 arcsec) visible diameter and integrated Lyman- flux ( ergs ) from H91 give radius kpc and ergs (the highest in this sample). We measure a high gas velocity = +457 km , and from this could estimate the total mass within as between (assuming infalling gas is in free fall) and (for a circular orbit), giving 1.36–. If the gas infalls to a nucleus at kpc (taking 118 Myr if velocity remains constant) and the density profile inside the nebula is (giving a force of gravity) we estimate that to power all the Lyman- emission by the gravitational energy difference would require a (very high) infall rate of . The lower infall rates expected from models would not be sufficient to account for the , e.g. in the detailed cosmological-hydrodynamical simulations of Goerdt et al. (2010), Lyman- nebulae powered almost entirely by the gravitational potential energy from instreaming gas onto massive haloes would be an order of magnitude less luminous than these HzLAN.
In contrast, Humphrey et al. (2007) proposed that powerful HzLAN like this would have moderate but substantial infall rates onto the host galaxy of . For their assumed volume-averaged HII density atoms and volume filling factor , g and a factor 1.35 to include the mass of helium etc., the Q0805+046 nebula within visible radius 56 kpc would have a total gas mass . Dividing this by our estimated infall time gives an infall rate 208 . Such infall rates, in good agreement with the above-mentioned models with accretion from streams, would certainly be sufficient to power the Lyman- emission if the principal photoionization source is the AGN (almost certainly the case here) and a significant fraction () of the accreting gas goes to feed the SMBH.
As discussed above the differences, and the similarities, in the nebula spectra of RL-QSOs and HzRG are most likely due to the similar natures but different orientation of these AGN. Thus in the more on-axis (small angle ) RL-QSOs, systematic velocity gradients across the nebulae may be suppressed on the line-of-sight direction by factors, without this having much influence on the observed surface brightness, diameter and line FWHM of the nebulae. In addition, this orientation could have brought components of systematic infall (expected for models of accretion) in the emission nebula kinematics into greater prominence in the QSO long-slit spectra. This we may have seen in three of the nebulae, from their –450 km . The other two nebulae, with , might be on average at rest on this axis.
5.2 Discovery of a QSO Nebula
Our second major finding from the OSIRIS spectroscopy is an extended ( kpc) Lyman- emission nebula around the QSO SDSSJ2228+0110, which is a new discovery for this galaxy. There are many small Lyman- emitting galaxies at but extended nebulae are much rarer. Indeed this is the highest redshift detection of a HzLAN associated with a radio-loud AGN. However, there is one other known example of a HzLAN associated with a QSO at these redshifts, CFHQSJ2329-0301 at , first detected by Goto et al. (2009) in narrow -band imaging, and confirmed by spectroscopy (Willott et al. 2011 and separately by Goto et al. 2012). This nebula is similar to our example in extent and Lyman- surface brightness, kpc and ergs from Willott et al. (2011), and apparently in kinematics in that the Lyman- line showed no significant relative to the AGN or velocity gradients, and a similar FWHM measured as 640 (Willott et al. 2011) and (Goto et al. 2012) km .
A third example is the radio-quiet Himiko HzLAN of Ouchi (2009, 2012) at , similarly luminous and also kpc in radius, but perhaps different in nature as it is believed to be a triple merging system undergoing intense star-formation. The Lyman- surface brightness of all 3 HzLAN, 2– ergs , is relatively low compared to the bright nebulae of RGs and RL-QSOs found (Table 2, H91 etc.), but this is accounted for entirely by the higher redshift (a factor 8 dimming from to 6), and the only obvious intrinsic difference is the smaller spatial extent of the nebulae which might be related to less massive host galaxies at these ‘cosmic dawn’ epochs.
5.3 Intrinsic Absorption Systems
| Wavelength | EW() | ID | Redshift | |
|---|---|---|---|---|
| Ly | 1.9949 | -1092 | ||
| Ly | 2.0019 | -390 | ||
| Ly | 2.0069 | +110 | ||
| Ly | 2.0141 | +831 | ||
| NV1238 | 2.0024 | -344 | ||
| NV1242 | 2.0024 | -339 | ||
| SiIV1393 | 2.0009 | -486 | ||
| SiIV1402 | 2.0009 | -488 | ||
| 1.915 | CIV1548 | 2.0013 | -444 | |
| 2.218 | CIV1550 | 2.0013 | -444 | |
| CIV1548 | 1.4690 | |||
| CIV1550 | 1.4679 | |||
| MgII2796 | 0.4714 | |||
| MgII2803 | 0.4714 | |||
| CIV1548 | 1.8562 | |||
| CIV1550 | 1.8566 |
. Wavelength EW() ID Redshift Ly 2.1607 -1142 Ly 2.1846 +1110 MgII2796 0.4070 MgII2803 0.4071 MgII2796 0.4152 MgII2803 0.4150 CIV1548 1.6321 CIV1550 1.6320 Wavelength EW() ID Redshift Ly? 2.6744 -491 CIV1548 2.0260 CIV1550 2.0260 CIV1548 2.2985 CIV1550 2.2985 Wavelength EW() ID Redshift Ly 2.8767 -13 NV1238 2.8767 -16 NV1242 2.8761 -57 MgII2796 0.7031 MgII2803 0.7030 SiIV1393 2.4759 SiIV1402 2.4756 CIV1548 2.4543 CIV1550 2.4543 CIV1548 2.4754 CIV1550 2.4752 MgII2796 0.9598 MgII2803 0.9598
| Wavelength | EW() | ID | Redshift | |
|---|---|---|---|---|
| Ly | 2.5887 | -218 | ||
| 2.5909 | -39 |
| Wavelength | EW() | ID | Redshift | |
|---|---|---|---|---|
| Ly | 2.3112 | -1035 | ||
| NV1238 | 2.3132 | -882 | ||
| NV1242 | 2.3131 | -892 | ||
| SiII1260 | 2.3171 | -525 | ||
| CIV1548 | 2.3085 | -1302 | ||
| CIV1550 | 2.3085 | -1302 | ||
| CIV1548 | 1.6349 | |||
| CIV1550 | 1.6347 | |||
| SiIV1393 | 2.1310 | |||
| SiIV1402 | 2.1308 |
| Galaxy | Line(s) detected | km |
|---|---|---|
| Q1354+258 | Ly | -1092 |
| Ly,,, | [-419] | |
| Ly | +110 | |
| Ly | +831 | |
| Q1658+575 | Ly | -1142 |
| Ly | +1110 | |
| Q0758+120 | Ly? | -491 |
| Q0805+046 | Ly, | [-29] |
| Q2338+042 | Ly, | |
| Q2222+051 | Ly, , | |
| SiII1260 | -525 | |
| J2228+0110 | Ly? | -156 |
We identify a total of 12 candidate intrinsic absorbers in the RL-QSO spectra (see Tables 3 to 8 and the compilation in Table 9), the majority (9/12) of these blueshifted relative to the AGN, with a mean of -249 km-1 and a wide spread km . This is general agreement with findings for HzRGs (van Ojik et al. 1997), which can similarly have very (by km ) blueshifted absorbers (Humphrey et al. 2008).
Of these 12 absorbers, 7 are seen only as Lyman- absorption, while for 4 there are CIV and/or NV and/or SiIV absorption lines as well as Lyman- (with the same ), indicating a particularly high ionization of the absorbing gas (as previously seen for some absorbers in HzRGs and RL-QSO spectra; e.g. Binette et al. 2000, Humphrey et al. 2013), and one is SiII1260.
One absorption line, in Q1658+575, may be visible on the red side of the Lyman- emission from the nebula as well as in the QSO spectrum (Fig 4) and could therefore be an extended absorber. The strong Lyman- absorption line bisecting the Q0805+046 Lyman- may also affect the nebular spectrum (Fig 8) but would appear to have a lower covering factor than for the QSO. Such candidate extended absorbers could be confirmed using integral-field spectroscopy to map the spatial extent of absorption against the bright background of nebular Lyman- emission.
6 Summary of Conclusions
(i) We performed long-slit spectroscopy of 6 radio-loud QSOs at redshifts , with OSIRIS on the Gran Telescopio Canarias, targeting the Lyman- line. The QSOs were selected from Heckman et al. (1991a) as having strong Lyman- emission from surrounding nebulae (HzLAN) extending to radii of tens of kpc. For 4/6 we detect the giant nebula as an extension of the QSO’s Lyman- line for 1–9 arcsec (8–72 kpc) outside the AGN spectrum, on one or both sides of the slit (one non-detection might be due to very poor observing conditions, and the other, non-optimal slit PA plus low sensitivity at the blue extreme of the range).
(ii) With the same instrument we obtained the long-slit spectrum of a much higher redshift radio-loud QSO, SDSS J2228+0110 at . We find evidence its Lyman- emission extends at least 1–2 arcsec (6–12 kpc) beyond the AGN continuum spectrum, indicating a giant Lyman- emission nebula, which is a new discovery for this galaxy. On the basis of this and 2 other known examples, QSOs and starburst galaxies at can have giant Lyman- emitting nebulae of equal intrinsic (i.e. correcting for redshifting) surface brightness to their counterparts at .
(iii) The spectra of the 5 nebulae show Lyman- emission lines with surface brightness 0.4– ergs , and FWHM 400–1100 (mean 863) km (tending to become narrower at greater distances from the central galaxy). For one nebula (Q2222+046) we detect a second, much fainter (by factor 18) and narrower emission line at and identify this as HeII1640.
(iv) In the QSO spectra we also identify a total of 12 probable intrinsic absorbers: 7 only as Lyman- absorption, 4 also in NV, CIV and/or SiIV, and one example of SiII1260. It is not always possible to determine whether intrinsic Lyman- absorption extends across the nebula, as the nebula’s emission line is always narrower than the QSO’s, but there is some indication of this for a line in Q1658+575, and possibly to some extent in Q0805+046.
(v) We examine the spatially-resolved kinematics of the extended nebulae by fitting to their Lyman- line at a series of positions along the slit. The line-of-sight profiles were generally almost flat across the nebulae, in contrast to many radio galaxy nebulae which show large gradients. However, 3 of the 5 nebulae were systematically redshifted relative to the Lyman- line of the QSO, by –460 km (giving V-shaped velocity profiles which flatten at larger radii). We consider the most likely interpretation to be that the motion of this extended gas is dominated by infall, which would be consistent with the results of Humphrey et al. (2007, 2013) and Villar-Martín et al. (2007), who reached similar conclusions for type 2 radio-loud AGNs at . For one of these nebulae, Q0805+046, the brighter side appears to be slightly ( km ) more redshifted and we also found a steep velocity gradient ( km ), across the central 2 arcsec. The other two nebulae, including the example, showed no significant offset from the AGN in mean velocity.
(vi) Giant Lyman- nebulae associated with radio galaxies and with radio-loud QSOs at appear to be very similar in most properties including luminosity, size and line FWHM. However our analysis suggests a systematic difference in the velocity maps. This could simply reflect the different orientation of these two classes of source to the observer’s line of sight, resulting in a component of infall of the nebula (rather than systematic rotation) being brought into greater prominence.
Acknowledgements
This work is based on observations made during Mexican time with the Gran Telescopio Canarias at the Observatorio del Roque de los Muchachos, La Palma, Spain. NR acknowledges the support of ‘Fundação para a Ciência e a Tecnologia’ Investigador grant SFRH/BI/52155/2013. AH acknowledges a Marie Curie Fellowship co-funded by the 7th Research Framework Programme and the Portuguese Fundação para a Ciência e a Tecnologia. AH acknowledges support by the Fundação para a Ciência e a Tecnologia (FCT) under project FCOMP-01-0124- FEDER-029170 (Reference FCT PTDC/FIS-AST/3214/2012), funded by FCT- MEC (PIDDAC) and FEDER (COMPETE). LB acknowledges CONACyT grant 128556. This research has made use of the NASA/IPAC Extragalactic Database (NED) which is operated by the Jet Propulsion Laboratory, California Institute of Technology, under contract with the National Aeronautics and Space Administration. We also thank Montse Villar-Martín, Itziar Aretxaga and Polychronis Papaderos for useful discussions.
References
Adams J.J., Hill G. J., MacQueen P.J., 2009, ApJ, 694, 314.
Barthel P.D., Miley, G.K., Schilizzi R.T., Lonsdale C.J., 1988, A&AS 73, 515.
Bicknell G., Sutherland R., van Breugel W., Dopita M., Dey A., Miley G., 2000, ApJ 540, 678.
Binette L., Kurk J.D., Villar-Martín M., Röttgering, H.J.A., 2000, A&A 356, 23.
Cantalupo S., Arrigoni-Battaia F., Prochaska J.X., Hennawi J.F., Madau P., 2014, Nature 506, 63.
Christensen L., Jahnke K., Wisotzki L., and Sánchez S.F., 2006, A&A 459, 717.
Colbert J.W., Scarlata C., Teplitz H., Francis P., Palunas P., Williger G.M., Woodgate B., 2011, ApJ 728, 59.
Dekel A., Birnboim Y., Engel G., Freundlich J., Goerdt T., Mumcuoglu M., Neistein E., Pichon C., Teyssier R., Zinger E., 2009, Nature 457, 451.
Dijkstra M., Haiman Z., Spaans M., 2006, ApJ 649, 37.
Goerdt T., Dekel A., Sternberg A., Ceverino C.,Teyssier R., Primack J.R., 2010, MNRAS, 407, 613.
Goto T., Utsumi Y., Furusawa H., Miyazaki S., Komiyama Y., 2009, MNRAS 400, 843.
Goto T., Utsumi Y., Walsh J.R., Hattori T., Miyazaki S.; Yamauchi C., 2012, MNRAS 421, L77.
Hayes, M., Scarlata C., Siana B., 2011, Nature 476, 304.
Heckman T.M., Lehnert M.D., van Breugel W., Miley G.K., 1991a, ApJ 370, 78. (H91)
Heckman T.M., Lehnert M.D., Miley G.K., van Breugel W., 1991b, ApJ 381, 373.
Humphrey A., Villar-Martń M., Fosbury R., Vernet J., di Serego Alighieri S., 2006, MNRAS 369, 1103.
Humphrey A., Villar-Martín M., Fosbury R., Binette L., Vernet J., De Breuck C., di Serego Alighieri, S., 2007, MNRAS 375, 705.
Humphrey A., Villar-Martín, M., Sánchez S.F., di Serego Alighieri S., De Breuck C., Binette L., Tadhunter C., Vernet J., Fosbury R., Stasielak J, 2008, MNRAS 390, 1505.
Humphrey A., Iwamuro F., Villar-Martín M. Binette L., Sung E.C., 2009, MNRAS 399, L34.
Humphrey A., Binette L., Villar-Martín M., Aretxaga I., Papaderos P., 2013, MNRAS 428, 563.
Humphrey A., Vernet J., Villar-Martín M., di Serego Alighieri S., Fosbury R.A.E., Cimatti A., 2013b, ApJ 768, L3,
Lehnert M.D, Becker R.H., 1998, A&A 332, 514.
Lehnert M.D., van Breugel W.J.M., Heckman T.M., Miley G.K., 1999, ApJSS 124, 11.
Martin D.C., Chang D., Matuszewski M., Morrissey P., Rahman S., Moore A., Steidel C.C., 2014, ApJ 786, 106.
Nesvadba N.P.H., Lehnert M.D., De Breuck C., Gilbert A.M., van Breugel W., 2008, A&A 491, 407.
van Ojik R., Röttgering H.J.A., Miley G.K., Hunstead R.W., 1997, A&A 317, 358.
Ouchi M., et al., 2009, ApJ 696, 1164.
Ouchi M., et al., 2013, ApJ 778, 102.
Roche N.D., Franzetti P., Garilli B., Zamorani G., Cimatti A., Rossetti E., 2012, MNRAS 420, 1764.
Sánchez S.F., Humphrey A., 2009, A&A 495, 471.
Sánchez Almeida J., Elmegreen B. G., Munõz-Tunõn C., Elmegreen D., M., 2014, A&A preprint (arXiv1405.3178).
Schaerer D., Hayes M., Verhamme A., Teyssier, R., 2011, A&A, 531, 12.
Smith D.J.B., Jarvis M. J., Simpson C., Martínez-Sansigre A., 2009, MNRAS 393, 309.
Stockton A., McGrath E., Canalizo G., Iye M., Maihara T., 2008, ApJ 672, 146.
Verhamme A., Schaerer D., Atek H., Tapken C., 2008, A&A, 491, 89.
Villar-Martín M., Vernet J., di Serego Alighieri S., Fosbury R., Humphrey A., Pentericci L., 2003, MNRAS, 346, 273.
Villar-Martín M., Sánchez S. F., De Breuck C., Peletier R., Vernet J., Rettura A., Seymour N., Humphrey A., Stern D., di Serego Alighieri S., Fosbury R., 2006, MNRAS 366, L1.
Villar-Martín M., Sánchez S.F., Humphrey A., Dijkstra M., di Serego Alighieri S., De Breuck C., González Delgado R., 2007, MNRAS 378, 416.
Villar-Martín M., Humphrey A., Delgado R.G., Colina L., Arribas S., 2011, MNRAS 418, 2032.
Weidinger M., Mȯller P., Fynbo J.P.U., Thomsen B., 2005, A&A 436. 825.
Willott C.J., Chet S., Bergeron J., Hutchings J.B., 2011, AJ 142, 186.
Yajima H., Li Y., Zhu Q., 2013, ApJ 773, 151.
Yang Y., Walter F., Decarli R., Bertoldi F., Weiss A., Dey A., Prescott M.K.M., Badescu T., 2014, ApJ 784, 171.
Zeimann G.R., White R.L., Becker R.H., Hodge J.A., Stanford S.A., Richards G.T., 2011, ApJ 736, 57.