Interplay of anisotropy in shape and interactions in charged platelet suspensions
Abstract
Motivated by the intriguing phase behavior of charged colloidal platelets, we investigate the structure and dynamics of charged repulsive disks by means of Monte-Carlo simulations. The electrostatic interactions are taken into account through an effective two-body potential, obtained within the non-linear Poisson-Boltzmann formalism, which has the form of anisotropic screened Coulomb potential. Recently, we showed that the original intrinsic anisotropy of the electrostatic potential in competition with excluded volume effects leads to a rich phase behavior that not only includes various liquid-crsytalline phases but also predicts the existence of novel structures composed of alternating nematic-antinematic sheets. Here, we examine the structural and dynamical signatures of each of the observed structures for both translational and rotational degrees of freedom. Finally, we discuss the influence of effective charge value and our results in relation to experimental findings on charged platelet suspensions.
I Introduction
Charged platelet suspensions, such as swelling clays Beidellite ; nontronite ; Laponite ; Sara-PRE2008 ; bentonite ; clay1 ; clay2 ; clay3 , disk-like mineral crystallites Gibphase ; zirconium ; gib2008 ; Gibphase ; Gibbsite ; Lekker ; crys1 ; crys2 ; crys3 or exfoliated nanosheets nanosheets ; nanosheets1 ; nano1 ; nano2 ; nano3 ; nano4 abound in natural as well as industrial environments. Such minerals can be found in various particle sizes varying between 10 nm up to a few micrometers and the majority of them have a platelet-like shape with high aspect ratio, typically ranging between 20 and 1000. Apart from their natural relevance in geology as agents conferring solidity to soils, they are exploited in various industrial applications such as thickeners, fillers and gels in agriculture or pharmaceutics. Despite widespread applications of charged platelets suspensions, their phase behavior is still elusive. They exhibit nonintuitive phase behaviors: while some charged platelet suspensions Laponite ; bentonite form arrested states at low densities, others Beidellite ; Gibphase exhibit an equilibrium isotropic-nematic transition at moderate densities. The highly charged nature of the platelets suggests that the electrostatic interactions should definitely play a major part, although in some cases other specific interactions seem important for fathoming the complex phase behavior of such systems. Therefore, the first important step for addressing the phase behavior of charged platelet suspensions is to elucidate the role of electrostatic interactions.
Understanding the influence of long-ranged electrostatic interactions on phase behavior of charged anisotropic colloids is a non-trivial many-body and challenging problem by itself. The complexity stems from the multi-component nature of these systems which comprise asymmetric constituents of macro ions (charged platelets) and ionic species. The high surface charge density of platelets (0.1–0.5 C/m-2) implies that a large number of counter-ions, not speaking of added salt ions, need to be accounted for in any primitive model treatment. Computationally such a problem becomes cumbersome if not prohibitive with our current computational facilities. Therefore, resorting to an approach where the effects of ions are considered through an effective interaction between charged platelets allows us to simplify the problem and proceed further.
Recently, we developed a coarse-grained model where the ionic degrees of freedom are integrated out and disks interact with an effective pair potential and we charted out the full phase diagram of repulsive charged disks Scirep . Our effective pair potential, obtained within non-linear Poisson-Boltzmann formalism and therefore repulsive, has the form of a screened Coulomb potential (Yukawa) multiplied by an angular function of the orientations of the two disks, which embodies the anisotropy of the interactions Trizac ; Carlos . This anisotropy function depends on the ionic strength. Our carefully derived pair potential has the advantage that it overcomes the shortcomings of prior models where the renormalized effective charge and full orientational dependence of angular potential were not taken into account Rowan00 ; Dijkstra ; Wensink .
We explored the structure and dynamics of charged disks interacting with anisotropic screened Coulomb potential in conjunction with hard core interactions by means of Monte-Carlo (MC) simulations, for a wide range of densities and ionic strengths. Interplay of anisotropy in shape and interactions of charged repulsive platelets leads to a rich phase diagram that encompasses various crystalline (bcc and hexagonal and plastic crystals) and liquid crystalline phases (nematic and columnar hexagonal), that rationalizes generic features of the complex phase diagram of charged colloidal platelets such as Beidellite clay and Gibbsite. Additionally, we found that the original intrinsic anisotropy of the electrostatic potential between charged platelets leads to formation of a novel structure which consists of alternating nematic and anti-nematic layers. We coined this new phase intergrowth texture. Investigating translational and rotational dynamics of charged disks as a function of density, we found evidences of a strong slowing down of the dynamics upon approaching the orientational disorder-order line. However, we did not present the structural and dynamical signatures of each structure. Here, we provide a complete description of each phase by characterizing the positional and orientational pair correlation functions (statics) and self-intermediate scattering and time orientational correlation functions (dynamics) for disks. Additionally, we inspect the dependence of nematic order parameter and hexagonal bond orientational order parameter as function of density at different ionic strengths.
The article is organized as follows. In section II, we review briefly the arguments leading to the effective interactions. We present the angular dependence of the anisotropy function for charged disks at several values of ionic strength and we discuss the corresponding variation of effective charges. In section III, our simulation method and the details of equilibration procedure are presented. In section IV, we represent our phase diagram and then discuss in detail the static and dynamical features of each of the structures. We also analyze the influence of effective charge on structure. Concluding remarks are drawn in section V.
II Effective interactions for charged disks: Anisotropic Yukawa potential
In order to obtain a tractable effective interaction potential between two charged platelets, we need to integrate out the ionic degrees of freedom. Such an effective potential can be derived within Poisson-Boltzmann formalism where we consider thin uniformly charged disks of density and a continuous charge density profile for the ions. The far-field behavior of the electrostatic potential for highly charged disks (valid in relatively dilute colloidal suspensions) is exactly the same as the one obtained within the linearized PB theory provided that the boundary condition of constant surface potential is imposed on the surface of the colloid TrBA02 ; Trizac ; Carlos . The value of the surface potential on the disk depends on its charge density and ionic strength, that sets , where is the Bjerrum length Trizac . Coarse-graining thereby leads to an effective charge for the disks that is considerably lower than their real charge, and its value depends on the ionic strength.
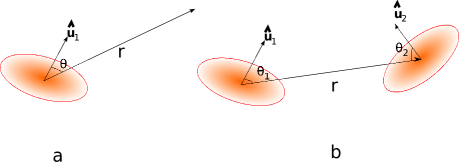
The spatial form of the resulting far-field electrostatic potential is given by the product of a screened Coulomb potential and an anisotropy function that depends on the azimuthal angle under which the disk is seen. More precisely, this potential at a distance from a disk center with diameter and at an angle with its orientation is given by (see Fig. 1a) Trizac ; Carlos :
| (1) |
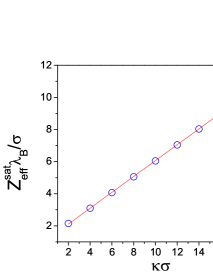
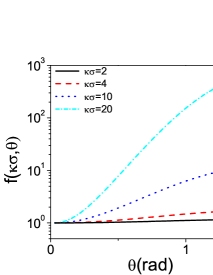
The anisotropy function takes into account the orientational dependence of the potential and can be expressed in terms of spheroidal wave functions Carlos . For highly charged plates, the value of the effective charge somewhat simplifies, and only depends on the ionic strength (together with disc radius). This is the saturation phenomenon TrBA02 ; BoTA02 . The charge is shown in Fig. 2, where it can be seen that the effective charge increases linearly with ionic strength , while the anisotropy function shows an angular dependence which increases with . Eq. 1 shows that the effective potential of a charged disk in the presence of ions remains anisotropic at all lengthscales unlike the Coulomb potential of a charged disk in vacuum. It should be emphasized that the above results hold provided that is not too small TrBA02 ; Trizac . For , the anisotropy factor approaches unity and the value of effective charge at saturation is determined from the solution of full non-linear Poisson-Boltzmann equation. The corresponding charge value at that we used in our simulations is Trizac .
Having obtained the effective potential for a charged disk in an electrolyte, we can construct the two-body interaction potential for two charged disks, in an electrolyte medium, whose centers are a distance apart and whose normals make an angle with the line connecting their centers (see Fig. 1b), as outlined in reference Trizac :
| (2) |
where . The presence of the anisotropy functions in the pair interaction potential implies a strong asymmetry between coplanar and stacked configurations. Given the form sketched in Fig. 2, for a fixed center to center distance, the stacked configuration corresponds to the minimum of interaction potential while the coplanar arrangement gives rise to the unfavorable situation of maximum repulsion. Although both arrangements correspond to non-overlapping disks configurations and are equivalent from the excluded volume point of view, electrostatic interactions robustly favor stacked ordering against coplanar arrangement. Hence, for charged disks and more generally in charged oblate spheroids, a competition between the anisotropic excluded volume and electrostatic effects ensues. The interplay between anisotropy in shape and interactions has important consequences on the phase behavior and dynamics as will be the topic of discussion in the following. However, before discussing the phase behavior we first outline the method and details of our simulations in the next section.
III Simulation methods and details
We carried out canonical () Monte-Carlo simulations Allen ; Frenkel on a system of infinitely thin hard disks, i.e. zero thickness, with diameter in a cubic simulation box of side with periodic boundary conditions using the anisotropic two-body potential of Eq. (2). For reasons of efficiency, the potential and the anisotropy function were tabulated as functions of radial and angular variables. The simulations were performed for a wide range of densities and ionic strengths giving rise to . The temperature used in our simulations is K which corresponds to a Bjerrum length A. The dimensionless diameter was taken to be 43 in the simulations, although we shall argue that its precise value, in a parameter range to be specified, is irrelevant. The number of particles varied between . However, most of simulations were performed with disks corresponding to box sizes ranging from for to for . For , we adopted an Ewald-like scheme (i.e. with neglect of the small Fourier space contribution) to take into account the relatively long range of the potential salin:00 . More details on the Ewald-like summation method for anisotropic Yukawa potential can be found in Appendix A. One should note, however, that due to the presence of the anisotropy function , the screened potential depends on both and . Therefore, this scheme can only be applied in an approximate way (see Appendix A). For in the density range , we confirmed that Ewald-like simulations performed with particles lead to the same results as with larger box sizes (, ) without Ewald sums.
Due to relatively large values of the effective charge leading to a complex free energy landscape, we sometimes encountered, at large densities, , a dependence of the final configuration on initial conditions. We circumvented this problem by simulated annealing SimuAnneal i.e. we started from an initial equilibrium configuration of (uncharged) disks at the desired density, then increased the charge gradually from zero to the final value . We performed (depending on the density and ) MC cycles, (a cycle consisting of translation and rotation of the particles) at each equilibration step before increasing the charge value. Depending on the density and ionic strength, we varied the amplitudes of translational and rotational moves in the range to obtain an acceptance ratio of about 30-40%. It turned out essential to guarantee equilibrium of the system in the initial stages (low charge values) of the process. This gradual charge increment, similar to gradual cooling of the system for a fixed value of the effective charge, leads to reproducible results for independent simulation runs performed with different initial conditions, provided the charge increment between two subsequent steps is small enough, typically . It may be worthwhile to point out that common strategies like starting from an equilibrated high density configuration then lowering the density by scaling of the simulation box dimensions (at fixed ) or starting from an equilibrium configuration at some value of and varying the value of (at fixed density) failed due to pronounced “hysteresis” effects.
To characterize the features of each structure, we computed both structural and dynamical correlation functions. The spatial arrangement of particles was identified by radial pair correlation function and its spatial Fourier-transform, i.e., the structure factor. The degree of orientational order was characterized by the nematic order parameter where is the angle of a platelet normal with the director and the brackets mean averaging over all particles ”ensemble averaging”. The director is obtained by finding the eigenvector corresponding to the eigenvalue of nematic order tensor with the largest magnitude. By definition, with for the disordered isotropic phase. When , the platelet normals point on average along the director while in the more unconventional regime, the platelet normals are on average perpendicular to (”antinematic” order). Likewise, the extent of orientational order in space was quantified by orientational pair correlation function where is the angle between the orientations of two particles which are a distance apart.
We further investigated the dynamics of the orientationally disordered structures with vanishing by means of dynamic Monte-Carlo (DMC) that we have developed for anisotropic colloids DMCsara . In this case, very small values of displacements were used and we performed MC cycles to obtain the dynamical quantities. The dynamics of translational degrees of freedom was characterized by self intermediate scattering function and mean-squared displacement . We quantified the rotational dynamics by computing orientational time correlation function . In Appendix B, we provide a complete list of all quantities computed to characterize the structure and dynamics of the observed structures as well as their definitions.
A few lines are here in order concerning the methodology. Our goal is to chart out the phase diagram of the platelet system under study. Ideally, this proceeds by computing the free energies of a number of candidate phases. Of course, due inclusion of micro-ions in the simulations, both counter-ions and co-ions, opens the way to proper free energy calculations, but such a route seems prohibitively expensive in computational resources commentJJ , which explains why we resorted to an effective description, integrating out the micro-species from the description. It should be realized next that knowing the effective pair interactions between the colloids, as is the starting point for us, is not sufficient to compute the free energy. It would be incorrect to use the corresponding effective Hamiltonian, which only depends on the colloidal degrees of freedom, to compute the free energy in a one component model view. This has been explained in the literature, see e.g. vanRoij ; Belloni ; Dobnikar . This is due to what is often called ’volume terms’ which are state-dependent and depend on the volume fraction as well. They are not known for aspherical objects, for which charge renormalization effects, of paramount importance here, have not been studied so far Denton . This precludes the use of the effective Hamiltonian to get the total free energy of the system. The key point here is that, nevertheless, the effective potential, in the one component view, yields the correct colloidal structure. This is precisely what we do in our study (at Monte Carlo level to sample phase space). As a consequence, we cannot reach the same level of accuracy in location of phase boundaries as with proper free energy calculations, but we nevertheless provide a trustworthy exploration of the phase diagram.
IV Results
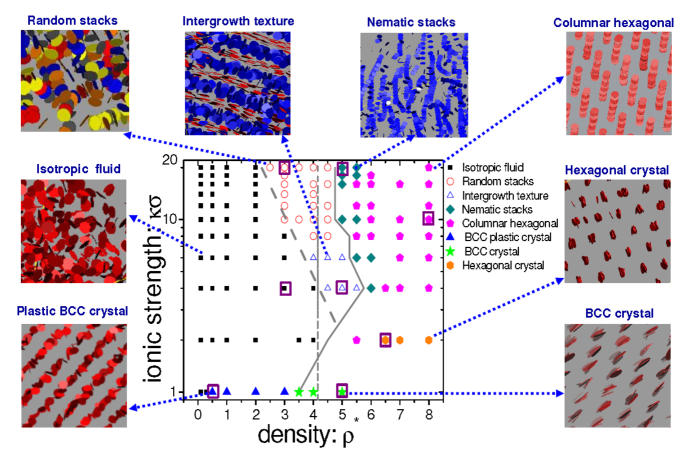
Having introduced the effective interactions between charged disks and our simulation method, we investigate the phase behavior as a function of ionic strength and density at saturation value of effective charge, a case which pertains to highly charged disks. In the following, we first provide an overview of the structures observed and present our concluding phase diagram shown in Fig. 3. Then we discuss in more detail the features of each structure. Subsequently, we examine the influence of effective charge magnitude on the formation of structures in both orientationally ordered and disordered regions of the phase diagram.
IV.1 Phase behavior
Before going into details about the characteristics of each structure in the following subsection, we discuss our diagram (see Fig. 3) as a function of density and ionic strength (proportional to ). Through a detailed analysis of the observed structures by various static and dynamical correlation functions, snapshots, etc (see below), we have identified eight distinct structures. Four of them have a vanishing overall nematic order parameter, and are formed at low and moderate densities. The first structure is that of an isotropic fluid with both short-ranged positional and orientational order. The second one is a plastic crystal with long-ranged positional order and random orientations of particles. The third one is a set of disk stacks whose orientations lack any long-range orientational order. This structure appears at high ionic strengths and densities preceding the nematic phase. The fourth structure, also with vanishing , is a more ”exotic” arrangement that consists of intertwined nematic and anti-nematic layers whose directors are perpendicular to each other and we coined it nematic-antinematic intergrowth texture Scirep . The orientationally ordered phases with appear at higher densities. They include two liquid-crystalline phases, i.e. nematic phase of platelet stacks (sometimes called ”columnar nematic”) and hexagonal columnar phase, which appear at moderate to high ionic strength. The other two ordered structures are crystalline phases with bcc-like and hexagonal symmetry which exhibit both positional and orientational long-ranged order.
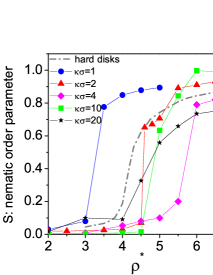
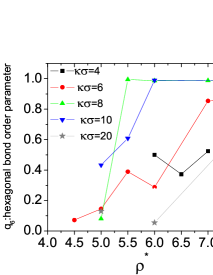
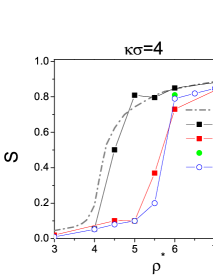
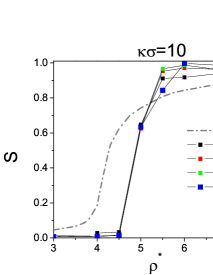
We summarize briefly some important aspects of the phase diagram (Fig. 3) in connection with the features of our pair potential. A distinctive feature is the non-monotonic behavior of orientational disorder-order transition with . While for the fairly isotropic case with , the orientationally ordered phases appear at lower densities than those of hard disks Daan-disks ; Harnau , for the liquid-crystalline phases of charged disks appear at densities . In Fig. 4a, we have shown the nematic order parameter versus density for several . The curves show that the overall nematic order parameter is a sensitive function of ionic strength. For the orientationally ordered phases, in Fig. 4b, we have plotted the hexagonal bond orientational order parameter as a function of density for several values of . characterizes the positional ordering of particles on planes perpendicular to the nematic director. We notice that also exhibits a non-monotonic dependence versus . These non-monotonic behaviors can be understood as opposing effects of decreasing screening length (favoring hard disk-like behavior) and enhanced anisotropy function (disfavoring nematic ordering) upon increase of the ionic strength. Note that is also an increasing function of but we verified that the observed trend is unchanged provided ; this issue is discussed in more detail in Sec. IV.3. This in turn implies that the particular value of , which is a priori a relevant dimensionless parameter, in practice plays little role. This opens the possibility to discuss the results pertaining to different particle sizes solely in terms of and , as will be done in the following.
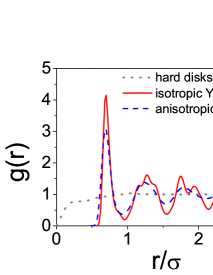
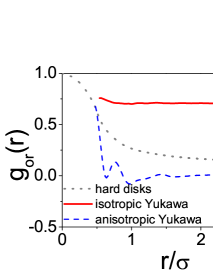
In the limit of low ionic strengths corresponding to , where the potential is rather isotropic and long-ranged, bcc-like structures are formed, as observed with charged spheres at low Dijkstra . At low densities, disks are orientationally disordered (plastic crystal) and are reminiscent of the Wigner crystals observed for low volume fractions of charged spheres chaikin . Increasing the ionic strength, at where the amplitude of the anisotropy function is less than 1.2, the plastic crystal is replaced by an isotropic fluid at low and moderate densities. The crystal disappearance for a slightly larger and shorter range of potential highlights the effect of anisotropy. Performing simulations for a system of hard disks interacting with an isotropic Yukawa potential at the same value of and , we verified that the observed geometrical frustration is indeed due to anisotropic nature of potential which leads to melting of crystalline structures at moderate densities. In Fig. 5, we have plotted positional and orientational correlation functions at a density close to the isotropic-nematic transition for hard disks, i.e., for both hard and charged disks at as well as disks interacting with isotropic Yukawa potential. Interestingly, we find that an isotropic Yukawa potential enhances orientational order, while the small anisotropy amplitude of charged disks at leads to destruction of the orientational order, thereby illustrating the frustrating effect of the anisotropy function on the ordering of disks.
At , in the high density regime, the long-range positional order is still preserved as crystals with hexagonal symmetry appear. Interestingly, for large enough ionic strengths corresponding to and at moderate densities, the new intergrowth texture appears and, for , randomly oriented stacks of disks are observed. At still higher densities, further increase of ionic strength equivalent to , leads to weakening of the positional order. Hexagonal crystals are replaced by hexagonal columnar liquid-crystals with no positional correlations along the nematic director.
Having provided a general overview of the phase behavior, we turn, in the next subsection, to a detailed description of each of these structures. To help the reader, we have marked by empty squares the state points on the phase diagram whose structural and dynamical features are discussed in Section. IV.2.
IV.2 Description of the structures
-
•
Isotropic fluid
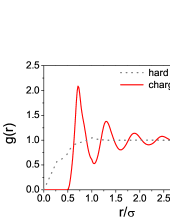
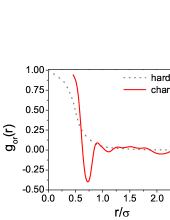
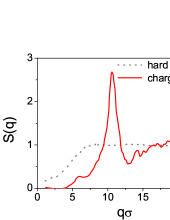
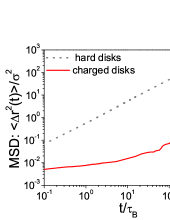
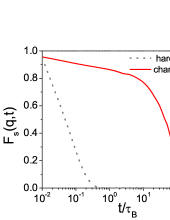
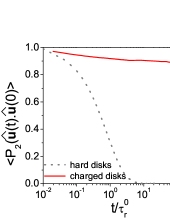
Figure 6: a) the radial pair distribution function , b) the orientational pair distribution function , c) structure factor d) mean squared displacement e) intermediate scattering function computed at and f) orientational time correlation function for an isotropic fluid of and . Similar to the case of hard disks, we observe an isotropic fluid at the lowest densities of the charged disks. However, the highest density for which an isotropic fluid is observed is a non-monotonous function of and the electrostatic interactions alter the spatial arrangement of charged disks conspicuously. To demonstrate this point, in Fig. 6a, 6b, and 6c , we have shown an example of radial pair correlation function , orientational correlation function and structure factor for an isotropic fluid of charged disks at and . In each graph, we have also plotted the corresponding quantities for hard disks of the same density. All of these figures illustrate a marked difference between charged and hard disks isotropic fluids and demonstrate that charged disks form a structured isotropic fluid. As can be seen from the radial pair distribution function, the charged disks are prevented to come too close due to repulsion. The exclusion of particles from each others proximity results in local ordering (manifested in a strong peak in the structure factor) but no long-range spatial correlations exist. The average number of nearest neighbors is obtained by integrating over the first peak of till the first following minimum; for this structure we obtain . This value is comparable to the total number of first and second nearest neighbors in BCC lattices (8+6) and suggests that locally BCC-like ordering is favored for charged disks. The pronounced peak in the structure factor also confirms the presence of a strong degree of local ordering. Looking into the organization of orientations of charged disks in space, we again notice a prominent deep minimum in the orientational pair correlation function at separations slightly higher than particle radius (). This means that at such short distances T-shaped configurations, intermediate between coplanar and stacked, are favored.
We characterize the dynamical behavior of translational and rotational degrees of freedom by mean-squared displacement , intermediate scattering function and orientational time correlation function (see appendix B for definitions) as presented in Fig. 6d, 6e and 6f, respectively. The time for translational motion is rescaled with Brownian time-scale and for rotational motion is reduced by the characteristic time scale for free rotational diffusion of disks, i. e. . Again, we find that the electrostatic interactions influence the dynamics of charged disks remarkably. Both translational and rotational motion of charged disks are dramatically slowed down compared to that of hard disks at the same density. However, both the self-intermediate scattering function and the orientational time correlation function decay on a time scale of the order of . Although we have chosen a relatively high density in the isotropic phase and relaxation times are large, the system remains ergodic.
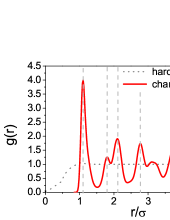
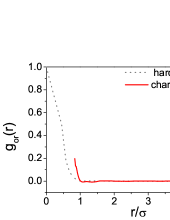
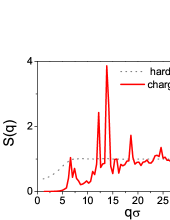
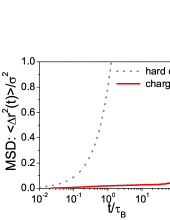
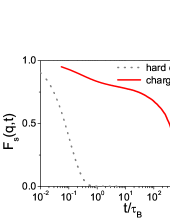
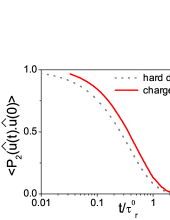
Figure 7: a) The radial pair distribution function , b) the orientational pair distribution function , c) structure factor , d) Mean squared displacement , e) intermediate scattering function at and f) orientational time correlation function for a plastic crystal with and . The dashed vertical lines in Fig a) show the expected sequence of peaks in a bcc structure. -
•
Plastic crystal
Now we turn to the second orientationally disordered structure, i.e. the plastic crystal, which shows long-ranged positional order despite the lack of long-range orientational order. This structure appears at small ionic strengths, , where the potential is fairly isotropic at rather low densities . At such low ionic strengths the range of interaction potential is large enough to induce arrangement of particles into crystalline order at intermediate range of densities. However, these densities are low enough that the disks can have a random orientation without conflicting with excluded volume constraints.
An example of radial and orientational pair correlation functions and structure factor for such a structure are shown in Fig. 7a, 7b, and 7c for and . Similar to the case of isotropic fluid the particles are excluded from proximity of each others for separations compared to the range of potential i.e. . As it can be noticed from both radial pair correlation function and structure factor, there is a robust positional ordering in contrast to hard disks. Examining the positions of peaks in , we verified that the formed crystal has BCC-like positional ordering. The first 8 peak positions expected for an ideal bcc lattice are given by the sequence , and where is the nearest neighbor distance. In Fig. 7a, the dashed lines at distances and 2.75 correspond to first, third, fourth and seventh peak. The second, fifth, sixth and eighth peaks are merged in with the adjacent peaks and are not visible. Integrating over the first peak of merged with its second maximum till the first following minimum, we obtain 14.07 for the number of nearest neighbors which is consistent with the sum of first and second nearest neighbors for the BCC lattice. In contrast to the long-ranged positional order evidenced by , the orientational pair correlation function decays at a distance of the order of one diameter, testifying lack of any long-range orientational order. This state is similar to the so-called Wigner crystal observed for charged spheres at low volume fractions chaikin .
Now, we turn to the dynamical characteristics of the plastic crystal as presented in Figs. 7d, 7e and 7f. Inspecting the mean-squared displacement, we find that the diffusion of charged disks in plastic crystal is greatly slower than for hard disks at the same density. Looking at the self-intermediate scattering functions at the peak of structure factor, , we also observe a two-step decay of with a large average relaxation time which confirms again that the relatively long-range electrostatic potential leads to a slow dynamics, similar to what is observed in Laponite suspensions Abou . This strong slowing down of translational dynamics is anticipated as a consequence of long-ranged positional order in plastic crystal. On the contrary, the rotational dynamics of the plastic crystal is not much influenced by electrostatic interactions and is only slightly slower than that of hard disks. This behavior shows that the disks can freely rotate in the plastic crystal.
-
•
Random stacks
The third structure with no long-ranged orientational order is that of random stacks. In this configuration, the orientations of the stacks are distributed in such a way that there is no net orientational order. Fig. 8a, 8b and 8c present an example of radial and orientational pair correlation functions and structure factor at and . The presence of stacks manifests itself in a sharply peaked corresponding to the average spacing of two disks in a stack. For the example shown here the stack spacing is about which also gives rise to a peak of structure factor obtained in the Fourier space . Integrations of over its first peak yields , confirming the stacked nature of the structure. We notice the presence of regularly spaced peaks up to distance which suggests that the number of disks in majority of stacks is less than 7. To verify this surmise, we determine the size distribution of stacks. Using the position of the first minimum of as a threshold for spatial correlations between particles, we could identify the different stacks and obtain their size distribution function as presented in Fig. 9a. We notice that the number of stacks of disks decreases exponentially with stack size, similar to what is observed in linear self-assemblies obtained by living polymerization LivingPolymer .
The orientational pair correlation attests the absence of long-range orientational order in this structure, although we observe a short-range orientational order at disks separations . This short-ranged order is succeeded by deep negative minima at distance and which are manifestations of competing effects of electrostatic potential and excluded volume interactions that result in T-shaped configurations of disks at such distances.
Examining the dynamics of random stacks shown in Figs. 8d, 8e and 8f, we find that both translational and rotational dynamics of charged disks in this structure are strongly slowed down compared to that of hard disks. The translational degrees of freedom still remain diffusive, whereas the orientational time correlation function decays only slightly over a time scale of the order of 1000 times the orientational relaxation time of an isolated disk. The observed slowing down of rotational diffusion is quite spectacular and is reminiscent of an orientational glass orGlass ; schilling , where translational degrees of freedom are liquid-like and the orientational degrees are frozen.

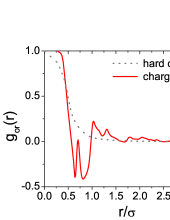
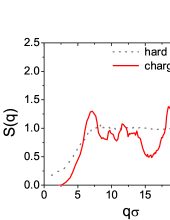
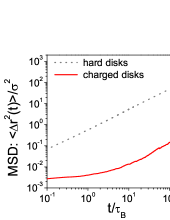
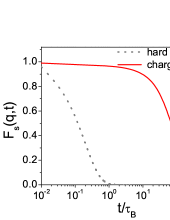
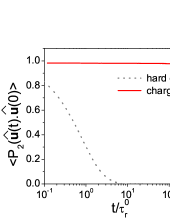
Figure 8: a) The radial pair distribution function , b) the orientational pair distribution function , c) structure factor , d) mean squared displacement , e) intermediate scattering function at f) orientational time correlation function shown for and , which forms a random stacks structure. -
•
Intergrowth texture
Now, we turn to the last structure with no net nematic order parameter, i. e. the novel structure of intergrowth texture. This structure consists of sets of aligned disks () interspersed with layers exhibiting anti-nematic order () antinem ; antinem1 and both types of layers share the same director. The intergrowth texture appears at ionic strengths and moderate densities just before orientational disorder-order transition of charged disks in the region where the hard disks are already in the nematic phase. In Fig. 10a, 10b and 10c, we have shown the positional and orientational correlation functions as well as structure factor for an example of such a texture at and . As can be noticed from these figures, there is no evidence of long-ranged positional and orientational order in this system, although, we can distinguish several overlapping consecutive peaks in which mark some degree of local ordering. The negative value of at shows that at such distances particles organize with relative T-shaped configurations.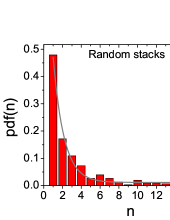
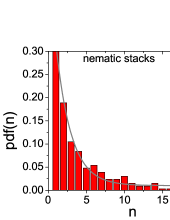
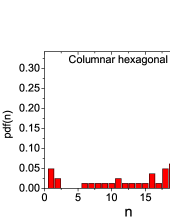
Figure 9: The probability distribution function of number of stacks or columns for a) random stacks structure and , with average stack size 2.85 b) nematic stacks and with average column length 4.1 c) columnar hexagonal structure and . The lines in panels a) and b) show the fit of the probability distribution function with an exponential form. To distinguish between nematic and anti-nematic layers, we identified the sets of aligned disks by finding disks whose orientations were correlated, i.e. , where is the angle between orientations of particles and . Then we calculated the nematic tensor of the set of aligned disks. The director obtained from the nematic tensor was used in a second step as a criterion to separate disks which made an angle with the director so that . We repeated this procedure iteratively, until the vector obtained for the director from two consequent steps converged. After separating the disks with nematic ordering, we calculated the nematic tensor for the set of remaining disks and we found out that these disks exhibit an anti-nematic ordering () and share the same director as the nematic set of disks. The well-defined separation between the nematic and anti-nematic layers is justified by examining the angular distribution of disks with respect to the common director as plotted in Fig. 10f. Here, we find that the disks are either aligned with the director (nematic) or their orientations are perpendicular to the director. This very original structure is indeed a manifestation of the anisotropic nature of screened electrostatic potential which disfavors coplanar configurations of disks. The disks, instead, opt out for anti-nematic ordering.
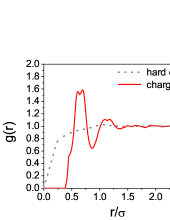
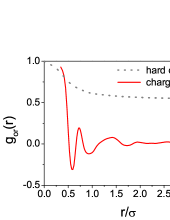
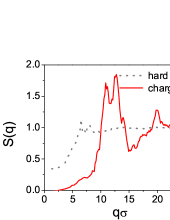
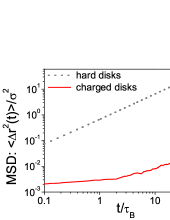
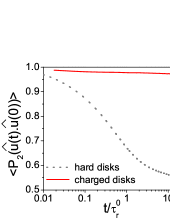
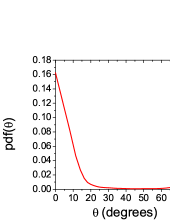
Figure 10: a) The radial pair distribution function , b) the orientational pair distribution function , c) the structure factor , d) mean squared displacement , e) orientational time correlation function shown for and , an intergrowth texture. f) Angular probability distribution function pdf, for where is the angle of the orientation vector of each disk with respect to the director of the nematic region. -
•
Nematic stacks
Having discussed the configurations with vanishing order parameters, we now focus on the orientationally ordered phases. Nematic stacks is the simplest orientationally ordered state with that appears at moderate to high ionic strengths for densities in the range . The non-zero value of is also reflected in which shows a non-decaying plateau for large distances as presented in Fig. 11b. However, the structure of the observed nematic phase is different from that of hard disks, as most of the disks are found to be in stack-like arrangements; see Fig. 3. This difference in structure from that of hard disks is also reflected in positional pair correlation function Fig. 11a and structure factor Fig. 11c which are sharply peaked at short distances and mark the presence of short-ranged stack-like spatial correlations. The average stacking distance obtained from for the example shown at and is . We have examined the positional pair correlation functions in directions parallel and perpendicular to the nematic director as presented in Figs. 11d and e. We notice that there is no long-range positional order in any of the directions, although a local ordering within the first few neighbors exists, an evidence of the presence of stacks. Furthermore, similarly to the case of random stacks, we have extracted the distribution function of stack sizes as presented in Fig. 9b. Here also, the number of stacks decreases exponentially with size; however, the average size of stacks is larger in the nematic phase than in the isotropic state of random stacks.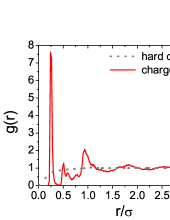
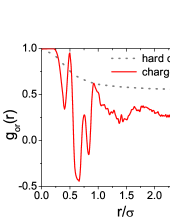
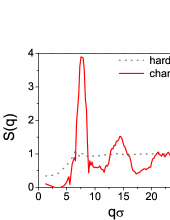
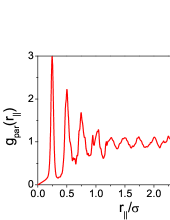
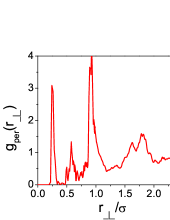
Figure 11: a) The radial pair distribution function , b) the orientational pair distribution function , c) the structure factor , d) spatial correlation function in the direction parallel to the director e) spatial correlation function in the direction perpendicular to the director shown for and , corresponding to nematic stacks structure. -
•
Columnar hexagonal
For larger densities, typically , both orientational and positional orders of the particles increase. Stacks of aligned disks become more organized and form regular columns arranged on a hexagonal lattice (see Fig. 3). Our qualitative observations have been confirmed by investigating both positional and orientational pair correlation functions as presented in Fig. 12 for an example at . The large value of plateau in reflects the large degree of orientational order at such high densities. The radial pair correlation function has a strong peak at very small distances and integration over this peaks gives un an average number of nearest neighbors which is consistent with columnar arrangement of disks at small separations. To examine the positional order of particles more closely, we inspect positional correlations in directions parallel and perpendicular to the director. The pair correlation function in direction parallel to the director in Fig. 12d shows almost equally spaced peaks which broaden with distance. This behavior represents a short-ranged liquid-like ordering of disks in the columns. The average distance between the disks in a column, i.e. intracolumnar spacing, is given by the position of the first peak, here .Although the disks have liquid-like order along the columns, i.e., in the parallel direction, they exhibit a strong crystalline order in the perpendicular directions as evidenced by the long-ranged positional order in . Indeed, the positions of the successive peaks in are related as , where is the lattice spacing of a 2D hexagonal lattice. In the typical example, and , shown in Fig. 12, which is smaller than one particle diameter, indicating that the disks are interdigitated, similar to the observed columnar structures for hard spherocylinders Marechal . The hexagonal nature of the lattice is also inspected by computing the hexagonal bond-orientational order parameter , (see Appendix B for its definition). For the given example, we obtained .
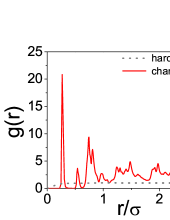
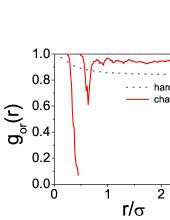
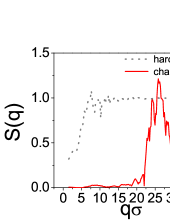
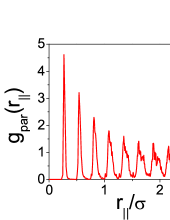
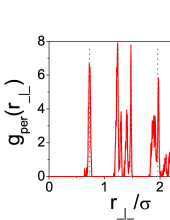
Figure 12: a) The radial pair distribution function , b) the orientational pair distribution function , c) the structure factor d) spatial correlation function in the direction parallel to the director e) spatial correlation function in the direction perpendicular to the director shown for and , corresponding to a columnar hexagonal structure. 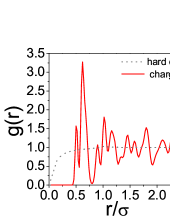
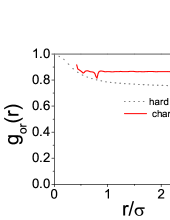
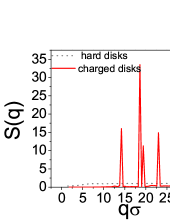
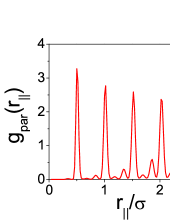
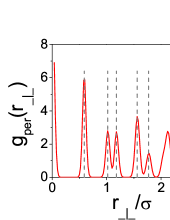

Figure 13: a) The radial pair distribution function , b) the orientational pair distribution function , c) the structure factor d) spatial correlation function in the direction parallel to the director e) spatial correlation function in the direction perpendicular to the director f) intercolumnar pair correlation function shown for and , corresponding to a hexagonal crystal. -
•
Hexagonal crystal
At rather low ionic strengths, at and for , where the electrostatic interaction potential is relatively long-ranged with a maximum anisotropy of 20 %, we observe a further enhancement of positional ordering. In this region, not only stacks of aligned disks form hexagonal columns, but also the disks within the columns are arranged in an ordered crystalline manner. In Fig. 13, we have displayed the positional and orientational correlation functions, structure factor as well as intracolumnar and intercolumnar correlation function and pair correlation in the direction perpendicular to the director for an example of such a structure, i.e., and . The strong degree of orientational ordering is demonstrated by a large value of the plateau in . The orientational order parameter in this system is . As can be noticed from and , a strong degree of positional order also exists. Similar to the columnar hexagonal phase, we observe a strong hexagonal ordering in the directions perpendicular to the director as confirmed by the position of successive peaks seen at distances with for this example. The lattice spacing smaller than one diameter, here again, points to the interdigitated nature of the columns. The regularly spaced peaks with the same width for demonstrate a strong degree of crystalline order of disks within the columns. The intracolumnar spacing in this case is . We also calculated the intercolumnar pair correlation functions for two adjacent columns with , similar to the one obtained for hard spherocylinders Cutos . The positions of the peaks give us the interdigitation displacement . A strong positional correlation between the disks in two adjacent columns confirms the crystalline nature of the phase, hence assessing that a hexagonal crystal is formed.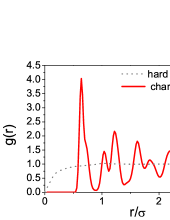
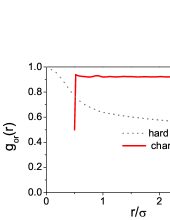
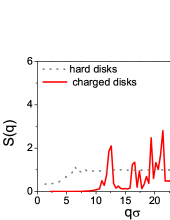
Figure 14: a) The radial pair distribution function , b) the orientational pair distribution function , c) the structure factor for and , corresponding to a BCC crystal. -
•
BCC crystal
At even lower ionic strengths where the interaction potential is almost isotropic () and for densities , another crystalline structure appears which has a BCC-crystal structure. An example of radial and orientational pair correlation functions and structure factor for such a structure is shown in Figs. 14a, 14b and 14c for and . Both positional and orientational pair correlation functions as well as structure factor reveal a strong degree of positional and orientational order. The peaks of are found at separations which can be identified with peak positions for a BCC-crystal, i.e. , and . Hence, from the positions of the peaks of , it is easily concluded that the structure is that of BCC crystal and the obtained orientational order parameter is .
IV.3 The influence of effective charge value on the structure
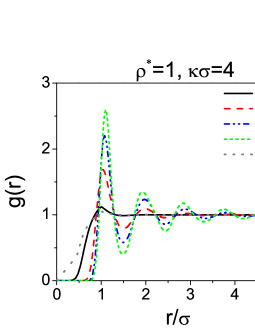
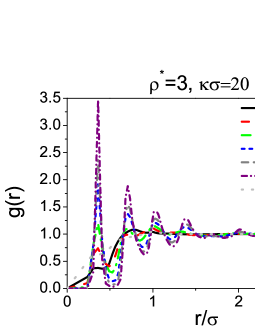
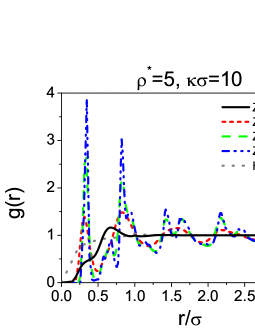
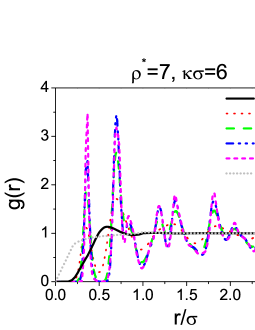
Having examined in detail the features of the various structures found for highly charged disks with , we now turn to the cases where . We present the results for the evolution of structure upon increasing charge for several densities and screening parameter values. As explained in Sec. III, the effective charge values were varied from relatively small values to for each and density starting from an initial configuration of equilibrated hard disks. In Fig. 15, we show the evolution of the radial pair distribution function with the effective charge for two isotropic structures, i.e., the isotropic fluid and the random stacks and two examples of liquid-crystalline phases, i.e. nematic stacks and columnar hexagonal structure. The general trend that we observe from all these examples is that upon increase of the effective charge, and consequently of the strength of repulsion, the particles, as expected, are excluded from the proximity of each other, i.e., the shortest distance for which is different from zero is shifted towards larger values. The second important effect is the appearance of peaks at well-defined positions in , different from the peak of for hard disks at , that become sharper with an increase of the effective charge. We also observe that for large densities, typically , the structural changes are less pronounced upon further increase of charge for .
We have also investigated the dependence of the nematic order parameter on , as depicted in Fig. 16 for two different values of . In the structures with vanishing , the nematic order parameter did not change with increase of charge for . For the orientationally ordered phases, again we notice that for , the nematic order parameter is not very sensitive to the value of . This is an important finding, because although the strength of interactions depends on the value of effective charge and size of particles, for sufficiently large effective charge values the observed structure is not a sensitive function of particle size. Therefore, we argue that although our simulations were performed for , the obtained phase diagram for are relevant for other sizes as well.
V Discussion and concluding remarks
We have studied the structure and dynamics of charged disks interacting with purely repulsive electrostatic forces. The electrostatic interactions in our model are accounted for via a two-body effective potential between disks, that is obtained from Poisson-Boltzmann theory. We find that anisotropic electrostatic interactions modify the disks arrangements and their dynamics immensely and lead to a rich phase behavior. The phases uncovered not only include the isotropic fluid and nematic phases observed for infinitely thin disks, but also comprise columnar hexagonal liquid crystalline, hexagonal, BCC crystalline phases and a novel phase of intergrowth texture. One germane feature of our phase diagram is the non-monotonic behavior of orientational disorder-order transition with ionic strength which results from the opposing effects of the decreasing potential range and the increasing amplitude of the anisotropy function, upon increasing ionic strength. Another important aspect of our study is the investigation of dynamical signatures of orientationally disordered states. We find that both translational and rotational dynamics slow down remarkably already in the isotropic phases at densities somewhat below the density of the orientational order-disorder transition.
Before discussing our results in the light of experimental data, a comment is in order. Our phase diagram highlights the importance of intrinsic anisotropy of the electrostatic potential between charged platelets and shows that the phase diagram of charged disks can not be obtained by a simple rescaling of particles dimensions from the phase diagram of hard spherocylinders Marechal or uniaxial ellipsoidal particles spheroids . Nevertheless in the limit of very low ionic strengths where the potential is isotropic, we observe the same trend as ellipsoidal particles with aspect ratios close to unity where the system goes from an isotropic fluid to a plastic crystal and finally an orientationally ordered crystal with FCC structure upon increase of density albeit with a different symmetry than the one observed for charged disks (BCC symmetry). For high ionic strengths, our phase diagram resembles the phase diagram of oblate spherocylinders Marechal at small aspect ratios where a transition from isotropic fluid to nematic phase and subsequently to a columnar hexagonal phase occurs. However, unlike the case of charged spheres where the electrostatic interactions lead simply to a shift of phase boundaries, here we can not deduce the phase behavior of charged disks from hard anisotropic colloids with similar symmetry. New phase of intergrowth texture arises as a result of original anisotropy of the potential that highlights the competing effects of anisotropy in shape and interactions.
Our phase diagram shows a good agreement with the phase behavior of most extensively studied charged colloidal platelets: Gibbsite, and Beidellite systems for which the repulsive interactions are predominant Scirep . Gibbsite and Beidellite both show an I/N transition for a wide range of ionic strengths, and platelet stacking is often observed in the nematic phase Gibphase ; Beidellite . Moreover, Gibbsite suspensions also display a columnar hexagonal liquid-crystalline phase. These features are well captured in our simulations. We provided a direct comparison of our phase diagram with experimental phase diagrams by replotting them as a function of density and Scirep and argued that, in spite of the presumably important effects of polydispersity, the two phase diagrams agree quite well for overlapping regions. Of course a more detailed and extended experimental study might shed some more light on this issue and taking into account the effects of polydispersity and other specific interactions in MC simulations would possibly lead to a closer agreement. Another evidence of predominance of repulsive electrostatic interactions on phase behavior of Gibbsite comes from measurements of long-time translational and rotational diffusion of isotropic suspensions of Gibbsite in DMSO gibdynamics . In good agreement with our findings, the experiments demonstrate a slow dynamics for both translational and rotational diffusion at densities well below the orientational disorder-order transition. These results give us a hint why we observe arrested states for some of the charged platelet systems such as Laponite and Montmorillonite at very low volume fractions.
Laponite is another system of charged platelets which has attracted a lot of attention because of its ability to form aging gel/glassy states at low volume fractions ()Laponite ; Sara-PRE2008 ; Wigner well below the I/N transition. The range of densities and ionic strengths investigated in experiments corresponds to and Sara-PRE2008 . At such low densities, in our phase diagram, we observe a solid-like state (plastic crystal) only at small . Interestingly, exploring the response of our plastic crystal, we observe a slow dynamics with a two-step relaxation similar to what is seen for Laponite suspensions Abou . This state could presumably only be glassy if polydispersity were considered as seen with a bidisperse system of point-like particles interacting with Yukawa potential Zaccarelli ; LiLi . Indeed, a Wigner glass at very low ionic strengths has been reported for Laponite suspensions Levitz ; Wigner . Upon further increase of ionic strength, we observe an ergodic repulsive isotropic liquid in the low-density region of our phase diagram which is at equilibrium unlike the aging Laponite suspensions. Therefore, our model system only based on repulsive interactions cannot fully explain the phase behavior of Laponite for larger ionic strengths, although we find that onset of slow dynamics shifts towards lower densities Scirep upon increase of ionic strength, similar to the trend observed for Laponite suspensions Sara-PRE2008 . This points to the possible relevance of attractions Ruzicka or other specific interactions in this system that need to be incorporated in our modeling to reproduce the aging phenomenon observed for Laponite suspensions.
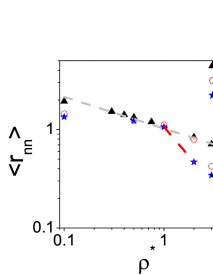
As another test of our model against experiments, we extracted the nearest-neighbor distance from the position of the first peak of . This quantity is a measure of average interparticle distance. It has been suggested that organization of highly anisotropic particles such as disks can be understood based on simple geometrical considerations baravian and for disks, the interparticle distance at low densities (volume fractions) should scale as and as at high densities. In Fig. 17, we have plotted as a function of density for several values of and 20. Interestingly, in the low density regime scales as , however, the high density regime does not follow and the exponent obtained for high densities is a function of , its value being and for and 20, respectively. This difference in the high density regime presumably arises from the fact that the experimental systems of Gibbsite and Beidellite are not equilibrated, and are trapped in arrested states.
In conclusion, numerical simulations of charged platelets, interacting with an effective potential of the
anisotropic screened Coulomb form, display a rich phase diagram that captures the generic features of charged colloidal platelet systems.
This study provides us with an insight about the influence of electrostatics on slowing down of dynamics, upon varying density and ionic strength.
The required procedure of slow charge increase, at moderate and high densities, echoes the difficulty for
experimental systems to reach thermodynamic equilibrium. Better agreement with experiments could arguably be achieved by
considering polydispersity, platelet flexibility, van der Waals attractions, and interactions specific to each system such as solvation forces.
The features brought to the fore here, though, can be considered as the non-specific effects pertaining to charged colloidal
platelets.
Appendix A Ewald sum for long-range Yukawa potential
In the limit the divergence in the third term in Eq. (4) is avoided by assuming a uniform background of opposite charge. This amounts to subtracting a term .
The self term is given by
| (5) | |||||
Again, in the presence of a uniform background, a term has to be subtracted.
In Eq. (4) , is the box length (assuming a cubic box) and denotes the complementary error function. The prime in the sum over , with , integers, restricts it to for . The parameter controls the convergence of the direct and Fourier space sums in (4). The sum in reciprocal space extends over all lattice vectors . If the -space contribution in the self energy is added to the reciprocal space term in Eq.(4), the former can be written
| (6) |
where
| (7) |
and denotes the complex conjugate.
In the present model, the interaction between two disks depends also on the orientation of each disk with respect to the interparticle distance. In that case the reciprocal space term in the energy cannot be factorized as in Eq. (6), but involves a triple sum over , , and , which would lead to prohibitively large computation times. In our calculations, we adopted a value of large enough that only terms with need to be retained in Eq. (4) but small enough that the energy from the direct term is the dominant contribution. We then neglected the Fourier space term. Of course, in the case of an angle-averaged potential the energy can be calculated exactly. We verified in the case of the isotropic potential that neglect of the Fourier space term had no measurable effect on the structural properties.
Appendix B Computed quantities
-
•
Radial pair distribution function : orientationally averaged pair distribution function that describes the correlation between the centers of disks whose distance is .
(8) The average number of nearest neighbors for a disk can be obtained from the integral of the radial distribution function over its first peak as
-
•
Structure factor that is related to the Fourier transform of as .
-
•
Orientational pair distribution functions and are defined as the statistical average of the second and fourth Legendre polynomial of azimuthal angle between the normal vectors of two disks,
(9) -
•
Nematic order parameter : is defined as the average of the largest eigenvalue of the second-rank tensor
(11)
The normalized eigenvector corresponding to the largest eigenvalue of gives us
the director that characterizes the direction of dominant orientation.
Quantities specific to orientationally ordered phases
These quantities are computed only for the samples with
-
•
Perpendicular pair-correlation function: is calculated for all pairs of disk centers whose distance perpendicular to the director lies on a cylinder of radius and thickness with its axis parallel to the director . was taken to be in our simulations.
(12) -
•
Parallel (columnar) pair-correlation function: is calculated for all pairs of disk centers inside a cylindrical volume parallel to with radius .
(13) -
•
Hexagonal bond-orientational order parameter: provides us the information about arrangement of disks in an hexagonal bidimensional lattice within a sheet of thickness perpendicular to the nematic director
(14) where
(15)
is the angle between the vector joining the centers of th and th particles and a fixed axis perpendicular to
the director and and give the lower and upper limits of the first peak of .
Thus correspond to a perfect hexagonal order in a sheet of thickness and would mean absence of any hexagonal order.
Dynamical quantities
-
•
Mean-squared displacement (MSD):
(16) where is obtained in terms of the number of MC steps.
-
•
Self-intermediate scattering function is defined as
(17) -
•
Orientational time correlation functions characterize the dynamics of orientational degrees of freedom of disks and are defined in terms of Legendre polynomials:
(18)
Acknowledgements.
We wish to acknowledge the support of Foundation Triangle de la Physique and IEF Marie-Curie fellowship. We are also grateful to A. Maggs, H. Tanaka and H. H. Wensink for fruitful discussions.References
- (1) E. Paineau, K. Antonova, C. Baravian, I. Bihannic, P. Davidson, I. Dozov, M. Impéror-Clerc, P. Levitz, A Madsen, F Meneau, L. J. Michot, J. Phys. Chem. B 113, 15858 (2009).
- (2) L.J. Michot, I. Bihannic, S. Maddi, S.S., Funari, C. Baravian, P. Levitz, and P. Davidson, Proc. Nat. Acad. Sci. USA 103, 16101 (2006).
- (3) B. Ruzicka, and E. Zaccarelli, Soft Matter 7, 1268 (2011).
- (4) S. Jabbari-Farouji, H. Tanaka, G. H. Wegdam, and D. Bonn, Phys. Rev. E. 78, 061405 (2008).
- (5) J.-C. P. Gabriel, C. Sanchez, and P. Davidson, J. Phys. Chem. 100, 11139 (1996).
- (6) A. Bakk, J.O. Fossum, G.J. da Silva, H.M. Adland, A. Mikkelsen, and A. Elgsaeter, Phys. Rev. E 65, 021407 (2002).
- (7) E. DiMasi, J.O. Fossum, T. Gog,, and Venkataraman, C. Phys. Rev. E 64, 220405 (2001).
- (8) N. Miyamoto, H. Iijima, , H. Ohkubo, and Y. Yamauchi, Chem. Commun., 46, 4166 (2010).
- (9) D. Sun, H.-J. Sue, Z. Cheng, Y. Martinez-Ratun, and E. Velasco, Phys. Rev. E 80, 041704 (2009).
- (10) M. C. D. Mourad, D. V. Byelov, A. V. Petukhov, D. A. Matthijs de Winter, A. J. Verkleij, and H. N. W. Lekkerkerker, J. Phys. Chem. B 113, 11604 (2009).
- (11) M. C. D. Mourad, D. V. Byelov, A. V. Petukhov, and H. N. W. Lekkerkerker, J. Phys.: Condens. Matter 20, 494201 (2008).
- (12) D. van der Beek, H. N. W. Lekkerkerker, Langmuir 20, 8582 (2004).
- (13) F. M. van der Kooij, K. Kassapidou, and H.N.W. Lekkerkerker, Nature, 406, 868 (2000).
- (14) S.Y. Liu, J. Zhang, N. Wang, W.R. Liu, C.G. Zhang, D.J. and Sun, Chem. Mater., 15, 3240 (2003).
- (15) A.B.D. Brown, and A.R. Rennie, Phys. Rev. E 62, 851 (2000).
- (16) A.F.Mejia, Z. Cheng and M.S. Mannan, Phys. Rev. E 85, 061708 (2012).
- (17) Z. Liu, R. Ma, M. Osada, N. Iyi, Y. Ebina, K. Takada, and T. Sasaki J. Am. Chem. Soc. 128 (14), 4872 (2006)
- (18) D. Yamaguchi, N. Miyamoto, T. Fujita, T. Nakato, S. Koizumi, N. Ohta, N. Yagi, and T. Hashimoto Phys. Rev. E 85, 011403 (2012).
- (19) N. Miyamoto, and T. J. Nakato, Phys. Chem. B, 108, 6152 (2004).
- (20) N. Miyamoto, N. and T. Nakato, Langmuir, 19, 8057 (2003).
- (21) T. Nakato, and N. Miyamoto, J. Mater. Chem., 12, 1245 (2002).
- (22) J.C.P. Gabriel, F. Camerel, B.J. Lemaire, H. Desvaux, P. Davidson, P. Batail, Nature, 413, 504 (2001).
- (23) S. Jabbari-Farouji, J.-J. Weis, P. Davidson, P. Levitz, and E. Trizac, Scientific Reports 3, 3559 (2013).
- (24) R. Agra, E. Trizac, L. Bocquet, Eur. Phys. J. E 15, 345 (2004).
- (25) C. Álvarez and G. Téllez, J. Chem. Phys 133, 144908 (2010).
- (26) D. G. Rowan, J.-P. Hansen, E. Trizac, Mol. Phys. 98, 1369 (2000).
- (27) A-P. Hynninen and M. Dijkstra, Phys. Rev. E. 68, 021407 (2003).
- (28) L. Morales-Anda, H. H. Wensink, A. Galindo, and A. Gil-Villegas, J. Chem. Phys. 132, 034901 (2012).
- (29) E. Trizac, L. Bocquet, M. Aubouy, Phys. Rev. Lett. 89, 248301 (2002).
- (30) L. Bocquet, E. Trizac, M. Aubouy, J. Chem. Phys. 117, 8138 (2002).
- (31) M. P. Allen and D. J. Tildesley, Computer Simulation of Liquids (Oxford University Press, Oxford, 1987).
- (32) D. Frenkel and B. Smit, Understanding Molecular Simulation: From Algorithms to Applications (Academic Press, 2001), 2nd ed.
- (33) Salin and J.M. Caillol, J. Chem. Phys. 113, 10459 (2000).
- (34) S. Kirkpatrick, C. D. Gelatt and M. P. Vecchi, Science 20 (4598) 671 (1983).
- (35) S. Jabbari-Farouji and E. Trizac, J. Chem. Phys. 137, 054107 (2012).
- (36) Another point should be added. The free energy calculation route for this model, by thermodynamic integration, would face the difficulty that there are no convenient reference states for which the free energies are accurately known.
- (37) R. van Roij, M. Dijkstra, and J. P. Hansen, Physical Review E 59, 2010-2025 (1999).
- (38) L. Belloni, J. Phys.: Condens. Matt. 12, R549 (2000).
- (39) J. Dobnikar, R. Castaneda-Priego, H.H. von Grünberg, E. Trizac, New Journal of Physics 8, 277 (2006).
- (40) A. R. Denton, J. Phys.: Condens. Matter 22, 364108 (2010).
- (41) R. Eppenga and D. Frenkel, Molecular Physics 52, 1303 (1984).
- (42) L. Harnau, Mol. Phys. 106, 1975 (2008).
- (43) H. M. Lindsay and P. M. Chaikin, J. Chem. Phys. 76, 3774 (1982).
- (44) B. Abou, D. Bonn, and J. Meunier, Phys. Rev. E 64, 021510 (2001).
- (45) P. van der Schoot, Supramolecular Polymers, 2nd ed. (CRC, 2005), Chap. 2, 77-106.
- (46) Z. Zheng, F. Wang, and Y. Han, Phys. Rev. Lett. 107, 065702 (2011).
- (47) M. Letz, R. Schilling, and A. Latz, Phys. Rev. E 62, 5173 (2000).
- (48) K. Sokalski and Th.W. Ruijgrok, Physica A 126, 280 (1984).
- (49) I. A. Georgiou, P. Ziherl, and G. Kahl, EPL 106, 44004 (2014).
- (50) M. Marechal, A. Cuetos, B. Martinez-Haya, and M. Dijkstra, J. Chem. Phys. 134, 094501 (2011).
- (51) A. and B. Martinez-Haya, J. Chem. Phys. 129, 214706 (2008).
- (52) G. Odriozola, J.Chem. Phys. 36, 134505 (2012).
- (53) P. Levitz, E. Lecolier, A. Mourchid, A. Delville and S. Lyonnard, Europhys. Lett. 49 (5), 672 (2000).
- (54) D. Kleshchanok, P. Holmqvist, J.-M. Meijer and H. N. W. Lekkerkerker, J. Am. Chem. Soc. 134, 5985 (2012).
- (55) D. Kleshchanok, M. Heinen, G. Nägele, and P. Holmqvist, Soft Matter 8, 1584 (2012).
- (56) C. Baravian, L. J. Michot, E. Paineau, I. Bihannic, P. Davidson, M. Impéror-Clerc, E. Belamie and P. Levitz, Europhys. Lett. 90 36005 (2010).
- (57) J. M. Caillol, F. Lo Verso, E. Schöll-Paschinger, and J.-J. Weis, Mol.Phys. 105, 1813 (2007).
- (58) D. Bonn, D., H. Tanaka, G. Wegdam, H. Kellay, and J. Meunier, Europhys. Lett. 45, 52–57 (1998).
- (59) E. Zaccarelli, S. Andreev, F. Sciortino and D. R. Reichman, Phys. Rev. Lett. 100, 195701 (2008).
- (60) B. Ruzicka, E. Zaccarelli, L. Zulian, R. Angelini, M. Sztucki, A. Moussaid, T. Narayanan, and F. Sciortino, Nature Materials 10, 56 (2011).
- (61) Li Li, L. Harnau, S. Rosenfeldt, and M. Ballauff, Phys. Rev. E 72, 051504 (2005).
List of symbols
-
•
: number of particles in the simulation box of size ;
-
•
: disk diameter;
-
•
: number of Monte Carlo cycles, where a cycle is defined as one trial move for translational and rotational displacements of the N particles;
-
•
: number density of disks; is the dimensionless density ;
-
•
: surface charge density of disks;
-
•
: Bjerrum length;
-
•
: effective charge of disks seen from far distance and ;
-
•
: screening parameter defined as where and are the density of ions of type and their corresponding charge, respectively;
-
•
: the pair interaction between two charged disks;
-
•
: the orientation of th disk (normal to the plate) ;
-
•
: the angle of orientation of th disk with a line that connects the center of this disk to the center of another disk;
-
•
: orientational (nematic) order parameter;
-
•
: hexagonal bond-orientational order parameter;
-
•
: Brownian time-scale, the time required for diffusing over a distance equal to particle diameter;
-
•
: the first order relaxation time of an isolated particle, for disks ;
-
•
: modulus of the scattering vector;
-
•
: the self-intermediate scattering function;
-
•
: nearest-neigbor distance.