A connection between accretion state and Fe K absorption in an accreting neutron star: black hole-like soft state winds?
Abstract
High resolution X-ray spectra of accreting stellar mass Black Holes reveal the presence of accretion disc winds, traced by high ionisation Fe K lines. These winds appear to have an equatorial geometry and to be observed only during disc dominated states in which the radio jet is absent. Accreting neutron star systems also show equatorial high ionisation absorbers. However the presence of any correlation with the accretion state has not been previously tested. We have studied EXO 0748-676, a transient neutron star system, for which we can reliably determine the accretion state, in order to investigate the Fe K absorption/accretion state/jet connection. Not one of twenty X-ray spectra obtained in the hard state revealed any significant Fe K absorption line. However, intense Fe xxv and Fe xxvi (as well as a rarely observed Fe xxiii line plus S xvi; a blend of S xvi and Ar xvii; Ca xx and Ca xix, possibly produced by the same high ionisation material) absorption lines (, eV) are clearly detected during the only soft state observation. This suggests that the connection between Fe K absorption and states (and anticorrelation between the presence of Fe K absorption and jets) is also valid for EXO 0748-676 and therefore it is not a unique property of black hole systems but a more general characteristic of accreting sources.
keywords:
Neutron star physics, X-rays: binaries, absorption lines, accretion, accretion discs, methods: observational, techniques: spectroscopic1 Introduction
The advent of the new generation of X-ray telescopes yielded a burst of detections of highly ionised absorption Fe features (e.g. Fe xxv and Fe xxvi) in low mass X-ray binaries harbouring both black holes (BH) and neutron stars (NS) (Brandt et al. 2000; Lee et al. 2002; Parmar et al. 2002; Jimenez-Garate et al. 2003; Boirin et al. 2003; 2004; 2005; Ueda et al. 2004; Miller et al. 2006a, b). In NS, at first, it has been realised that such features seems to be detected only in dipping - high inclination - sources (Diaz-Trigo et al. 2006). The same has also proven to be true in BH systems (Ponti et al. 2012), therefore implying an equatorial geometry of these absorbers.
More recently, high resolution observations of BH systems showed that these absorption features have significant outflow velocities, and therefore are thought to be the signature of equatorial winds. The estimated wind mass outflow rates are generally of the order or higher than the mass accretion rates (Lee et al. 2002; Ueda et al. 2004; Neilsen et al. 2011; Ponti et al. 2012), suggesting that these winds are a fundamental ingredient in the accretion process. Another key aspect is that they are observed primarily in the so-called soft states (see Belloni et al. 2011 for a recent review on X-ray states), when the accretion flow can be, at least, partially described by an optically thick, geometrically thin disc (Shakura & Sunyaev 1973) and the radio jet is quenched (Fender et al. 2004). Consequently, these winds are not observed during hard states, characterised by a strong Comptonisation component and stable radio emission from a compact jet. These observational facts suggest a deep link between the presence of an equatorial disc wind and the accretion disc state and/or the jet (Neilsen & Lee 2009; Ponti et al. 2012).
NS systems are also known to display several X-ray states. In particular, when accreting at low to moderate rates ( LEdd), these are in many aspects analogous to the hard and soft states observed in BH (see van der Klis 2006). They are also observed to alternate following marked hysteresis patterns (Muñoz-Darias et al. 2014) and to be similarly connected with the presence/absence of the (radio) jet (Migliari & Fender 2006). Although the Fe K absorbers in NS show similar properties to BH systems (e.g. Fe K lines equivalent widths, absorber ionisation states, equatorial geometries; Diaz-Trigo & Boirin 2013), an outstanding question is whether the same state-wind connection applies for accreting neutron stars too. To test this, high quality observations of a high inclination NS system showing both hard and soft states are needed.
EXO 0748-676 (=UY Vol) is a neutron star low mass X-ray binary discovered in outburst by EXOSAT in 1985 (Parmar et al. 1985). It was active for 23 years, until it finally returned to quiescence in 2008 (Hynes & Jones 2008). The system showed both absorption dips and eclipses implying a high orbital inclination. Assuming a primary mass of M⊙ (see Muñoz-Darias et al. 2009 and Ratti et al. 2012 for dynamical studies) an inclination of was estimated by modelling the X-ray light-curve (Parmar et al. 1985, 1986).
EXO 0748-676 shows a variety of absorption and emission components. The strongest are neutral and photo-ionised absorption features (Jimenez-Garate et al. 2003; Diaz-Trigo et al. 2006; van Peet et al. 2009), with their column densities increasing and ionisation parameters decreasing during dips. In addition, collisionally ionised absorbers and Oxygen emission lines have also been detected (van Peet et al. 2009).
2 Observations and data reduction
XMM-Newton: We use archival XMM-Newton data starting from the Observation Data Files (ODF). They were processed with the MPE development version 13.5.0 of the XMM-Newton Science Analysis System (SAS), applying the most recent calibrations. For each spectrum, the response matrix and effective area has been computed with the tasks rmfgen and arfgen. Because of the higher effective area in the Fe K band, we use only the data from the EPIC-pn camera. Up to 14-02-2013 there are 21 observations, publicly available in the XMM-Newton archive (Tab. 1), pointed at EXO 0748-676 and with EPIC-pn clean exposure longer than 2 ks. We summed the spectra and response matrices of the consecutive short (3-5 ks) observations accumulated during revolution 212 to increase the signal-to-noise.
Several observations in imaging mode were affected by photon pile-up (Tab. 1). Whenever significant pile-up is detected, we use an annular extraction region centred on the source, with inner radius of and outer radius of (see e.g. van Peet et al. 2009), otherwise a circular region with radius is used. The background was selected from a region of similar size and shape and on the same detector chip as the source region.
In order to identify and remove type I bursts from the analysis we used a 3 s resolution hard X-ray light curve ( keV) since this energy band is only marginally affected by dipping (Diaz-Trigo et al. 2006; van Peet et al. 2009). In the same way, but with 15 s time bins, we selected the eclipses starting and ending times. The thresholds applied are reported in Tab. 1. We then identified the periods of enhanced particle activity by calculating the full detector light curve (once excluded the events within a 2.5 arcmin region from the target) in the 12-15 keV band. Intervals with count rate higher than the threshold (varying according to the observing mode and source brightness) specified in Tab. 1 were consequently filtered out. Finally, to separate dipping and persistent emission, we divide the keV light curve by the keV one, since absorption dips are revealed by sudden increases in the hardness ratio. Following van Peet et al. (2009) we determined the average hardness ratio of the intervals clearly belonging to the persistent emission and selected as dipping the periods with hardness ratios 1.5 times larger than the persistent value. After applying the particle background cut and the removal of bursts and eclipses, we extracted, for each observation, a source and background spectrum for both the persistent and dipping periods (see Tab. 1).
For the only observation in timing mode (Tab. 1), the source photons were selected from a region within rawx = 22 and rawx = 54 and background photons within rawx = 1 and rawx = 17111For comparison and to investigate further the reliability of the energy scale of the EPIC-pn instrument, we also analysed the mos2 data. We selected the source photons within rawx = 282 and 331 and the background photons within rawx = 257 and 280. The same GTI used for the pn are used. We also reduced (and produced spectra and response matrices of) the RGS data with the sas command rgsproc. . The calibration of the energy scale of the EPIC cameras in timing mode is difficult. Uncertainties of the order of several eV can be observed (see the XMM-Newton Calibration Technical Note 0083; Guainazzi et al. 2012). Following the recommendation of the EPIC calibration team, we apply the X-ray loading correction (not default in version 13.5.0 of the sas) to obtain the best possible energy scale. We are aware that an uncalibrated energy scale produces spurious features at the energies of the mirror edges. However, the effective area above 2.5 keV, and in particular in the Fe K band, shows no strong edge. Therefore, we focus our analysis on the 2.5-10 keV band only.
Chandra: We reduced the data in a standard manner (see Ponti et al. 2012 for details) using version 4.4 of the ciao analysis package. We started from the evt1 file, accepted only the standard event grades from the nominal good time intervals and excluded bad pixels. Because of the superior effective area and energy resolution at the Fe K complex energy, we analyse only the heg data.
Suzaku: The Suzaku xis event files were processed using the standard pipeline (aepipeline version 1.0.1) with the calibration files available (2013-01-10 release), using the ftools package of lheasoft version 6.13 and adopting the standard filtering criteria. Source and background spectra were extracted from circular regions (”), centred on, and away from the source, respectively. Response matrices and ancillary response files were produced with xisrmfgen and xissimarfgen tools. Only the data from the xis0 and xis3 instruments were used.
RXTE: We used all (707) the observations taken by Rossi X-ray Timing Explorer to monitor the status of the source at a given time (see Fig. 1). The RXTE-PCA Standard 2 mode (STD2) was used for the production of count-rates and colours. It covers the 2–60 keV energy range with 129 channels. For each observation net count rate corresponds to STD2 channels 0–31 (2–15 keV). For the state classification (see below) we defined a hardness222Ratio of counts between the channels 20–33 (10–16 keV) and 11–19 (6–10 keV), respectively. and computed power density spectra (PDS; see Belloni et al. 2006) and the root-mean-square (rms) variability following Muñoz-Darias et al. (2011).
All the fits were performed using the Xspec software (version 12.7.0). The errors and upper limits are reported at the 90 per cent confidence level for one interesting parameter.
3 State classification
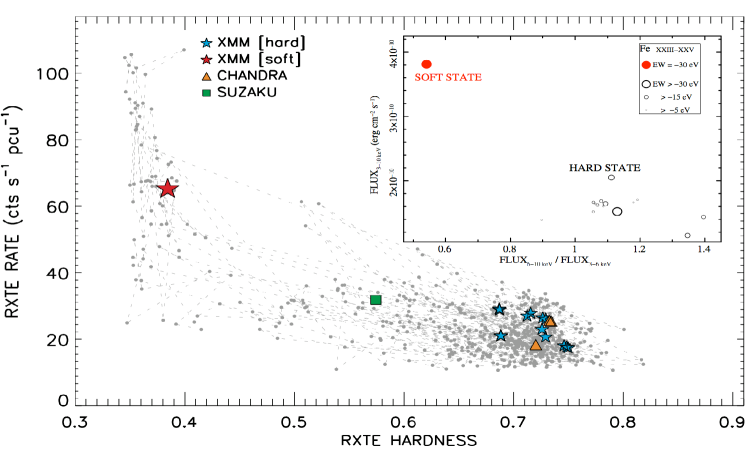
Our RXTE analysis of EXO 0748-676 is part of a contemporaneous study on a large sample of accreting NS for which the long-term X-ray behaviour is being investigated in detail using X-ray colours and variability (Muñoz-Darias et al. 2014). Figure 1 shows the RXTE Hardness Intensity Diagram (HID) using all the data available (one point per observation). During its 23 years-long outburst EXO 0748-676 behaved as a persistent source accreting at low-to-moderate rates (% LEdd). It stayed most of the time in the hard state, but displayed a number of transitions to brighter and softer states, when the fast variability (fractional rms; not shown here) also dropped from to %, as observed in other sources of its class (Muñoz-Darias et al. 2014) and in black hole systems. In Fig. 1 we have indicated the (RXTE) hardness and count-rate values at the times of the Suzaku, Chandra and XMM-Newton hard state observations as a green square, orange triangles and blue stars, respectively. The red star corresponds to the only soft state XMM-Newton observation. To do this, we used measurements from simultaneous RXTE data (as in the case of the soft observation) or we interpolated the closest in time. In the latter case, we also checked the 1 day RXTE-All Sky Monitor light-curve to ensure that no flux increase (i.e. suggesting a transition to the soft state) occurred at that time. As a definitive proof of the above, we show in the inset of Fig. 1 the HID directly extracted from all the XMM-Newton, Chandra and Suzaku observations included in the analysis. The total flux is computed over the 3-10 keV band and the X-ray colour displayed as the ratio between the fluxes in the range 6-10 keV and the 3-6 keV.
4 Soft state spectrum
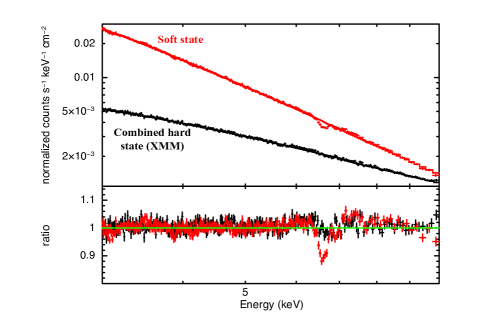
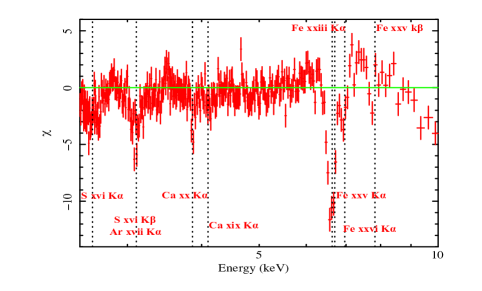
All the XMM-Newton spectra included in this work can be seen in Fig. 2. We show in red the source spectrum during the soft state observation (Tab. 1), while the combined spectrum of all hard state observations is plotted in black. Because we are mainly interested in the Fe K band and to avoid calibration related issues at the energies of the edges in the mirrors effective area, we solely fit the data over the 2.5-10 keV band. We started by using a power law (powerlaw in Xspec) model absorbed by neutral material (pha). This resulted in an unacceptable fit ( for 1496 dof), due to clear and intense absorption lines that are present at the energies of Fe xxiii-xxv and Fe xxvi transitions and at lower energies (see Fig. 2 and 3). Therefore, we added a Gaussian line that significantly improved the fit ( for 3 new free parameters, F-test probability ). The line energy is keV, with a width eV and an equivalent width eV. We note that the line energy is formally not consistent with the Fe xxv K line transition ( keV), suggesting a contribution by a blend of the rarely observed Fe xxiii K and Fe xxiv K lines333The energies of the Fe xxiii and Fe xxiv transitions with the highest oscillator strength () are: (); (0.15); (0.47) and keV (0.11) (Bianchi et al. 2005).. We then add a second Gaussian line to fit the Fe xxvi K transition (we assume it has the same width as Fe xxv). The fit significantly improves ( for 2 new parameter, F-test probability of ). The Fe xxiii-xxv and Fe xxvi lines energies are now keV and keV and their equivalent widths are eV and eV, respectively. The lines appear resolved and to have a width of eV.
Significant residuals are still present around , 3.1 and keV (see Fig. 3). Therefore we add other four absorption lines (with width equal to the Fe xxiii-xxv one). Each of these lines is significant with associated F-test probabilities of , , and . The line energies are: , , and keV, thus they are consistent with being produced by S xvi K; a blend of S xvi K and Ar xvii K; Ca xx K and Ca xix K. The line equivalent widths are: , , and eV. This phenomenological model composed by a power-law continuum absorbed by neutral material plus six Gaussian lines in absorption, produces an acceptable fit with for 1483 dof. However, we note that an excess of emission is still present in the Fe K band, possibly associated with either a not-modelled ionised Fe K edge or a broad Fe K emission line. The best fit power law spectral index is . The very steep spectral index suggests that an un-modelle d disc black body component (as well as, possibly, the boundary layer; e.g. Lin et al. 2007) might give a significant contribution at the lowest energies considered here. The 3-10 and 6-10 keV observed source fluxes are and erg cm-2 s-1, respectively.
The observation of satellite lines due to Fe xxiii-xxiv is quite unusual. Alternative hypothesis are that either the line at keV is associated to the Fe xxv transition, but produced by inflowing matter, or that the energy mismatch might reflect a calibration problem. We do observe the same energy of the line ( keV, but unresolved eV) in the mos2 spectrum. However, both the EPIC cameras are in timing mode, thus they could be affected by the same calibration problems. To check if this might be the case, we observe that the ionised absorption component fitting the 2.5-10 keV band (with cm-2 and ; see §5) is expected to produce also low energy lines, such as O viii at 653.6 eV. Indeed, we do detect this line in the RGS spectrum. The line energy (after fitting the continuum with a power law model in the narrow energy band between 0.6 and 0.7 keV) is E eV and unresolved eV. No significant red-shift of the line is observed. If indeed the O viii line is produced by the same material producing the Fe K lines, this suggests no inflow of the absorbing material with both a significant contribution from the Fe xxv inter-combination line plus a blend of the Fe xxiii and Fe xxiv lines.
Finally, to check for any dependence of the ionised absorber with the orbital phase, flux level and-or strength of the dipping phenomenon, we divided the light curve both in 4 time intervals corresponding to different orbital phases, in 3 flux levels and in persistent and dipping intervals and fitted them separately. We do not observe any significant variation in the Fe xxiii-xxv and Fe xxvi lines (when fitted with Gaussian lines) or in the ionisation parameters and/or column density of the photo-ionised absorber (see §5).
5 Comparison to the hard state
The black data in Fig. 2 show the combined spectra of all the hard state XMM-Newton observations. Each hard state spectrum is fitted separately by a power law model (normalisation and spectral index are left free to vary, see Tab. 1) absorbed by neutral material (pha), but with the residuals combined for displaying purposes. As previously reported (Diaz-Trigo et al. 2006), no strong Fe xxiii-xxv or Fe xxvi absorption line is observed in any of the hard state spectra both during the persistent or dipping periods. In fact, we add to the model two narrow ( eV) Gaussians to search for the presence of any Fe xxv or Fe xxvi lines (the energies of the Gaussians have been fixed to 6.7 and 6.97 keV, the energies of the expected transition). From them, we only find upper limits as stringent as eV for both lines in each observation (see Tab. 1 and Fig. 1).
Can this difference be simply due to an ionisation effect? The source persistent (out of dips) luminosity in the 0.5-1 keV band is about 5-10 times higher during the soft compared to the hard state observations. The luminosity at 7 keV is, instead, less than a factor of 2 higher. Therefore, if exactly the same material (creating the dips and the high ionisation absorption) is along the line of sight during both states, ionisation effect must be at play having a significantly higher ionisation parameter during the soft state observation. Inspecting the light curves, we note that the dipping phenomenon in the 0.5-5 keV energy band appears less intense during the soft state observation, in line with a possible reduction in the opacity induced by increased ionisation and thus lowering the effect of the dips in the soft X-ray light curve444The dipping phenomenon is known to be erratic, thus this might be simply a coincidence, or a consequence of a tilted accretion disc (Diaz-Trigo et al. 2009) or the product of the state change. In fact, the high inclination line of sight towards EXO 0748-676 might be intercepting a larger fraction of the disc atmosphere during hard states, characterised by thick discs, compared to soft states.. To investigate the effect of the observed luminosity variation on the appearance of the Fe xxiii-xxv and Fe xxvi lines, a full characterisation of the various absorbing components, taking into account the broad band source spectral energy distribution, would be important. Such a study is beyond the scope of this paper. However, to have an order of magnitude estimate, we have performed a phenomenological fit of the soft state spectrum, substituting the six narrow lines with a photoionised absorption component (modelled with the zxipcf component in Xspec; Reeves et al. 2008; zxipcf*pha*powerlaw). This, indeed, provides a reasonable fit ( for 1494 dof), suggesting a common origin for these lines. We note that this crude model is able to reproduce most of the absorption structures (it just leaves residuals at lower energies compared to the Fe xxiii line, possibly due to uncertainties in our knowledge of the oscillator strength for these rarely observed transitions) and most of the curvature of the continuum. The best fit column density of the ionised layer (assumed to be totally covering the X-ray source) is cm-2, having an ionisation parameter . The column density of the neutral absorber is cm-2. Given the narrow energy band used here, this value is not very reliable (e.g. Diaz-Trigo et al. 2006 found, fitting the entire energy band, cm-2).
Using this best fit model as a baseline, we perform a simulation of a hard state spectrum. We reduced the ionisation parameter of the zxipcf component by in (as a consequence of the lower luminosity at keV) from to and simulated the spectrum and then fitted the Fe K absorption lines. We find that even at this lower ionisation parameter and luminosity, characteristic of the hard state, two intense Fe K absorption lines at keV and , with widths keV and eV and EW of and eV, should be observed. The presence of such lines in the hard state is excluded by our observations. This suggests that the presence of Fe xxiii-xxv and Fe xxvi absorption lines during the soft state is not simply due to ionisation effects but requires an additional mechanism. However this inference will remain tentative until these results will be tested via ad-hoc photo-ionised absorption models computed on the basis of the source spectral energy distribution.
6 Discussion
We have observed Fe K absorption in EXO 0748-676 during the soft state, while only upper limits are observed during the hard state observations. This behaviour resembles what is seen in BH systems (Ponti et al. 2012). A previous work by Diaz-Trigo et al. (2006) studied the Fe K absorption features in a sample of dipping-high inclination neutron star systems. The authors found that the strongest (with eV, such as observed here for the first time in EXO 0748-676) absorption lines in the spectra of these systems are Fe xxv and Fe xxvi. Out of the seven sources in their sample, only EXO 0748-676 and 4U 1746-371 did not show any Fe K absorption lines. The authors suggests that the lack of Fe xxv and Fe xxvi features in EXO 0748-676 might be due to a peculiar continuously-dipping phenomenon. We report here that during the hard state observations (ObsID: 402092010 and 0160760401) EXO 0748-676 clearly shows periods of persistent emission with no evidence of dips, but still, no Fe xxv and Fe xxvi features are observed. Alternatively, the authors suggest that for EXO 0748-676 the highly ionised material is clumpy and located at the outer edge of the accretion disc, while being more distributed for the other sources. We investigated the dependence of the absorption with orbital phase, but we did not find any.
As EXO 0748-676 is a calibration source, more than 20 observations have been gathered during the past decade. Analysing this wealth of data, we discovered intense Fe xxiii-xxv and Fe xxvi absorption lines during the only observation in the soft state. We note that the soft state observation is characterised by higher soft and hard X-ray luminosities and a lowering of the intensity of dipping phenomenon in the 0.5-5 keV band. A correlation (anti-correlation) is well known between the amplitude of the dips and the absorber column density (the absorber ionisation parameter) valid for dipping neutron stars (Boirin et al. 2005; Diaz-Trigo et al. 2006). In particular, the persistent emission shows the most ionised absorbing component. We observe the soft state luminosity ( keV) to be higher than that of the hard state one (even if by less than a factor of two), thus ionisation effects must be at play. However, they do not appear to be enough to explain the large variation in ionisation state required to generate the Fe xxiii-xxv and Fe xxvi absorption lines from the low ionisation material producing the dips.
We note a remarkable similarity in the properties of high ionisation Fe K absorption in NS and BH systems. They both show Fe K lines with similar equivalent widths ( eV), primarily in high inclination-dipping sources (Diaz-Trigo et al. 2006; Ponti et al. 2012), indicating a similar equatorial geometry. However, an important observational difference is related to the motion of the absorbers, generally observed to be outflowing in BH, while being at rest in several NS. Unfortunately, the lack of high resolution grating data during the soft state of EXO 0748-676 does not allow us to reliably measure the outflow velocity of the Fe K absorption lines, and thus to prove if these features are signatures of a disc wind or not. We also note that recent studies of BH systems discovered a deep link between the presence of winds and the state of the accretion disc (Neilsen & Lee 2009; Ponti et al. 2012), suggesting that these winds are a fundamental ingredient in the accretion process. The observation of intense Fe K absorption features during the soft states of EXO 0748-676 suggests that the state/wind connection (wind/jet anti-correlation), valid for BH, does hold also in this source, and by extension in accreting NS in general (Ponti et al. 2014).
Acknowledgments
The authors wish to thank S. Bianchi, M. Guainazzi, M. Freyberg, F. Haberl, T. Dwelly, and D. Plant for useful discussion. GP and TMD acknowledge support via an EU Marie Curie Intra-European fellowship under contract no. FP-PEOPLE-2012-IEF-331095 and FP-PEOPLE-2011-IEF-301355, respectively. This project was funded in part by European Research Council Advanced Grant 267697 ”4 sky: Extreme Astrophysics with Revolutionary Radio Telescopes”.
References
- Belloni et al. (2006) Belloni, T., Parolin, I., Del Santo, M., et al. 2006, MNRAS, 367, 1113
- Belloni et al. (2011) Belloni, T. M., Motta, S. E., & Muñoz-Darias, T. 2011, Bulletin of the Astronomical Society of India, 39, 409
- Bianchi et al. (2005) Bianchi, S., Matt, G., Nicastro, F., Porquet, D., & Dubau, J. 2005, MNRAS, 357, 599
- Brandt & Schulz (2000) Brandt, W. N., & Schulz, N. S. 2000, ApJ, 544, L123
- Boirin et al. (2005) Boirin, L., Méndez, M., Díaz Trigo, M., Parmar, A. N., & Kaastra, J. S. 2005, A&A, 436, 195
- Boirin et al. (2004) Boirin, L., Parmar, A. N., Barret, D., Paltani, S., & Grindlay, J. E. 2004, A&A, 418, 1061
- Boirin & Parmar (2003) Boirin, L., & Parmar, A. N. 2003, A&A, 407, 1079
- Díaz Trigo et al. (2006) Díaz Trigo, M., Parmar, A. N., Boirin, L., Méndez, M., & Kaastra, J. S. 2006, A&A, 445, 179
- Díaz Trigo et al. (2009) Díaz Trigo, M., Parmar, A. N., Boirin, L., et al. 2009, A&A, 493, 145
- Díaz Trigo & Boirin (2013) Díaz Trigo, M., & Boirin, L. 2013, Acta Polytechnica, 53, 659
- Fender et al. (2004) Fender, R. P., Belloni, T. M., & Gallo, E. 2004, MNRAS, 355, 1105
- Guainazzi et al. (2012) Guainazzi, M., et al., 2012, XMM-SOC-CAL-TN-0083 http://xmm.vilspa.esa.es/external/xmm_sw_cal/calib/documentation.shtml
- Hynes & Jones (2008) Hynes R., Jones E., 2008, ATel, 1816, 1
- Lin et al. (2007) Lin, D., Remillard, R. A., & Homan, J. 2007, ApJ, 667, 1073
- Jimenez-Garate et al. (2003) Jimenez-Garate, M. A., Schulz, N. S., & Marshall, H. L. 2003, ApJ, 590, 432
- Lee et al. (2002) Lee, J. C., Reynolds, C. S., Remillard, R., et al. 2002, ApJ, 567, 1102
- Migliari & Fender (2006) Migliari, S., & Fender, R. P. 2006, MNRAS, 366, 79
- Miller et al. (2006) Miller, J. M., Raymond, J., Homan, J., et al. 2006, ApJ, 646, 394
- Miller et al. (2006) Miller, J. M., Raymond, J., Fabian, A., et al. 2006, Nature, 441, 953
- Muñoz-Darias et al. (2009) Muñoz-Darias, T., Casares, J., O’Brien, K., et al. 2009, MNRAS, 394, L136
- Muñoz-Darias et al. (2011) Muñoz-Darias, T., Motta, S., & Belloni, T. M. 2011, MNRAS, 410, 679
- Muñoz-Darias et al. (2014) Muñoz-Darias, T., Fender, R. P., Motta, S., & Belloni, T. M., MNRAS in press (arXiv:1407.1318)
- Neilsen & Lee (2009) Neilsen, J., & Lee, J. C. 2009, Nature, 458, 481
- Neilsen et al. (2011) Neilsen, J., Remillard, R. A., & Lee, J. C. 2011, ApJ, 737, 69
- Parmar et al. (1985) Parmar, A. N., White, N. E., Giommi, P., et al. 1985, IAU circular, 4039, 1
- Parmar et al. (1986) Parmar, A. N., White, N. E., Giommi, P., & Gottwald, M. 1986, ApJ, 308, 199
- Parmar et al. (2002) Parmar, A. N., Oosterbroek, T., Boirin, L., & Lumb, D. 2002, A&A, 386, 910
- Ponti et al. (2012) Ponti, G., Fender, R. P., Begelman, M. C., et al. 2012, MNRAS, 422, L11
- Ratti et al. (2012) Ratti, E. M., Steeghs, D. T. H., Jonker, P. G., et al. 2012, MNRAS, 420, 75
- Reeves et al. (2008) Reeves, J., Done, C., Pounds, K., et al. 2008, MNRAS, 385, L108
- Shakura & Sunyaev (1973) Shakura, N. I., & Sunyaev, R. A. 1973, A&A, 24, 337
- Ueda et al. (2004) Ueda, Y., Murakami, H., Yamaoka, K., Dotani, T., & Ebisawa, K. 2004, ApJ, 609, 325
- van der Klis (2006) van der Klis, M. 2006, Compact stellar X-ray sources, 39
- van Peet et al. (2009) van Peet, J. C. A., Costantini, E., Méndez, M., Paerels, F. B. S., & Cottam, J. 2009, A&A, 497, 805
| Obs ID | Start date | S | Exp | C.E. | Fil | Mod | PP | Bu / Ecl / Dip / CH / CS / CBack | EW | EW | ||||
|---|---|---|---|---|---|---|---|---|---|---|---|---|---|---|
| (ks) | (ks) | (c/s) | Fe xxv (eV) | Fe xxvi (eV) | () | () | () | |||||||
| XMM-Newton | ||||||||||||||
| 0117900901 | 2000-02-23 10:15:09 | H | 34.0 | 25.1 | M | FW | Y | 8 / 0.6 / 0.27 / 3.6 / 17 / 2.5 | 9.0 | 8.0 | 4.2 | |||
| 0118700601 | 2000-02-27 07:16:15 | H | 51.5 | 39.1 | M | FW | Y | 8 / 0.5 / 0.22 / 3.3 / 18 / 1.8 | 8.1 | 7.1 | 3.8 | |||
| 0119710201 | 2000-03-05 20:37:47 | H | 24.6 | 19.5 | M | LW | Y | 9 / 0.5 / 0.18 / 4.9 / 29 / 2.5 | 10.8 | 9.7 | 5.1 | |||
| 0123500101 | 2000-04-21 03:10:12 | H | 18.1 | 11.8 | M | SW | N | 9 / 0.5 / 0.15 / 4.0 / 26 / 0.3 | 7.9 | 7.5 | 3.7 | |||
| 0134561101 | 2001-02-03 17:23:02 | H | 4.8 | 3.8 | T | FW | Y | 10 / 0.5 / 0.15 / 4.2 / 15 / 1.5 | 6.6 | 4.9 | ||||
| 0134561201 | 2001-02-04 01:14:50 | H | 3.0 | 2.2 | T | FW | Y | 10 / 0.5 / 0.2 / 3.9 / 11 / 1.5 | ” | ” | ” | ” | ” | |
| 0134561301 | 2001-02-04 03:47:26 | H | 3.0 | 2.7 | T | FW | Y | 10 / 0.5 / 0.13 / 3.8 / 19 / 1.5 | ” | ” | ” | ” | ” | |
| 0134561401 | 2001-02-04 07:43:06 | H | 3.0 | 2.7 | T | FW | Y | 10 / 0.5 / 0.15 / 3.5 / 18 / 1.1 | ” | ” | ” | ” | ” | |
| 0134561501 | 2001-02-04 12:04:21 | H | 3.0 | 2.6 | T | FW | Y | 8 / 0.5 / 0.16 / 4.0 / 20 / 1.5 | ” | ” | ” | ” | ” | |
| 0160760101 | 2003-09-19 13:30:05 | H | 88.5 | 56.7 | M | SW | N | 9 / 0.5 / 0.135 / 4.3 / 38 / 0.35 | 8.4 | 7.8 | 4.0 | |||
| 0160760201 | 2003-09-21 13:31:19 | H | 90.4 | 59.0 | M | SW | N | 9 / 0.4 / 0.13 / 4.3 / 43 / 0.3 | 8.5 | 8.0 | 4.0 | |||
| 0160760301 | 2003-09-23 10:35:20 | H | 107.9 | 66.7 | M | SW | N | 10 / 0.4 / 0.12 / 4.4 / 45 / 0.35 | 8.5 | 8.1 | 4.0 | |||
| 0160760401 | 2003-09-25 17:22:42 | H | 73.5 | 48.2 | M | SW | N | 9 / 0.4 / 0.13 / 4.1 / 35 / 0.45 | 7.8 | 7.4 | 3.7 | |||
| 0160760601 | 2003-10-21 09:55:39 | H | 54.9 | 36.2 | M | SW | N | 9 / 0.4 / 0.135 / 4.2 / 40 / 0.4 | 8.7 | 8.1 | 4.1 | |||
| 0160760801 | 2003-10-25 19:12:54 | H | 62.4 | 38.7 | M | SW | N | 9.5 / 0.45 / 0.13 / 4.3 / 37 / 0.3 | 8.6 | 7.9 | 4.1 | |||
| 0160761301 | 2003-11-12 08:17:18 | H | 90.7 | 59.3 | M | SW | N | 9 / 0.4 / 0.14 / 4.3 / 35 / 0.3 | 8.4 | 7.7 | 4.0 | |||
| 0212480501 | 2005-04-27 13:22:00 | S | 51.7 | 47.9 | Tck | T | N | 24 / 1.8 / 0.056†/ 13.5 / 260 / 0.35 | -323 | 83 | 13.7 | 24.7 | 5.4 | |
| 0560180701 | 2008-11-06 08:30:03 | Q | 27.9 | 23.3 | M | FW | N | 10 / 0.05‡/ 0.8 / 0.01 / 0.6 / 1.5 | ||||||
| 0605560401 | 2009-03-18 00:37:57 | Q | 41.9 | 34.4 | T | FW | N | 10 / 0.15‡/ 2.0 / 0.01 / 0.4 / 1.5 | ||||||
| 0605560501 | 2009-07-01 05:55:27 | Q | 100.0 | 79.6 | T | FW | N | 10 / 0.1‡/ 2.0 / 0.01 / 0.38 / 3 | ||||||
| 0651690101 | 2010-06-17 05:09:49 | Q | 28.6 | 15.3 | T | FW | N | 10 / 0.1‡/ 2.0 / 0.01 / 0.4 / 2.0 | ||||||
| Chandra | ||||||||||||||
| 1017 | 2001-04-14 01:13:17 | H | 48.0 | 48.0 | HEG | N | - | 8.4 | 6.0 | 4.0 | ||||
| 4573 | 2003-10-15 08:52:53 | H | 162.9 | 162.9 | HEG | N | - | 9.3 | 7.8 | 4.2 | ||||
| 4574 | 2003-10-13 03:57:32 | H | 123.5 | 123.5 | HEG | N | - | 9.0 | 7.6 | 4.1 | ||||
| Suzaku | ||||||||||||||
| 402092010 | 2007-12-25 05:41:13 | H | 45.9 | 32.7 | 1/4 | N | 13/0.5/0.15/1.5/11/ - | 6.6 | 7.3 | 3.9 | ||||