Ultimate photo-induced Kerr rotation achieved in semiconductor microcavities
Abstract
Photoinduced Kerr rotation by more than radians is demonstrated in planar quantum well microcavity in the strong coupling regime. This result is close to the predicted theoretical maximum of . It is achieved by engineering microcavity parameters such that the optical impedance matching condition is reached at the smallest negative detuning between exciton resonance and the cavity mode. This ensures the optimum combination of the exciton induced optical non-linearity and the enhancement of the Kerr angle by the cavity. Comprehensive analysis of the polarization state of the light in this regime shows that both renormalization of the exciton energy and the saturation of the excitonic resonance contribute to the observed optical nonlinearities.
pacs:
71.36.+c, 42.65.HwSemiconductor microcavities elate an increasing interest, due to their capacity to enhance the light matter interaction. In particular, Kerr (Faraday) rotation, that is the rotation of the polarization of light upon reflection (transmission) from a media characterised by a non-zero magnetisation projection to the diection of light propagation, can be increased by orders of magnitude by placing the spin polarised quasiparticles in a high quality factor planar optical microcavity Hu et al. (2008); Cubian et al. (2003); Brunetti et al. (2006). Using this approach, spectacular effects, such as Kerr rotation by a single electron spin in a quantum dot and Kerr rotation by nuclear spins were recently observed Arnold et al. (2014); Giri et al. (2013). Amplification of the electron spin noise, an effect measured via fluctuations of the Faraday rotation, was achieved by placing a two-dimensional electron gas in a microcavity Poltavtsev et al. (2014). However, experimentally observed polarization rotation angles in structures with microcavities do not exceed several degrees Brunetti et al. (2006); Giri et al. (2012), though the theoretical limit is radians Kaliteevskii et al. (1997).
In this work, we demonstrate photo-induced Kerr rotation by exciton-polaritons in a semiconductor microcavity containing quantum wells (QWs) in the strong coupling regime by more than . This is achieved by engineering the structure where the exciton polariton mode with strong spin dependent nonlinear properties is above the impedance matching condition (IMC). The IMC is characterized by zero reflectivity at the resonance frequency, which means that the cavity leakage wave and directly reflected wave at the resonance have equal amplitudes and opposite phases. Above IMC the leakage wave is stronger than the directly reflected wave, so that photoinduced modifications of the cavity resonance will have the greatest impact on the reflectivity. To achieve this regime the absorbtion in the cavity should be sufficiently low. The resonant absorbtion of the polariton modes makes IMC is difficult to fulfil in microcavities in the strong coupling regime. Thus, to optimize photoinduced Kerr rotation in a QW microcavity a trade off between maximum excitonic effects and minimum absorbtion should be found, by designing the structure where the cavity mode is below the QW exciton resonance at the IMC. We show, that in such structure the optical orientation of exciton polaritons by circularly polarized light induces the splitting between circularly polarized polariton modes of order of the cavity mode width, sufficient to observe Kerr rotation angles close to its theoretical maximum of . A careful analysis of the polarization state of the reflected light allows for the identification and quantitative analysis of the microscopic mechanisms responsible for the enhanced gyrotropy of microcavities under optical pumping. Both spin-dependent blue shift of the exciton energy and the reduction of the exciton oscillator strength are shown to contribute to the photoinduced Kerr rotation on the equal footing.
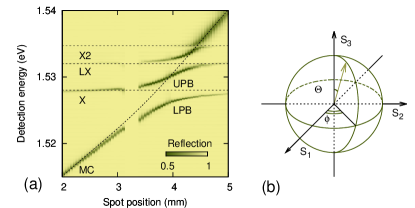
The sample is grown on GaAs substrate and consists of -cavity with a -nm quantum well in the center. It is sandwiched between two Bragg mirrors, the front (rear) mirror consists of () pairs of AlAs/Al0.1Ga0.9As layers. This asymmetry is important to reach IMC. The cavity is grown on a wedge, so that the exciton cavity detuning can be controlled by choosing the laser spot (of m radius) position on the sample surface. The structure design is further detailed in Ref. Rapaport et al. (2001); Lagoudakis et al. (2003). The sample is placed in a closed-cycle optical cryostat at K and investigated in the backscattering geometry using the time-resolved pump-probe technique. The gyrotropy in the active layer is created by optical pumping with circularly polarized pulses of a mode-locked Ti:Sapphire laser resonant with the upper polariton branch. From the broad spectrum of the femtosecond laser pulse, pump pulses characterized by the spectral width of meV are cut by an acousto-optic filter, the time-integrated pump power varied in the range of mW. Because the reflection coefficient on the upper polariton branch strongly depends on the detuning, in the quantitative analysis we use absorbed optical power, rather than the incident power, assuming that all the power transmitted through the front mirror is absorbed in the QW. Probe pulses are meV wide and linearly polarized in the vertical plane parallel to the crystallographic axis (110) to minimize the influence of the optical anisotropy of the sample. The time-integrated power does not exceed mW. The polarization state of the probe beam is analyzed using an ellipsometer. It consists of two phase plates (with half-wave and quater-wave retardation) and a linear polarizer, placed one after another in front of the entrance slit of a -m spectrometer equipped with a CCD camera. For a given delay between pump and probe pulses, the spectra of the reflected probe were recorded in six different polarizations: vertical, horizontal, diagonal, anti-diagonal, right circular and left circular. These spectra provide the state of polarization of the probe beam in terms of the Stocks vector components, which can be mapped to the Poincare sphere (Fig. 1 (b)): , where is the intensity of light components polarized along horizontal () and vertical () axes, diagonal (rotated by ) axes: , , and of the circularly polarized components: , .
Figure 1 (a) shows a color map of the linear reflectivity (in the absence of the pump) as a function of the photon energy and -coordinate on the sample surface. The energy of the cavity mode shifts linearly across the sample. For each position, three dips in the spectrum are observed, corresponding to the cavity photon mode (MC-mode), heavy hole (X) and light hole (LX) exciton. Both X and LX modes show anticrossings with the MC mode. The highest energy anticrossing is due to the second quantized state of the exciton in the QW (X2). Above the anti-crossing point with the upper exciton level, the MC mode width becomes several times larger due to the inter-band absorption in the QW and increased losses in the mirrors. These linear reflectivity spectra are described in the framework of the non-local dielectric response model. The reflection coefficient of the cavity in the absence of pumping is given by the function , obtained by summation of waves reflected from all the heterointerfaces Hu et al. (2008),
| (1) | |||||
Here is the cavity eigenfrequency, () are rates of radiative (non-radiative) decay of of the cavity mode, is the strength of coupling between exciton and the light field (equal to one half of the Rabi frequency Kavokin et al. (2007)), is the exciton resonance frequency in the quantum well, is the exciton damping rate. The index spans over three exciton resonances, X, LX and X2. The mirrors are characterized by the transmission coefficients and for the front and rear mirrors, respectively. The inhomogeneous broadening of the cavity resonance due to the gradient of the cavity width under the light spot has been taken into account via convolution of the amplitude reflection coefficient with the Gaussian distribution of the width .
The parameters obtained by fitting this model to the linear reflectivity spectra are summarized in the Table 1. The IMC is achieved in this structure at the MC mode detuning meV. Note, that due to the inhomogeneous broadening, the reflectivity does not go to zero at the LPB energy at IMC. Although LX and X2 polaritons do not induce strong photoinduced Kerr rotation, it’s mandatory to take them into account in the modelling of the spectra, for the correct description of the polariton states.
| Transition | (meV) | (meV) | (meV) |
|---|---|---|---|
| Heavy exciton, X | 1528.0 | 0.3 | 1.8 |
| Light exciton, LH | 1532.0 | 0.3 | 1.4 |
| Upper level exciton, X2 | 1534 | 0.3 | 0.5 |
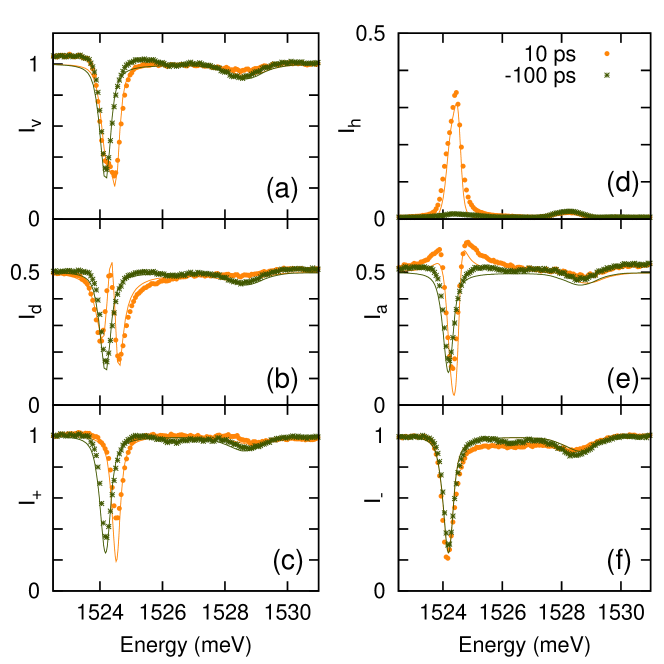
Fig. 2 shows polarization-resolved photoinduced reflectivity spectra in the vicinity of X resonance, where the strongest photoinduced effects are observed. The MC mode detuning with respect to the X resonance is meV, the pump power is mW. For each polarization of detection, two spectra are shown: the spectrum at negative delay, which is identical to the spectrum of probe in the absence of the pump, and the spectrum at the pump-probe delay of ps. In the following we will limit the discussion to this fixed pump-probe delay. Studies of the polarization dynamics and relaxation are beyond the scope of this paper and will be reported elsewhere. Comparing the spectra at negative and positive delays, one can see a noticeable photoinduced effect in all polarizations, except counter-circular, with different spectral dependences. In the vertical linear polarization, , the lower polariton branch (LPB) splits, and a signal in the orthogonal horizontal polarization, , appears. This is a clear signature of the Kerr rotation. In circular polarization coinciding with that of the pump (co-circular, ), a spectral shift of the LPB mode is observed, which is virtually absent in the cross-circular polarization, . The upper polariton branch (UPB) is less affected than the lower polariton branch.
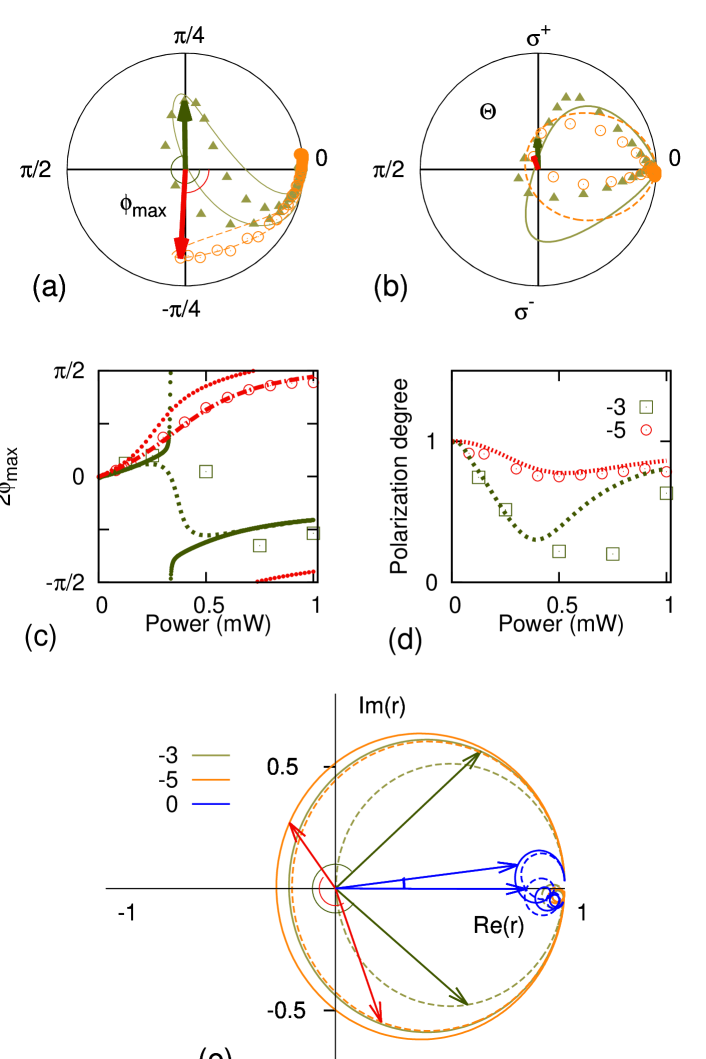
It is instructive to represent the pump-induced polarization state extracted from the polarization-resolved measurements in terms of the Stokes vector hodograph upon variation of the probe energy. In Figs. 3 (a, b) two different detunings of the photon mode are shown, meV, corresponding to IMC, and meV, that is above IMC. The energy range is the same as in Fig. 2. Fig. 3 (a) shows the Stocks vector projection on the equatorial plane. In this representation, the Kerr rotation angle is readily visualized as the deviation of the Stokes vector from the abscissae. Arrows indicate the maximum photonduced rotation angle measured for each detuning. The projection on the vertical plane, containing the initial polarization of the incident probe beam is shown in Fig. 3 (b), its deviation from the vertical axis yields the ellipticity angle . The arrows show the elipticity at the energy of the maximum Kerr rotation, one can see that it remains small at both values of .
The maximum values of the Kerr rotation angle measured for each pumping power are shown by symbols in Fig. 3 (c). The power dependence of Kerr rotation is monotonic for meV, . This corresponds to the fact that the hodograph of the Stokes vector does not turn around zero (as in Fig. 3(c), red circles) even at the maximum pumping power. At meV, it crosses zero at the absorbed power of about mW (Fig.3(c), green squares). At this power, the Stocks vector hodograph crosses zero at the equatorial plane, and then reruns back. The rotation of appears as a discontinuity since the angle is given by and defined between and . The further increase of the pumping power allows us reaching which the maximum value observed in this work.
It should be noted that a considerable depolarization of the reflected probe signal accompanies the Kerr rotation in our experiments. It may be described by the reduction of the Stokes vector length. The total polarization degree, , as a function of absorbed power is shown in Fig.3 (d). At meV, the reflected probe always remains highly polarized, while at meV a significant depolarization takes place. At zero and positive detuning, the system is placed below IMC, and the Kerr rotation angle remains as small as , even at the maximum applied power (not shown) where the exciton transition is saturated and the transition from strong to weak coupling regime occurs.
To reproduce the energy, power and detuning dependence of the photoinduced gyrotropy, we have formulated a simple phenomenological model. We assume that the effect of the optical pumping can be described in terms of the blue shift of the X resonance (i) and reduction of coupling with the MC mode in the co-circular polarization (ii). Both effects are supposed to be linearly dependent on the absorbed power or, equivalently, on the polariton density. The importance of the latter contribution in some particular has been evidenced previously Huynh et al. (2002), while often it can be neglected Vladimirova et al. (2010); Takemura et al. (2013). Including not only the energy shift but also the reduction of the coupling is mandatory for the correct description of the experimental data. The resulting energy of the X state under co-circular pumping can be written as , and the X-MC coupling parameter as . Pumping in the counter-circular polarization is supposed to induce no noticeable variation of the excitonic parameters at negative detuning, because interaction between polaritons with opposite spins is negligibly weak in this case Vladimirova et al. (2010); Takemura et al. (2013). The resulting reflection coefficients for right- () and left-circular () polarizations of light can be calculated as functions of power using Eq. Ultimate photo-induced Kerr rotation achieved in semiconductor microcavities with power-dependent exciton energy and exciton-cavity coupling in the co-circular polarization. These two reflection coefficients are sufficient to model the experimental data: the photoinduced reflectivity signal in any polarization, all the components of the Stocks vector of the reflected light, and the power-dependence of the Kerr rotation angle. The results of the fitting of this model results to the measured Stocks vector components and Kerr rotation angle are shown by solid lines in Fig. 3 (a-d), while the row spectra in six different polarizations are shown in Fig. 2. Two fitting parameters meV/mW and meV/mW are used to reproduce the ensemble of the photo induced effects. One can see that this simple model reproduces quite well the experimental data, namely, the power dependence of the Kerr rotation and the total polarisation degree. Note that the inhomogeneous broadening of exciton-polariton modes plays an important role here. Indeed, dotted lines In Fig. 3 (c) show the Kerr rotation angle which one could expect for the same cavity parameters but in the absence of the inhomogeneous broadening. Much sharper increase of the Kerr angle in the vicinity of point could be expected in this case. Moreover, the depolarisation is entirely due to the inhomogeneous broadening, and the polarisation degree would not be affected by the pumping in the homogeneous system.
It is now possible to elucidate the role of the impedance matching condition in the optically induced gyrotropy. For this purpose we plot in a complex plane calculated at the same power as in Fig. 3 (a) and which does not depend on power for , meV, and meV, Fig. 3 (e). While the frequency passes through the cavity resonance, the function makes a circle on the complex plane, starting from real unity and eventually coming back. The radius of this circle equals to unity in the system with zero absorbtion, but in realistic system it is determined by the absorption in the cavity, and thus is sensitive to the detuning of the MC mode from the X resonance. The complex reflection coefficient circumvents zero point at meV (above IMC), but not at (below IMC), the reflectivity turns to zero at meV, corresponding to the IMC. Co-circular pumping moves the system towards more negative detunings due to the photo-induced modification of the excitonic transition energy, so that the radius of the circle increases (dashed circles), and the reflectivity vector shifts along this circle. The Kerr rotation angle is given by , which is why it’s easy to see in this graphic representation that can’t exceed below IMC, and can in principle reach above IMC. The reflectivity vectors corresponding to the maximum Kerr rotation are indicated by arrows. They are obtained from the fitting of the data for three different detining values . One can see that below IMC at zero detuning the rotation is indeed very small. The maximum rotation is obtained at meV, where the system is pushed above IMC by optical pumping. However, at meV, further above IMC, the Kerr angle is reduced again. This is the consequence of weaker excitonic effects at stronger negative detunings, and thus smaller polariton shifts.
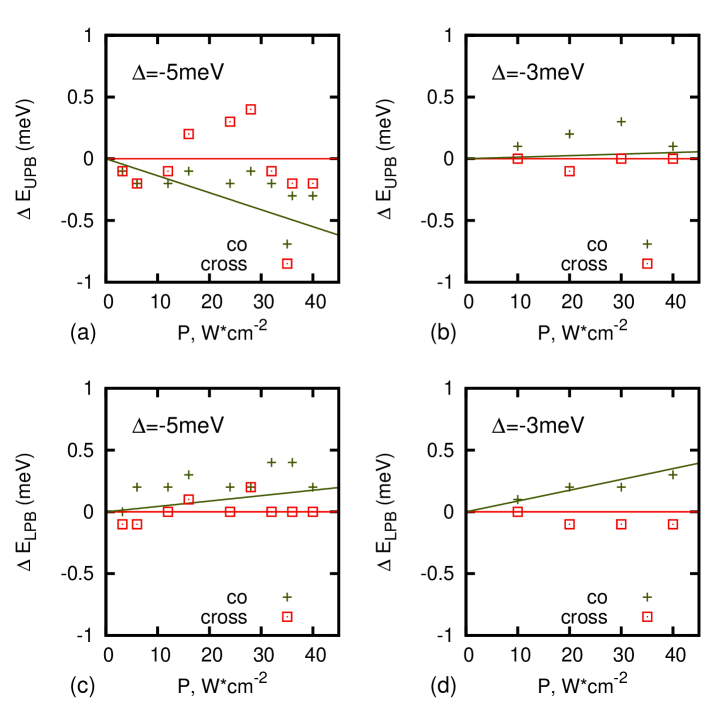
The power dependence of upper () and lower () polariton energy shifts measured in co- and counter-circular polarization are shown in Fig. 4 for two different detunings. One can see that polariton shifts are essentially linear in density, which justifies the assumptions of the model (solid lines). At both values of the detuning, LPB experiences the blue shift, while the shift of is negative at meV and positive at meV. This behavior is due to the combination of two excitonic nonlinearities, exciton energy shift and oscillator strength decrease. In contrast with the experiments of Ref. Takemura et al. (2013), where LPB shifts achieved at the most negative detuning of meV do not exceed meV, here stronger LPB shifts indicate higher polariton densities, and thus the additional mechanism (exciton oscillator strength decrease) coming into play Huynh et al. (2002). This regime is beyond the scope of the present work. Note also, that in the counter-circular configuration no measurable polariton shift is observed. This is consistent with the previous measurements, indicating that at strongly negative detunings meV the interaction of polaritons with opposite spins is negligibly weak.
In conclusion, we have demonstrated the photoinduced Kerr rotation angle in semiconductor microcavity of up to radians, close to the theoretical limit of . The conditions which ensure maximum Kerr rotation constitute a trade off between the needs to maximise photoinduced excitonic effects (polarization-dependent blue shift and oscillator strength reduction) close to zero cavity mode detuning, and minimize the absorption in order to achieve IMC. Understanding of the major role played by IMC is crucial for the design of specific samples, e.g. suitable for giant amplification of the optical girotropy. These results open the way for realisation of fast optical polarisation modulators operating at zero magnetic field.
Acknowledgements. This work was partially supported by the Russian Ministry of Education and Science (Contract No. 11.G34.31.0067 with SPbSU). The authors acknowledge Saint-Petersburg State University for a research grant 11.38.213.2014. RVC thanks RFBR project No. 14-02-31846 for financial support. MV acknowledge EU INDEX PITN-GA-2011-289968.
References
- Hu et al. [2008] C. Y. Hu, A. Young, J. L. O’Brien, W. J. Munro, and J. G. Rarity, Phys. Rev. B 78, 085307 (2008).
- Cubian et al. [2003] D. PeredaCubian, M. Haddad, R. André, R. Frey, G. Roosen, J. L. A. Diego, C. Flytzanis, Phys. Rev. B 67, 045308 (2003).
- Brunetti et al. [2006] A. Brunetti, M. Vladimirova, D. Scalbert, R. André, D. Solnyshkov, G. Malpuech, I. A. Shelykh, and A. V. Kavokin, Phys. Rev. B 73, 205337 (2006).
- Arnold et al. [2014] C. Arnold, V. Loo, A. Lemaitre, I. Sagnes, O. Krebs, P. Voisin, P. Senellart, and L. Lanco, Phys. Rev. X 4, 021004 (2014).
- Giri et al. [2013] R. Giri, S. Cronenberger, M. M. Glazov, K. V. Kavokin, A. Lemaitre, J. Bloch, M. Vladimirova, and D. Scalbert, Phys. Rev. Lett. 111, 087603 (2013).
- Poltavtsev et al. [2014] S. V. Poltavtsev, I. I. Ryzhov, R. V. Cherbunin, A. V. Mikhailov, N. E. Kopteva, G. G. Kozlov, K. V. Kavokin, V. S. Zapasskii, P. V. Lagoudakis, and A. V. Kavokin, Phys. Rev. B 89, 205308 (2014).
- Giri et al. [2012] R. Giri, S. Cronenberger, M. Vladimirova, D. Scalbert, K. V. Kavokin, M. M. Glazov, M. Nawrocki, A. Lemaitre, and J. Bloch, Phys. Rev. B 85, 195313 (2012).
- Kaliteevskii et al. [1997] M. A. Kaliteevskii, A. V. Kavokin, and P. S. Kop’ev, Semiconductors 31 (1997).
- Rapaport et al. [2001] R. Rapaport, E. Cohen, A. Ron, E. Linder, and L. N. Pfeiffer, Phys. Rev. B 63, 235310 (2001).
- Lagoudakis et al. [2003] P. G. Lagoudakis, M. D. Martin, J. J. Baumberg, A. Qarry, E. Cohen, and L. N. Pfeiffer, Phys. Rev. Lett. 90, 206401 (2003).
- Kavokin et al. [2007] A. Kavokin, J. Baumberg, G. Malpuech, and F. Laussy, Microcavities, Series on Semiconductor Science and Technology (OUP Oxford, 2007), ISBN 9780191620737.
- Huynh et al. [2002] A. Huynh, J. Tignon, P. Roussignol, C. Delalande, R. André, R. Romestain, D. Le Si Dang, Phys. Rev. B 66, 113301 (2002).
- Vladimirova et al. [2010] M. Vladimirova, S. Cronenberger, D. Scalbert, K. V. Kavokin, A. Miard, A. Lemaitre, J. Bloch, D. Solnyshkov, G. Malpuech, and A. V. Kavokin, Phys. Rev. B 82, 075301 (2010).
- Takemura et al. [2013] N. Takemura, S. Trebaol, M. Wouters, M. T. Portella-Oberli, and B. Deveaud (2013), arXiv:1310.6506v2, eprint 1310.6506.