Galaxy and Mass Assembly (GAMA): merging galaxies and their properties
Abstract
We derive the close pair fractions and volume merger rates for galaxies in the GAMA survey with (, , km s-1 Mpc-1) at (lookback time of Gyr). The merger fraction is approximately 1.5% per Gyr at all luminosities (assuming 50% of pairs merge) and the volume merger rate is Mpc-3 Gyr-1. We examine how the merger rate varies by luminosity and morphology. Dry mergers (between red/spheroidal galaxies) are found to be uncommon and to decrease with decreasing luminosity. Fainter mergers are ‘wet’, between blue/disky galaxies. Damp mergers (one of each type) follow the average of dry and wet mergers. In the brighter luminosity bin () the merger rate evolution is flat, irrespective of colour or morphology, out to . The makeup of the merging population does not appear to change over this redshift range. Galaxy growth by major mergers appears comparatively unimportant and dry mergers are unlikely to be significant in the buildup of the red sequence over the past 2 Gyr. We compare the colour, morphology, environmental density and degree of activity (BPT class) of galaxies in pairs to those of more isolated objects in the same volume. Galaxies in close pairs tend to be both redder and slightly more spheroid-dominated than the comparison sample. We suggest that this may be due to ‘harassment’ in multiple previous passes prior to the current close interaction. Galaxy pairs do not appear to prefer significantly denser environments. There is no evidence of an enhancement in the AGN fraction in pairs, compared to other galaxies in the same volume
keywords:
galaxies: interactions — galaxies: formation1 Introduction
Mergers and interactions are believed to be among the primary pathways for galaxy formation and evolution: they are expected to drive star formation histories, morphologies, internal kinematics, chemical evolution and nuclear activity, among others, and reflect a long history of processing through different environments 111The literature on this subject is very large and growing by the day; we cannot hope to be just or comprehensive in a brief introduction. However, Baugh (2006) and the recent textbook by Mo et al. (2010) provide good entry points to this subject.. The merger rate of galaxies, its evolution and its dependence on mass, luminosity, colour, morphology and environment (to name some) provide important clues to theories of galaxy formation and are an essential ingredient in simulations (e.g., Murali et al. 2002; Maller et al. 2006; Stewart et al. 2009; Perret et al. 2013 and references therein).
However, it is actually difficult to estimate the galaxy merger rate and compare with theoretical estimates (e.g.,Berrier et al. 2006; Genel et al. 2009; Williams et al. 2011; Moreno et al. 2013). Several approaches have been applied to astronomical data and these often yield inconsistent results. Tidal features and sheets were early recognized by Zwicky (1953, 1956) as signposts of galaxy interactions, following the pioneering opto-mechanical experiments by Holmberg (1941). Seminal work by Toomre & Toomre (1972) and Toomre (1977) later established a connection between tidal disturbances and mergers, leading to a semi-empirical model for the formation of giant ellipticals from the merger of disks in the context of early Cold Dark Matter models (e.g., Blumenthal et al. 1984). More recent applications of this technique rely on objective measures of morphological anomaly in galaxy images, rather than visual classifications, such as the Gini coefficient (Abraham et al., 2003), index (Lotz et al., 2004) and the CAS method of Conselice (2003) and Fourier-mode asymmetry measurements (Peng et al., 2010). A companion paper by Casteels et al. (2013) also gives details on the application of CAS-like approaches to the GAMA survey.
If a galaxy is to merge, it needs a close companion to merge with. The fraction of galaxies in close pairs therefore yields a proxy for the galaxy merger rate. With the availability of large redshift databases from giant redshift surveys it is now possible to identify close pairs in 3D space (position and relative velocity), such that, if bound, these galaxies will merge within the dynamical friction timescale ( Gyr). The formalism and its application to the SSRS2 and CFRS surveys have been presented in Patton et al. (2000, 2002); we have used this method to measure the local pair fraction and merger rate from the Millennium Galaxy Catalogue (MGC; Liske et al. 2003; Driver et al. 2005) in De Propris et al. (2005, 2007), where we also compared the results to asymmetry-based estimates (De Propris et al., 2007). Several other studies have searched for dynamically close pairs out to (e.g. Xu et al. 2004; Ryan et al. 2007; Lin et al. 2008; de Ravel et al. 2009; Bridge et al. 2010; Lopez-Sanjuan et al. 2011 et seq.).
Both methods have their own strengths and weaknesses. Morphology-based approaches require high resolution, high-quality imaging and careful attention needs to be paid to contamination (e.g., edge-on galaxies, segmentation – De Propris et al. 2007; Jogee et al. 2009; Casteels et al. 2013). Dynamically close pairs are observationally expensive as highly complete redshift samples need to be acquired and they are still affected by projection effects (Moreno et al., 2013). Both approaches are also affected by uncertain timescales for the close pairs to merge or the visibility of merger remnants above a given level of asymmetry or disturbance (e.g., Lotz et al. 2011). While the two methods yield results in reasonable agreement (De Propris et al., 2007; Cotini et al., 2013), with each other, asymmetries and other morphology-based methods generally identify objects in the process of merging or recent merger remnants, while close pairs yield a measure of the ’progenitor’ rate and may be more easily compared to theoretical predictions by identifying close pairs of dark matter halos in simulations (Genel et al., 2009; Lotz et al., 2011) as long as one understands the assumptions about the correspondence between dark matter halos and visible galaxies.
Here we present a search for close pairs in the GAMA survey (Driver et al., 2011). This dataset is ideal for this measurement, as the survey has very high completeness () and no bias against close companions (for instance, the fibre placement algorithm in the SDSS leads to incompleteness at separations of and in the 2dF survey the close separation limit is about ). We measure the pair fraction and volume merger rate as a function of absolute luminosity. We also split our samples into dry (between quiescent/spheroid-dominated galaxies), wet (star forming or disk-dominated objects) and damp (mixed) mergers and we consider their dependence on luminosity; we also measure the cosmic variance of the pair fraction and merger rate. We study the properties of galaxies in pairs and compare these (colours, morphologies, environment and activity) with those of more isolated objects (i.e.,not in our close pairs) in the same volume and with the same luminosity, to understand how interactions have affected galaxies. The outline of this paper is as follows: we discuss the dataset and the methodology in section 2. We then present the pair fractions in section 3. In section 4 we consider the properties of galaxies in pairs vs. their parent samples. Finally, in section 5, we discuss the results in the context of theories of galaxy formation. Throughout this paper we assume the standard CDM cosmology with , and km s-1 Mpc-3.
2 Dataset and Methodology
The dataset we use is the Galaxy and Mass Assembly (GAMA) redshift survey. This is fully described in Driver et al. (2011, see Baldry et al. 2010 for the input catalogue and Hopkins et al. 2013 for details of the spectroscopic analysis); in the following, we give a brief summary of its main properties as used in this paper. GAMA as used in this paper is equivalent to the GAMA-I sample obtained during the first 3 years of the survey and frozen for internal team use and consists of three 48 deg2 regions on the celestial equator, at RA of 9h, 12h and 14.5h, containing photometry over a wide range of wavelengths, including vacuum UV from GALEX, from the SDSS (York et al., 2000; Ahn et al., 2012), from 2MASS and UKIDSS, mid-IR from the WISE survey at 3.6, 4.5, 12 and 22 m, as well as other sources of archival photometry (e.g., HERSCHEL, Planck). Spectroscopy to a limiting magnitude of ( for the 12h region) has been obtained for over 120,000 galaxies with the AAOmega multi-fibre spectrograph on the Anglo-Australian Telescope, supplementing existing datasets from the 2dF Galaxy Redshift Survey (Colless et al., 2001), the SDSS and others, to reach a high degree () of spectroscopic completeness (Hopkins et al., 2013). Each region in the sky is surveyed multiple times, which aids in reaching high completeness at small angular separations. Because of this, GAMA is ideal to carry out a close pair analysis of galaxy populations to measure the merger rate and explore the influence of interactions and mergers on galaxy properties.
We search for pairs in GAMA using the methods developed by Patton et al. (2000, 2002) and used in our previous work on the subject (De Propris et al., 2005, 2007, 2010). Following previous studies, we define galaxies as being in a close pair if their projected separation on the sky is kpc (the lower limit is imposed to avoid selecting high surface brightness regions within galaxies, such as HII regions) and if their velocity difference is km s-1. If these objects are truly bound, we expect that they will merge, by dynamical friction in Gyr (the actual timescales are likely to be somewhat longer, see below for details).
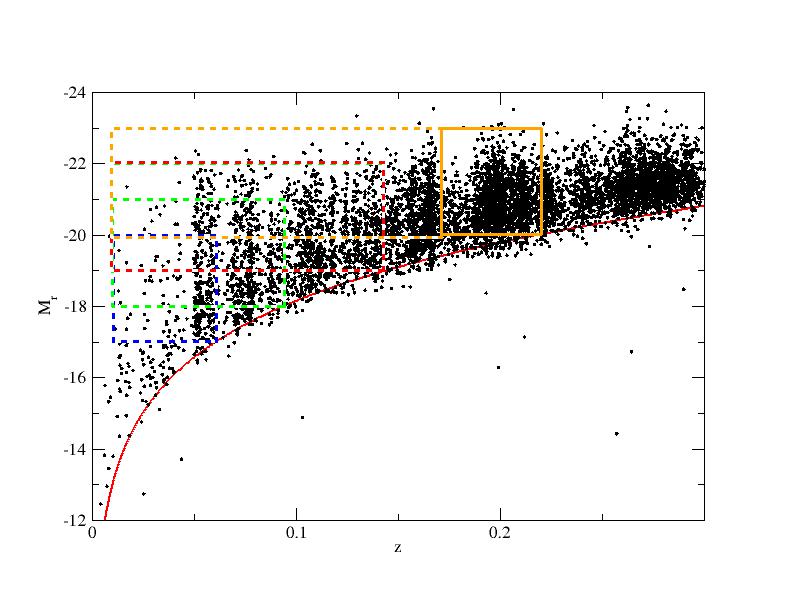
Fig. 1 shows the absolute magnitude of galaxies in GAMA (only a subset is shown for clarity) as a function of redshift. Here, all magnitudes and corrections are as given in the GAMA-I catalogue (Driver et al., 2011). The first step in our analysis is to select galaxies within a series of volume-limited boxes in absolute magnitude and redshift space. In order to measure a pair fraction, we need to restrict ourselves to a relatively small range of luminosities, as we need objects to have similar clustering properties (Patton et al., 2000; Patton & Atfield, 2008) and the clustering length is known to vary as a function of galaxy luminosity (Norberg et al., 2001). However, we also need our samples to contain enough galaxies to determine the pair fraction to sufficient accuracy, given that only of galaxies (based on previous work) are likely to fulfil our definition of a close pair. As in Patton et al. (2000, 2002); De Propris et al. (2005, 2007), we draw ’volume-limited’ samples spanning 3 mag. in luminosity (Fig. 1). Potentially, this includes mergers with luminosity ratios of up to 1:10, but the majority of close pairs will have luminosity ratios of and are therefore ‘major’ mergers (see below). Table 1 shows the luminosity and redshift ranges we study in this work, as well as the numbers of objects in each volume-limited box and the number of galaxies in close pairs (this need not be an even number, because of possible triplets). Note that for the brighter luminosity bin we consider, we are able to draw two samples, at and , and study the evolution of the merger rate between these two redshifts for galaxies with .
Because our sample (like all samples) is luminosity-limited we need to impose a lower absolute magnitude limit to our search, rather than using all galaxies in the appropriate luminosity range. This corresponds to the luminosity of a slowly evolving galaxy having the apparent magnitude limit of the survey () at all redshifts considered (thick red line in Fig. 1). If this is not done, it is possible for galaxies to enter or leave the sample depending on their star formation history (Patton et al., 2000). We use a Bruzual & Charlot 2003 model with , and Gyr, evolving passively, as a template for the slowest evolving object we are likely to encounter. When drawing the volume-limited boxes shown in Fig. 1, this model sets the high redshift limit for each luminosity interval we examine.
Each pair consists of a primary and secondary member; in this case we choose to make the two samples coincide so each galaxy is counted twice, once as a central and next as a satellite of the other. Following Patton et al. (2000, 2002) and our previous work, the number of close companions per galaxy is:
where the sums are over the galaxies in the primary sample, and the total companion luminosity is:
Here and are the number and luminosity (respectively) of galaxies in the secondary sample which are close companions (by the above definition) to the galaxy in the primary sample:
and
where the sums run over the secondary galaxies that fulfil the criteria of being dynamically close to the primary galaxy. The raw pair fractions are then weighted to correct for sources of spatial and spectroscopic incompleteness (e.g., areas where no fibers were placed such as within the halos of bright stars, or limits to slit placement for close companions).
The components and are weights to correct for the change in density of the secondary galaxies as a function of redshift due to the apparent flux limit of the sample and convert a luminosity limited sample into what would be expected from a volume-limited sample. They are calculated as the ratio of the integrated luminosity function over the luminosity sampled to the integrated luminosity function in a hypothetical volume-limited sample over the same redshift. In our case, as we are using volume-limited subsets of the data (see Figure 1), these components are equal to 1 (no weight).
The other two weights, and correct for boundary effects. The first one takes care of areas (within the search radius) around each galaxy where no companion can be found because they lie beyond the edges of the survey on the sky or within areas occulted by bright stars, ‘drill holes’ (for guide probes), image defects and satellite trails or other cosmetic issues. This weight is the reciprocal of the fraction of the area around each galaxy which is occulted in some fashion. The second weight is for galaxies close (within 500 km s-1) to the redshift limits of each volume-limited box, and accounts for possible companions missed because they lie just beyond these boundaries. As in Patton et al. (2000, 2002) the value of this weight is set at 2. Similar weights need to be applied to the primary sample as well, to account for missed primaries in the same manner (recall that both primary and secondary samples are the same):
these weights being the reciprocals of those applied to the secondary sample , (Patton et al., 2000).
Although GAMA is highly complete and is intended to have no pair bias at close angular separations, we need to correct for potential pairs missed because of redshift incompleteness, especially at small separations. We carry this out in the following manner: we first select potential pairs with galaxies that have no redshifts by the projected separation criterion only, and if such a pair exists, we assign to the galaxy the same redshift and corrections as its primary and require that the secondary galaxy falls within the selection criteria in luminosity. We then estimate the fraction of ’true’ pairs in this sample by carrying out the same analysis on the photometric sample (only) and on the redshift sample (only) separately, by using only the projected separation criterion. Since we know the true pair fraction in the redshift sample, we can use the ratio between the pair fractions in the ’photometric’ and ’redshift’ samples to derive an incompleteness correction. This is similar to the approach used by De Propris et al. (2005) for the MGC and by Masjedi et al. (2006, 2008). Naturally, this assumes that pairs are missed in a random fashion and potential companions have the same redshift distributions as the overall GAMA survey. This completeness correction amounts to to between and , respectively, with some increase towards lower luminosities, in agreement with GAMA’s high overall completeness and broad lack of bias at small separations.
An alternative approach is to select galaxies by stellar mass rather than luminosity. For the GAMA dataset the galaxy stellar mass was calculated by Taylor et al. (2011) who gives a formula involving their absolute -band luminosity and rest-frame colour. However, this is found to reject a significant fraction of the sample, as the stellar mass determinations are model-dependent (cf. the equivalent figure in Robotham et al. (2014, submitted to MNRAS). Our aim in this paper is not only to measure the pair fraction and derived merger rate, but also to consider how these quantities depend on luminosity,morphology, colour and environment and on how the properties of galaxies in pairs compare to those of more isolated systems in the same volume. Therefore we will restrict ourself to the numerically larger luminosity-selected samples. A pair analysis of GAMA data by stellar mass can be found in the companion paper by Robotham et al. (2014), where some of the selection issues are addressed with reference to simulations and mock catalogues. Nevertheless, this latter analysis does not concern itself with the dependencies on luminosity, colour, morphology and environment which are among the topics explored here.
3 Pair Fractions
Table 1 shows the main results of our analysis. In column order, the table contains: the luminosity ranges, redshift ranges, number of galaxies in each volume-limited box and number of close pairs, the completeness corrected pair fractions and the volume merger rates. In general, these objects are major mergers. Around 2/3 of all objects, in all the samples considered, have luminosity ratios of 1:2 or greater, and about 20% have luminosity ratios between 1:2 and 1:4.
| Luminosity Range | Redshift Range | Nobj | Npairs | Pair Fraction (%) | Volume Merger Rate |
|---|---|---|---|---|---|
| mag | Mpc-3 Gyr-1 | ||||
| 19816 | 644 | ||||
| 17093 | 494 | ||||
| 20936 | 699 | ||||
| 8084 | 256 | ||||
| 3151 | 56 |
The volume merger rates in this table are calculated as:
Where is the close pair fraction (as in Table 1), the volume density of galaxies (calculated from the completeness-corrected number of galaxies in each sample box), the factor of 0.5 takes care of the fact that each galaxy in a pair is counted twice (once as a primary and the other as a secondary), is the probability that the pair will truly merge (here 0.5, as in previous work and as supported by observations De Propris et al. 2007; Jian et al. 2012; Casteels et al. 2013) and is the merger timescale. This is calculated as follows: for each luminosity interval we compute the mean stellar mass of the pairs (using the colours and the expression from Taylor et al. 2011) and then adopt the fitting formulae of Kitzbichler & White (2008) and Boylan-Kolchin et al. (2008) for the merger timescales. These range between 0.5 and 1.5 Gyr for galaxies in higher and lower luminosity bins, respectively. These values are in good agreement with those estimated by Boylan-Kolchin et al. (2008), as well as those stated by Lotz et al. (2010) for the visibility of morphologically-selected merger remnants and the compilation in Lotz et al. (2011). Patton & Atfield (2008) also use this approach, and derive a volume merger rate of Mpc-3 Gyr-1 per mag. fpr galaxies with and 1:2 luminosity ratio, assuming a single timescale of 0.5 Gyr for all objects. If they adopted the fitting formulae by Kitzbichler & White (2008) these would result in merger timescales of 0.8 to 3.2 Gyr depending on galaxy luminosities, which are somewhat longer than ours. Compared to the more conventional estimates from dynamical friction, the merger timescales are about 30% longer, but as pointed out by Jiang et al. (2008) these are due to the poor performance of the simple estimate of the Coulomb logarithm. As we give explicit values for the raw pair fraction (with completeness corrections), as well as details on the luminosities and volumes sampled, future studies or theoretical comparisons can adopt any appropriate timescale and apply it to the data presented here.
Jian et al. (2012) show that the merger timescale depends sensitively on the mass ratio of mergers, being shorter for equal masses and considerably longer for more minor mergers. Most of our pairs, on the other hand, have similar luminosity ratios (about 4/5 of all objects are mergers). The timescales we calculate above are therefore appropriate for nearly equal mass mergers as inn Jian et al. (2012), although our values may be a slight underestimate of the actual merger timescale. We tabulate the derived volume merger rates in units of Mpc-3 Gyr-1 in Table 1. These amount to mean luminosity accretion rates of per Gyr for galaxies with . If we use the stellar masses computed following Taylor et al. (2011), these luminosity accretion rates correspond to stellar mass accretion rates of Gyr-1, equivalent to growth factors of of the current mass of each galaxy per Gyr.
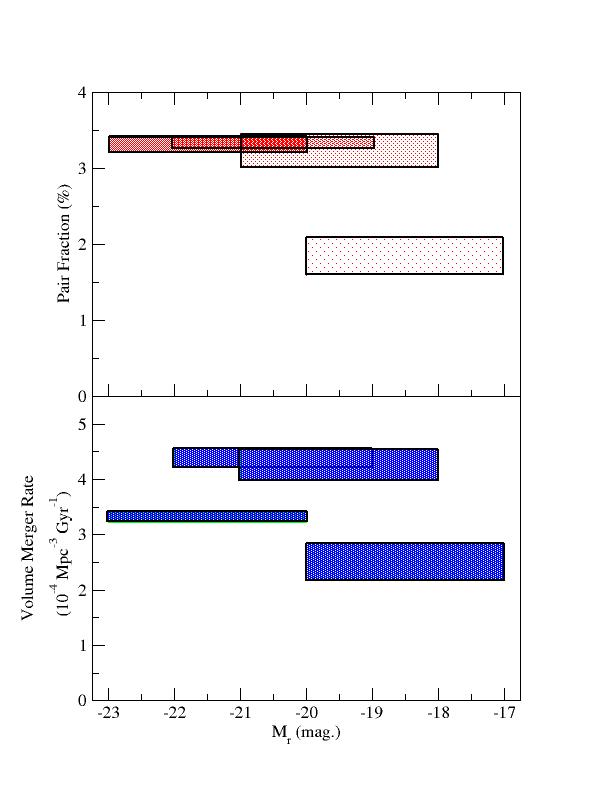
We present these quantities in Fig. 2. The pair fraction (top panel) is a nearly constant 3% at all luminosities. Note that the actual merger fraction is 1/2 of these values, if we assume that only 50% of close pairs actually merge. The bottom panel of this figure shows the equivalent for volume merger rates. In both cases we observe a decline in the merger fraction (and rate) in the lower luminosity bin, and a possible decrease at high luminosities as well; the former is in agreement with observations by Patton & Atfield (2008). These trends are more significant for volume merger rates, because of the different volume densities and merger timescales for each luminosity bin. We are also able to measure the pair fraction and volume merger rate for galaxies in the brightest luminosity bin within two redshift intervals (centred on and ) to measure the evolution of the merger rare since (approximately 2 Gyr in the past). We do not show the higher redshift datapoints in LABEL:fig3 and subsequent figures to avoid confusion. Our measurements are consistent with a flat or even declining merger rate evolution, in agreement with previous observations for similarly massive galaxies (Lin et al., 2004; Kartaltepe et al., 2007; Lin et al., 2008; de Ravel et al., 2009) at higher redshifts, which are also consistent with (Lotz et al., 2011).
3.1 Dependence on colour and morphology
We now consider how the merger rate depends on the colour of galaxies. For example, mergers between gas-less galaxies (’dry’ mergers, with galaxies already on the red sequence) have been proposed as a possible mechanism to grow the red sequence in mass without increasing the intrinsic scatter in the colour-magnitude relation and other scaling factors (Bell et al., 2004; van Dokkum, 2005; Faber et al., 2007; Skelton et al., 2012). Obviously, we have no knowledge of the gas content of these galaxies, but we can use the colour to separate quiescent and actively star-forming galaxies, with the dividing line at (e.g., Strateva et al. 2001; Baldry et al. 2004). This is acceptable for our purposes, as there is a moderate degree of correlation between colour and gas content, in the sense of red galaxies being more gas-poor (Toribio et al., 2011). Here ’dry’ mergers are between two ’red’ galaxies, ’wet’ mergers between two ’blue’ galaxies and ’damp’ mergers contain one member of each.
Another possible definition uses morphology. Galaxy profiles (single Sérsic models) have been derived for GAMA galaxies in Kelvin et al. (2012). We define galaxies with as spheroid-dominated and those with as disk-dominated. More spheroid-dominated galaxies are known to be more gas poor and we can therefore use this as a proxy of relative ’dryness’. Here, dry mergers are those between two spheroid-dominated galaxies, while wet mergers are those between two disk-dominated objects, with damp mergers having one member of each class. The derived pair fractions and volume merger rates for dry, wet and damp mergers (selected by colour and morphology, as above) are tabulated in Tables 3 and 4 respectively.
| Luminosity Range | Redshift Range | Blue Pairs | Red Pairs | Mixed Pairs | Disk Pairs | spheroid Pairs | spheroid/Disk Pairs |
|---|---|---|---|---|---|---|---|
| Luminosity Range | Redshift Range | Blue Pairs | Red Pairs | Mixed Pairs | Disk Pairs | spheroid Pairs | spheroid/Disk Pairs |
|---|---|---|---|---|---|---|---|
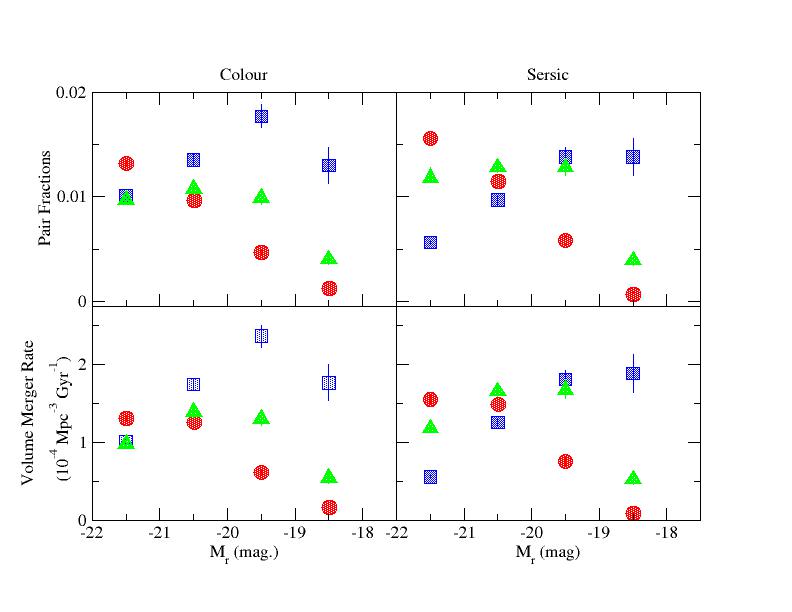
Figure 3 shows the pair fractions and volume merger rates for galaxies, split into dry, wet and damp mergers. For the brighter luminosity range, we also tabulate separate results for the samples at and at (but note that as in the previous figure we do not show this datapoint in Fig. 3 to avoid confusion).
We observe dry mergers to be rare in our most luminous sample at , in agreement with previous results by Masjedi et al. (2006, 2008); Wen et al. (2009); Robaina et al. (2010) and Jiang et al. (2012). The dry merger rate also decreases monotonically as a function of luminosity. There are very few faint dry mergers. It appears therefore unlikely that the red sequence can be built by this process at least since as probed in this study. Most mergers at the faint end are wet and their relative contribution increases with decreasing . Damp mergers are intermediate between the behaviour of red and blue pairs. This is true for samples selected by colour or Sérsic index. The intermediate behaviour of damp mergers suggests that galaxies in pairs are selected almost at random from the parent population and therefore that presence in a close pair does not strongly affect the properties of the galaxies. We will examine this in greater detail below. In the brightest luminosity bin we also find evidence of only flat evolution in the merger rate, irrespective of colour or morphology, since , suggesting that there has been no change in the makeup of merging pairs (at least for massive galaxies) over the last Gyr of the history of the Universe.
3.2 Cosmic Variance
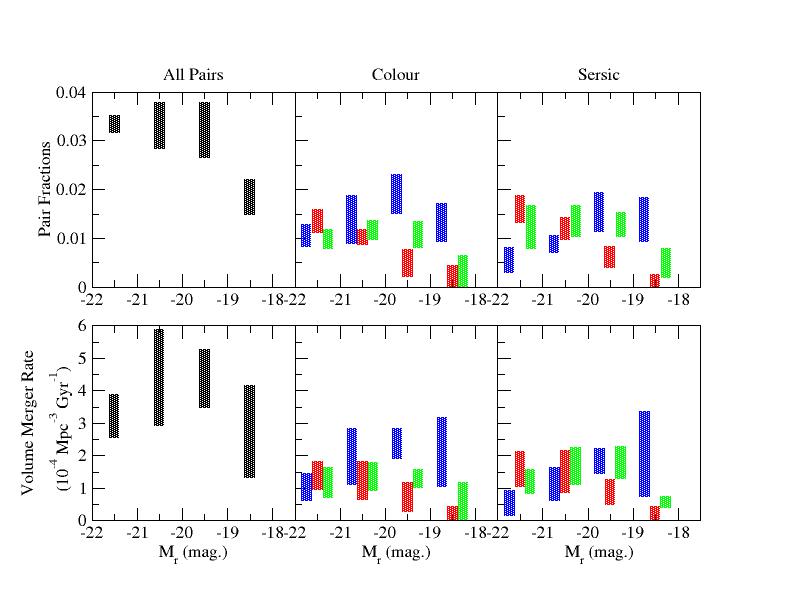
As GAMA consists of three separate regions, we calculate the pair fractions and volume merger rates for galaxies in each separate region to estimate the cosmic variance. This is shown in Fig. 4 for the full sample as well as for dry, wet and damp mergers (by colour and morphology). We have applied small shifts in luminosity in this figure for reasons of clarity. The cosmic variance over volumes of Mpc3 is approximately a factor of 2, in reasonable agreement with the estimate by Lopez-Sanjuan et al. (2014) from the ALHAMBRA survey.
4 The Properties of Galaxies in Pairs
We now compare the properties of galaxies in pairs (colour, morphology, environmental density and degree of activity, such as star formation or AGNs, measured from the BPT index of Baldwin et al. 1981) to those of more isolated (i.e., not in close pairs) galaxies in the volume-limited region from which the pairs are drawn. We divide all galaxies into bins of colour, morphology, environmental density and BPT class and compute the fractions of galaxies in each bin, for objects in close pairs and for their parent sample (more isolated systems) in the same volume. We then calculate the fractional difference (pairs – parent sample) in each colour (morphology, environment, BPT class) bin. A negative value means that there is a relative deficit of galaxies in close pairs in the appropriate colour (morphology, etc.) bin (i.e., they are less frequent) and vice-versa for a positive value. In this way we can asses how membership in a close pair and the on-going interaction affects the properties of galaxies (relative to similar objects in the same volume). We show the results of this analysis in Fig. 5–8 below.
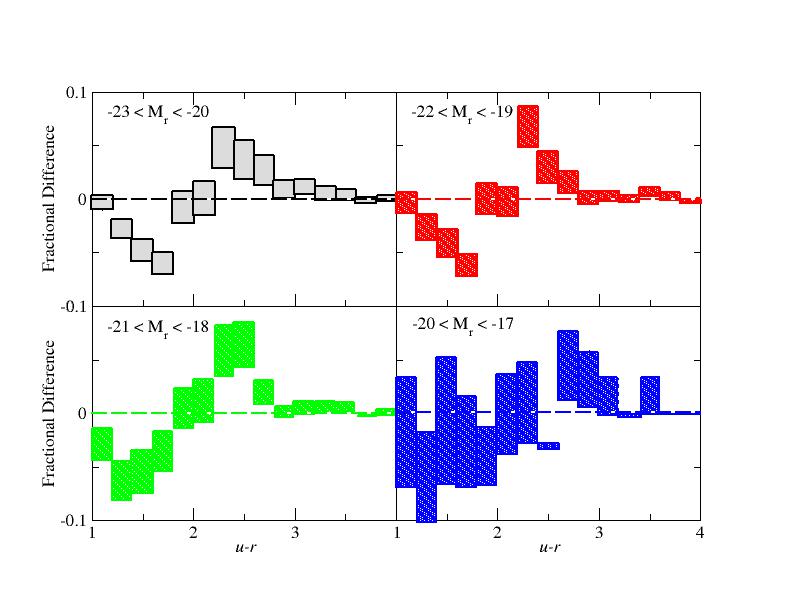
The colour distribution of galaxies is bimodal, as is well-known (Strateva et al., 2001; Baldry et al., 2004), with red galaxies becoming more prominent in the higher luminosity bins. In all cases, except the faintest luminosity range where most galaxies are blue, we note that pairs are overrepresented in the red peak and less frequent in the blue peak (Fig. 5). This argues that presence in a close pair does not trigger but rather tends to quench star formation. Similar claims of a greater frequency of red galaxies in pairs were earlier reported by Darg et al. (2010a) and Ellison et al. (2010). Chou et al. (2012) also find that close pairs tend to quench, and not enhance, star formation in their sample. Bergvall et al. (2003) argued that there is only a modest enhancement in star formation rates for a sample of highly interacting objects. In our previous study of pairs in the MGC (De Propris et al., 2005) we noticed a similar excess of red pairs, as well as an excess of blue pairs (and a deficit of green valley systems in pairs), which is not seen here. Darg et al. (2010a) suggest that the apparent increase in the fraction of blue galaxies in pairs in some previous studies may be due to greater visibility of gas-rich, star-forming objects, especially if pairs and mergers are selected by morphology.
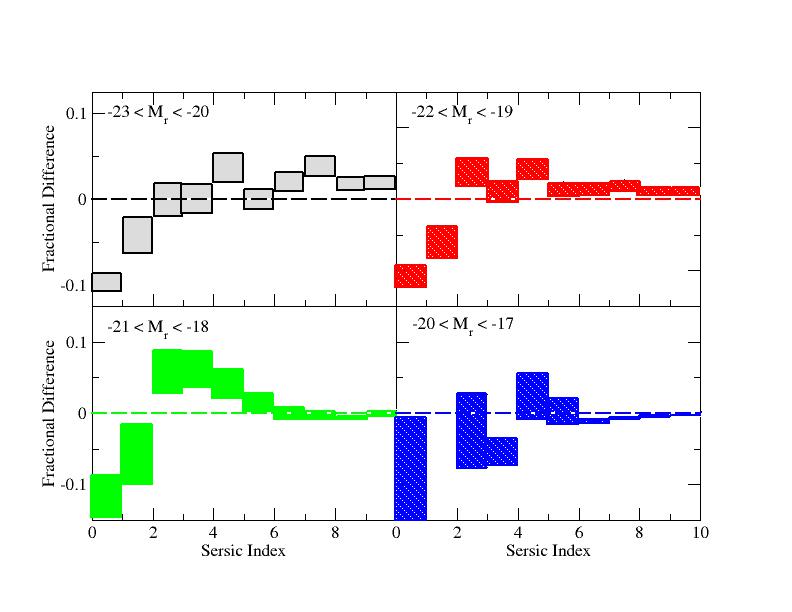
The distribution of Sérsic indices shows a deficit of ’disky’ galaxies among pairs, and a slight excess of more spheroid-dominated objects. This may imply a degree of morphological evolution as part of the merger process. We found a similar trend in MGC data (De Propris et al., 2005) with an excess of E/S0 and Sc/Sd galaxies in pairs compared to the MGC sample, and a deficit of intermediate spirals (see also Darg et al. 2010a). We also concluded (as do Darg et al. 2010a) that this is due to a combination of morphological evolution and induced star formation. Most of these changes (in colour and morphology) appear to take place close to the ’transition’ colour of or Sérsic index of . This may indicate that mergers and interactions do not cause abrupt changes in star formation rates or morphologies, but might simply accelerate or enhance an on-going process of secular evolution (as in the ’harassment’ scenario by Moore et al. 1996).
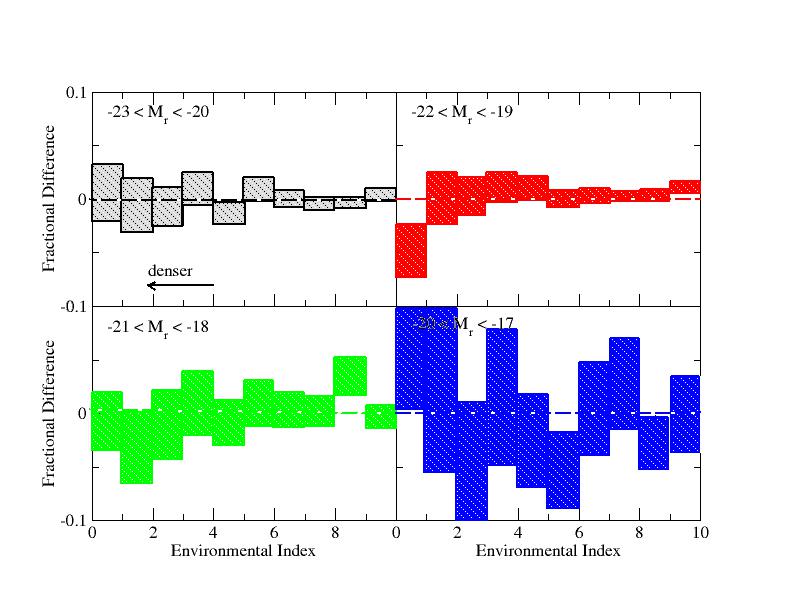
However, we cannot exclude the possibility that environment plays a role. Patton et al. (2011) notes a similar trend of increasing spheroid fractions among galaxies in pairs and attributes it to the denser environments in which pairs may reside, yielding larger spheroids because of the morphology-density relation. Deng & Zhang (2013) use a volume-limited sample in the SDSS and reach similar conclusions. We therefore look at the environmental density of galaxies in pairs vs. other (more isolated) galaxies in the same volume. Here, environmental density is defined using an index developed by Haas et al. (2012) who use the distance to the nearest neighbour within 1000 km s-1 and which is believed to provide a halo-independent measure of the environment of galaxies; this is more appropriate to our purposes (and less model-dependent) as we are chiefly interested in exploring whether differences in colour or morphology can be attributed to environmental effects. We derive this index from our GAMA data by applying the recipe of Haas et al. (2012): a shorter distance (i.e., closer 7th neighbour) implies a denser environment and vice-versa (higher value of this index implies a less dense environment). Generally, GAMA samples a variety of environments, but most galaxies lie in the field or groups, with only one large cluster known in the GAMA fields.
We show the fractional difference of galaxies (in pairs minus all other objects not in close pairs, as with previous figures) in Fig. 7. This does not support the hypothesis that galaxy pairs reside in more dense environments, in agreement with previous work by Darg et al. (2010b) and Ellison et al. (2010) that finds only a weak environmental dependence in the SDSS pairs (but see Kampczyk et al. 2013, who find a much stronger environmental trend, although this is at in the COSMOS field). The weak environmental dependence is somewhat surprising as simulations indicate a much stronger effect of environmental density than here observed (Jian et al., 2012).
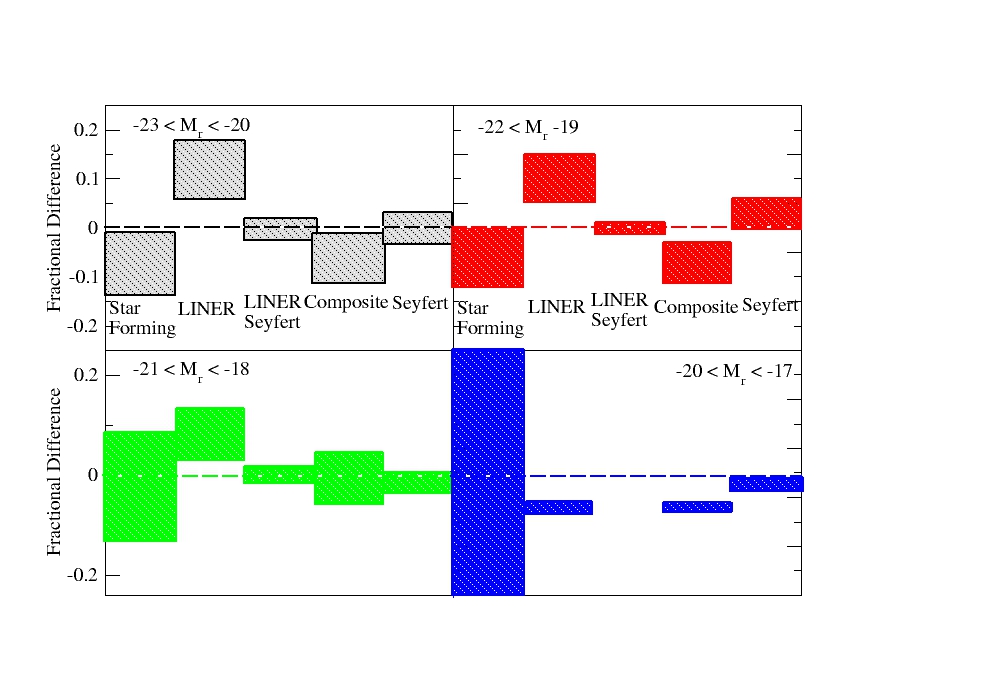
Finally we consider the BPT diagram (Fig. 8 to measure the degree of activity in galaxies in pairs and their parent sample. This classifies all emission-line galaxies as Star-forming, Seyfert, LINER, composite spectra between LINER and Seyfert or between Star Forming and Seyfert (here termed Composite) on the basis of emission line intensity ratios. We use the classification of Kauffmann et al. (2003) and Tremonti et al. (2004) as applied to SDSS DR8 (and later releases) data by Thomas et al. (2013). This is only a subset of all data in the GAMA survey but it includes about 1/3 of all galaxies in our sample and there is no apparent bias towards or against galaxies in pairs. In agreement with the relative weakness of the blue peak in the colour distribution of Fig. 5, we find a smaller fraction of active star-forming galaxies among pairs, but it is surprising to see that there is little or no evidence of increased AGN activity among galaxies in pairs compared to the volume-limited parent sample of objects. In all magnitude ranges we consider, there are fewer Seyfert or Composite (LINER+Seyfert or Star Forming+Seyfert) objects in the pairs sample, while LINERS are only marginally more common.
5 Discussion
We have measured pair fractions and merger rates for galaxies in the GAMA survey, with in a series of volume-limited samples and explored how the merger rate varies with luminosity, colour or morphology. We then considered how the properties of galaxies in close pairs (colour, morphology, environmental density and BPT class) compare to those of more isolated objects in the same volume to understand how galaxies are affected by mergers and interactions.
The merger fractions for galaxies in the GAMA survey are (assuming that 50% of mergers are dynamically bound) almost irrespective of luminosity. These are generally in good agreement with previous estimates of the pair fraction and merger rates in the local universe, as well as with the well-known flat evolution out to high redshift, as in the compilation by Lotz et al. (2011). Our previous local () estimate of the merger rate from the MGC (De Propris et al., 2005, 2007) is in good agreement with that presented here, although it concerns galaxies with . Patton & Atfield (2008) give but for galaxies with and only for pairs with luminosity ratios 1:2 or better, compared to our for galaxies with . However, although the pair fraction does not change strongly across this luminosity range, we include more minor mergers are well. Approximately 1/2 of our mergers have luminosity ratios of , which brings the pair fractions into agreement. Comparison of the actual volume merger rates requires understanding assumptions concerning the space density of galaxies and assumed merger timescales, which are not fully transparent. Finally, the lower redshift points of Kartaltepe et al. (2007) and Lin et al. (2008) are reasonably close to our values, despite the somewhat different selection criteria in each case.
The volume merger rates are seen to decrease significantly at both high and low luminosities in our sample. Given the measured accretion rates and evolution of the merger rate, we estimate that the total stellar mass growth (given the luminosity accretion rates and reasonable mass to light ratios) of galaxies in the past 1/2 of the Hubble time due to mergers lies in the range of 10% to 30%. This assumes merger timescales as discussed above, a 50% ’true’ merger fraction and the flat evolution of the merger rate found in this work to and measured to by other studies (e.g., Lin et al. 2008; de Ravel et al. 2009. Lopez-Sanjuan et al. (2012) estimate a similar for the growth rate of galaxies since . However, these tend to be more massive than the GAMA sample which is generally between .
The trend of merger rates with luminosity and redshift is instead not in good agreement with predictions from dark matter simulations such as Murali et al. (2002) and Maller et al. (2006). This is significantly lower than estimates of the mass growth of galactic halos in simulations (e.g., van den Bosch 2002; Cattaneo et al. 2011), which on average double the mass of galaxies since . The discrepancy may be reduced if the merger rate evolution with redshift is faster but our data for the brighter galaxies are consistent with a flat or declining evolution since , irrespective of colour or morphological type, as previously observed for similarly luminous galaxies at higher redshifts by Bundy et al. (2004); Lin et al. (2004, 2008) and de Ravel et al. (2009). In the compilation of Lotz et al. (2011), the merger rate evolves as for luminosity (or mass) selected samples, in agreement with very slow growth rates by major merging for massive galaxies. Robotham et al. (2014, MNRAS submitted) also find that the evolution of the merger rate is close to flat.
Our data allow us to consider the local dry, wet and damp merger rate. Dry mergers (between either red or spheroid-dominated galaxies) are observed to be rare in the local universe, in agreement with several previous studies (Masjedi et al., 2006, 2008; Wen et al., 2009; Robaina et al., 2010; Jiang et al., 2012), while we also observe that dry mergers are less frequent as a function of decreasing luminosity. We find evidence of slow evolution for at least the more massive (luminous) systems. In our close pair study of luminous red galaxies at we measured a stringent upper limit of per Gyr, which is consistent with flat evolution of the dry merger rate out to at least . Chou et al. (2012) also confirm the slow growth of the dry merger rate as a function of redshift out to . It is therefore unlikely that the red sequence is formed by dry mergers at least in the past 1/3 of the Hubble time. Most mergers between lower luminosity galaxies are instead wet (and the rate increases towards lower luminosities) while damp mergers are intermediate.
When we compare the colour distribution of galaxies in pairs with that of galaxies in their volume-limited parent sample, we observe a deficit of blue objects and an excess of red galaxies. This argues for suppression of star formation in galaxy pairs, as noted earlier by Darg et al. (2010a) and Ellison et al. (2010). This is somewhat surprising in the light of theoretical expectations that mergers and interactions boost the star formation and activity rates (e.g., Mihos & Hernquist 1996). We confirm this from our analysis of BPT classes where there is a lower fraction of star-forming galaxies among close pairs compared to galaxies in the same volume. Bergvall et al. (2003) found only a modest degree of enhancement of star formation for interacting pairs, contributing little to the luminosity; Lin et al. (2007) also find only a modest enhancement of star formation in galaxy pairs in a wide range of merger stages; Li et al. (2008) instead find that the enhancement in star formation, in a sample of star-forming galaxies, increases with decreasing separation but does not depend on the luminosity ratio, although it is stronger for lower-mass galaxies; for massive galaxies, Robaina et al. (2009) find that only 10% of star formation is due to major interactions (albeit at higher redshifts than studied here); Patton et al. (2011) also detect an excess of red galaxies in pairs and attribute this to denser environments and hence more significant spheroids (because of the morphology-density relation); Chou et al. (2012) confirm that most close pairs are red and not blue; Deng & Zhang (2013) also finds evidence that interactions are not generally responsible for star formation bursts in two volume-limited samples drawn from the SDSS; Cluver et al. (2014) study star formation for galaxies in groups and claim that galaxies with a close neighbour have lower star formation rates. Similarly, we find that, by comparing the distributions of Sérsic indices for galaxies in pairs and their parent samples, there is a relative lack of ’disks’ and excess of ’spheroids’ among paired galaxies as in Patton et al. (2011). spheroids are generally associated with suppression of star formation, but it is not clear whether this a cause or an effect (McGee et al., 2011). If pairs lie in more dense environments, they will contain more prominent spheroids (by the standard morphology-density relation) and therefore have lower star formation rates (as suggested by Patton et al. 2011, explaining the excess of red galaxies among pairs found above. However, in our sample, we do not find that galaxies in pairs lie in significantly different environments (as do Darg et al. 2010b and Ellison et al. 2010 who find only a mild environmental dependence). This suggests a degree of morphological evolution is also associated with star formation suppression in these objects. Li et al. (2008) show that tidal interactions may indeed cause an increase in galaxy concentration, which is an indicator of more significant spheroids. However, this is not due to the fact that the galaxies lie in more dense environments and are more spheroid-dominated (and therefore more quiescent). Rather, it appears that the extra spheroid light is related to the suppression of star formation and presence in a close pair, although it is not possible to determine from the present sample whether quenching or morphological evolution occur first (Li et al., 2008).
One mechanism by which we may explain these findings is ‘harassment’ (Moore et al., 1996). Galaxies in these close pairs are likely to have undergone a series of previous encounters and close passes; Patton et al. (2013) argues that about 2/3 of the star formation in close pairs takes place at separations above 30 kpc. This leads to a gradual suppression of star formation as gas is exhausted or driven out, while dynamical relaxation leads to secular evolution of spheroids without mergers. Chou et al. (2012) also suggest that in their sample star formation is triggered at large radii and then suppressed to form red close pairs. Robotham et al. (2013) point out the role of mergers and interactions in suppressing star formation in most galaxy pairs, while Trihn et al. (2013) present an analysis of the properties of single and widely spaced paired galaxies in the SDSS and find evidence of delayed quenching, over timescales of a few Gyrs, consistent with a ‘harassment’ scenario as proposed here. On the other hand, an Integral Field Unit study of the Mice pair, shows that little star formation has been induced so far (Wild et al., 2014).
The BPT classifications, from emission line diagnostics, support the observation that galaxies in pairs are less active than their counterparts in the same volume. As remarked above, there is a deficit of star-forming galaxies in pairs. Surprisingly, there is also no evidence of excess AGN activity in galaxies in pairs. This is surprising as one expects mergers to trigger nuclear activity (Mihos & Hernquist, 1996; Springel et al., 2005; Hopkins et al., 2008). In these models AGNs occur at or shortly after final coalescence so we should expect double QSOs in close pairs (Comerford et al., 2009). Bessiere et al. (2012), however, find QSOs at several stages of the merging process even before the final merger. On the other hand, Cisternas et al. (2011) show that AGNs do not lie in more disturbed hosts and conclude that mergers are not necessarily responsible for nuclear activity. Teng et al. (2012) search for double QSOs in pairs of galaxies where one member is already known to host an AGN and find only one such case out of twelve objects. This suggests that nuclear activity is not necessarily related to the on-going mergers or interactions in these objects. Ellison et al. (2008) also reports on a relative lack of AGN activity in close pairs from the SDSS although Patton et al. (2011) claims to find some enhancement from the same sample. Deng et al. (2013) also argue that there is less than 1 significance for AGN triggering in mergers from a volume-limited sample of SDSS galaxies. We find no evidence of AGN activity in strongly interacting mergers and merger remnant post-starburst galaxies in De Propris & Melnick (2014), although there are indications of centrally concentrated star formation and inside-out quenching in these objects. Other studies find a stronger correlation between presence in a close pair and AGN activity (Patton et al., 2011). In some cases, these discrepancies may be due to issues of selection, including the use of emission-line diagnostics rather than X-ray or mid-IR fluxes.
At face value our findings minimise the importance of major mergers and interactions for galaxy evolution and argue that most galaxy evolution takes place via internal and secular processes, as well as minor mergers, at least at low redshift. This is also the conclusion of several studies in this field (e.g., Lopez-Sanjuan et al. 2012; Huang et al. 2013; Kaviraj et al. 2013; McLure et al. 2013; Fritz et al. 2014) and is broadly in agreement with more recentmodels where minor mergers and secular evolution may play more important roles in galaxy evolution in the past 1/2 of the Hubble time (e.g., Guo & White 2008; Parry et al. 2009).
References
- Abraham et al. (2003) Abraham R., van den Bergh S., Nair P. 2003, ApJ, 588, 218
- Ahn et al. (2012) Ahn C. P. et al. 2012, ApJS, 203, 21
- Baldry et al. (2004) Baldry I. K. et al. 2004, ApJ, 600, 681
- Baldry et al. (2010) Baldry I. K. et al. 2010, MNRAS, 404, 86
- Baldwin et al. (1981) Baldwin J. A., Phillips M. M., Terlevich R. 1981, PASP, 93, 5
- Baugh (2006) Baugh C. M. 2006, Reports on Progress in Physics, 69, 3101
- Bell et al. (2004) Bell E. F. et al. 2004, ApJ, 608, 752
- Bergvall et al. (2003) Bergvall N., Laurikainen E., Aalto S. 2003, A&A, 405, 31
- Berrier et al. (2006) Berrier J. C., Bullock J. S., Barton E. J., Guenther H. D., Zentner A. D., Wechsler R. H. 2006, ApJ, 652, 56
- Bessiere et al. (2012) Bessiere P. S., Tadhunter C. N., Ramos Almeida C., Villar Martin M. 2012, MNRAS, 426, 276
- Blumenthal et al. (1984) Blumenthal G. R., Faber S. M., Primack J. R., Rees M. J. 1984, Nature, 311, 517
- Boylan-Kolchin et al. (2008) Boylan-Kolchin M., Ma C.-P., Quataert E. P. 2008, MNRAS, 383, 93
- Bridge et al. (2010) Bridge C., Carlberg R., Sullivan M. 2010, ApJ, 709, 1067
- Bruzual & Charlot (2003) Bruzual G., Charlot S. 2003, MNRAS, 344, 1000
- Bundy et al. (2004) Bundy K., Fukugita M., Ellis R. S., Kodama T., Conselice C. J. 2004, ApJ, 601, L123
- Casteels et al. (2013) Casteels K. et al. 2013, MNRAS, 429, 1051
- Cattaneo et al. (2011) Cattaneo A., Mamon G. A., Warnick K., Knebe A. 2011, A&A533, 5
- Chou et al. (2012) Chou R. C. Y., Bridge C. R., Abraham R. G. 2012, ApJ, 760, 113
- Cisternas et al. (2011) Cisternas M. et al. 2011, ApJ, 726, 57
- Cluver et al. (2014) Cluver M. E. et al. 2014, ApJ, 782, 90
- Colless et al. (2001) Colless M. M. et al. 2001, MNRAS, 328, 1039
- Comerford et al. (2009) Comerford J. M., Gerke B. F., Newman J. A. et al. 2009, ApJ, 698, 956
- Conselice (2003) Conselice C. 2003, ApJS, 147, 1
- Cotini et al. (2013) Cotini S., Ripamonti E., Caccianiga A., Colpi, M., Della Ceca R., Mapelli M., Severgnini P., Segreto A. 2013, MNRAS, 431, 2661
- Darg et al. (2010a) Darg D. W. et al. 2010a, MNRAS, 401, 1043
- Darg et al. (2010b) Darg D. W. et al. 2010b, MNRAS, 401, 1552
- Deng & Zhang (2013) Deng X.-F., Zhang F. 2013, Baltic Astronomy, 22, 123
- Deng et al. (2013) Deng X.-F., Yu G., Jiang P. 2013, PASA, 30, 18
- De Propris et al. (2005) De Propris R., Liske J., Driver S. P., Allen P. D., Cross N. J. G. 2005, AJ, 130, 1516
- De Propris et al. (2007) De Propris R., Conselice C. J., Liske J., Driver S. P., Patton D. R., Graham A. W., Allen P. D. 2007, ApJ, 666, 212
- De Propris et al. (2010) De Propris R. et al. 2010, AJ, 139, 794
- De Propris & Melnick (2014) De Propris R., Melnick J. 2014, MNRAS, 439, 2837
- de Ravel et al. (2009) de Ravel L. et al. 2009, A&A, 498, 379
- Driver et al. (2005) Driver S. P., Liske J., Cross N. J. G., De Propris R., Allen P. D. 2005, MNRAS, 360, 81
- Driver et al. (2011) Driver S. P. et al. 2011, MNRAS, 413, 971
- Ellison et al. (2008) Ellison S. L., Patton D. R., Simard L., McConnachie A. W. 2008, AJ, 135, 1877
- Ellison et al. (2010) Ellison S. L., Patton D. R., Simard L., McConnachie A. W., Baldry I. K., Mendel T. J. 2010, MNRAS, 407, 1514
- Faber et al. (2007) Faber S. M. et al. 2007, ApJ, 665, 265
- Fritz et al. (2014) Fritz A. et al. 2014, A&A, 563, 92
- Genel et al. (2009) Genel S., Genzel R., Bouché N., Naab T., Sternberg A. 2009, ApJ, 701, 2002
- Guo & White (2008) Guo Q., White S. D. M. 2008, MNRAS, 384, 2
- Haas et al. (2012) Haas M. R., Schaye J., Jeeson-Daniel A. 2012, MNRAS, 419, 2133
- Holmberg (1941) Holmberg E. J. 1941, ApJ, 94, 385
- Hopkins et al. (2008) Hopkins P. F., Hernquist L., Cox T. J., Keres D. 2008, ApJS, 175, 356
- Hopkins et al. (2013) Hopkins A. M. et al. 2013, MNRAS, 434, 2047
- Huang et al. (2013) Huang S.. Ho L. C., Peng C. Y., Li Z.-Y., Barth A. J. 2013, ApJ, 768, L28
- Jian et al. (2012) Jian H.-Y., Lin L., Chiueh T. 2012, ApJ, 754, 26
- Jiang et al. (2008) Jiang C. Y., Jing Y. P., Faltenbacher A., Lin W. P., Li Cheng 2008, ApJ, 675, 1095
- Jiang et al. (2012) Jiang T., Hogg D. W., Blanton M. R. 2012, ApJ, 759, 140
- Jogee et al. (2009) Jogee S. et al. 2009, ApJ, 697, 1971
- Kampczyk et al. (2013) Kampczyk P. et al. 2013, ApJ, 762, 43
- Kartaltepe et al. (2007) Kartaltepe J et al. 2007, ApJS, 172, 320
- Kauffmann et al. (2003) Kauffmann G. et al. 2003, MNRAS, 346, 1055
- Kaviraj et al. (2013) Kaviraj S. et al. 2013, MNRAS, 429, L40
- Kelvin et al. (2012) Kelvin L. et al. 2011, MNRAS, 421, 1007
- Kitzbichler & White (2008) Kitzbichler M., White S. D. M. 2008, MNRAS, 391, 1389
- Li et al. (2008) Li C., Kauffmann G., Heckman T. M., Jing Y. P., White S. D. M. 2008, MNRAS, 385, 1903
- Lin et al. (2004) Lin L. et al. 2004, ApJ, 617, L9
- Lin et al. (2007) Lin L. et al. 2007, ApJ, 660, L51
- Lin et al. (2008) Lin L. et al. 2008, ApJ, 681, 232
- Liske et al. (2003) Liske J., Lemon D., Driver S. P., Cross N. J. G., Couch W. J. 2003, MNRAS, 344, 307
- Lopez-Sanjuan et al. (2011) Lopez-Sanjuan C. et al. 2011, A&A, 530, 20
- Lopez-Sanjuan et al. (2012) Lopez-Sanjuan C. et al. 2012, A&A, 548, 7
- Lopez-Sanjuan et al. (2014) Lopez-Sanjuan C. et al. 2014, astro-ph, 1401.4993
- Lotz et al. (2004) Lotz J. M., Primack J. R., Madau P. 2004, AJ, 128, 163
- Lotz et al. (2010) Lotz J. et al. 2010, MNRAS, 404, 590
- Lotz et al. (2011) Lotz J. M., Jonsson P., Cox T. J., Croton D., Primack J. R., Somerville R. S., Stewart K. 2011, ApJ, 742, 103
- Masjedi et al. (2006) Masjedi M. et al. 2006, ApJ, 644, 54
- Masjedi et al. (2008) Masjedi M., Hogg D. W., Blanton M. R. 2008, ApJ, 679, 260
- McGee et al. (2011) McGee S. L. et al. 2011, MNRAS, 413, 996
- McLure et al. (2013) McLure R. J. et al. 2013, MNRAS, 428, 1088
- Mihos & Hernquist (1996) Mihos J. C., Hernquist L. 1996, ApJ, 464, 641
- Mo et al. (2010) Mo H., van den Bosch F., White S. D. M. 2010, Galaxy Formation and Evolution, Cambridge: Cambridge University Press
- Maller et al. (2006) Maller A. H., Katz N., Keres D., Davé R., Weinberg D. H. 2006, ApJ, 647, 763
- Moore et al. (1996) Moore B., Katz N., Lake G., Dressler A., Oemler A. 1996, Nature, 379, 613
- Moreno et al. (2013) Moreno J., Bluck A. F. L., Ellison S. L., Patton D. R., Torrey P., Moster B. P. 2013, MNRAS, 436, 1765
- Murali et al. (2002) Murali C., Katz N., Hernquist L., Weinberg D. H., Davé R. 2002, ApJ, 571, 1
- Norberg et al. (2001) Norberg P. et al. 2001, MNRAS, 328, 64
- Parry et al. (2009) Parry O. H., Eke V. R., Frenk C. S. 2009, MNRAS, 396, 1972
- Patton et al. (2000) Patton D. R., Carlberg R. G., Marzke R. O., Pritchet C. J., da Costa L. N., Pellegrini P. S. 2000, ApJ, 536, 153
- Patton et al. (2002) Patton D. R. et al. 2002, ApJ, 565, 208
- Patton & Atfield (2008) Patton D. R., Atfield J. E. 2008, ApJ, 685, 235
- Patton et al. (2011) Patton D. R., Ellison S. L., Simard L., McConnachie A. W., Mendel J. T. 2011, MNRAS, 412, 591
- Patton et al. (2013) Patton D. R., Torrey P., Ellison S. L., Mendel J. T., Scudder J. M. 2013, MNRAS, 433, L59
- Peng et al. (2010) Peng C.-Y., Ho L. C., Impey C. D., Rix H.-W. 2010, AJ, 139, 2097
- Perret et al. (2013) Perret V., Renaud F., Epinat B., Amram P., Bournaud F., Contini T., Teyssier R., Lambert J.-C. 2014, A&A, 562, 1
- Robaina et al. (2009) Robaina A. et al. 2009, ApJ, 704, 324
- Robaina et al. (2010) Robaina A. et al. 2010, ApJ, 719, 844
- Robotham et al. (2013) Robotham A. S. G. et al. 2013, MNRAS, 431, 167
- Ryan et al. (2007) Ryan R. E., Cohen S. G., Windhorst R. A., Silk J. 2007, ApJ, 678, 751
- Skelton et al. (2012) Skelton R. E., Bell E. F., Somerville R. S. 2012, ApJ, 753, 44
- Springel et al. (2005) Springel V., di Matteo T., Hernquist L. 2005, MNRAS, 361, 766
- Stewart et al. (2009) Stewart K. R., Bullock J. S., Bartin E. J., Wechsler R. H. 2009, ApJ, 702, 1005
- Strateva et al. (2001) Strateva I. et al. 2001, AJ, 122, 1861
- Taylor et al. (2011) Taylor E. N. et al. 2011, MNRAS, 418, 1587
- Teng et al. (2012) Teng S. H. et al. 2012, ApJ, 753, 165
- Thomas et al. (2013) Thomas D. et al. 2013, MNRAS, 431, 1383
- Toomre & Toomre (1972) Toomre A., Toomre J. 1972, ApJ, 178, 623
- Toomre (1977) Toomre A. 1977 in Evolution of Galaxies and Stellar Populations, ed. B. M. Tinsley and R. B. Larson, p. 401 (New Haven: Yale University Press)
- Toribio et al. (2011) Toribio M. C., Solanes J. M., Giovanelli R., Haynes M. P., Martin A. M. 2011, ApJ, 732, 93
- Tremonti et al. (2004) Tremonti C. et al. 2004, ApJ, 613, 898
- Trihn et al. (2013) Trinh C. Q., Barton E. J., Bullock J. S., Cooper M. C., Zentner A. R., Wechsler R. H. 2013, MNRAS, 436, 635
- van den Bosch (2002) van den Bosch F. C. 2002, MNRAS, 331, 98
- van Dokkum (2005) van Dokkum P. G. 2005, AJ, 130, 2647
- Wen et al. (2009) Wen Z. L., Liu F. S., Han J. L. 2009, ApJ, 692, 511
- Wild et al. (2014) Wild V. et al. 2014, arXiv 1405.7814
- Williams et al. (2011) Williams R., Quadri F., Franx M. 2011, ApJ, 738, L25
- Xu et al. (2004) Xu C. K., Sun Y. T., He X. T. 2004, ApJ, 603, L73
- York et al. (2000) York D. G. et al. 2000, AJ, 120, 1579
- Zwicky (1953) Zwicky F. 1953, Physics Today, 6, 7
- Zwicky (1956) Zwicky F. 1956, Ergebnisse der exakten Naturwissenschaften 29, 344