Permutation approach, high frequency trading and variety of micro patterns in financial time series
Cina Aghamohammadia 111e-mail: caghamohammadi@ucdavis.edu ,
Mehran Ebrahimianb 222e-mail: m_ebrahimian@gsme.sharif.edu ,
Hamed Tahmooresic 333e-mail: tahmooresi@ce.sharif.edu,
aPhysics Department, University of California, Davis, California 95616, USA
bGraduate school of management and economic, Sharif University of Technology, 8639-11155, Tehran, Iran
cDepartment of Computer Engineering, Sharif University of Technology, 11155-9517, Tehran, Iran
Abstract
Permutation approach is suggested as a method to investigate financial time series in micro scales. The method is used to see how high frequency trading in recent years has affected the micro patterns which may be seen in financial time series. Tick to tick exchange rates are considered as examples. It is seen that variety of patterns evolve through time; and that the scale over which the target markets have no dominant patterns, have decreased steadily over time with the emergence of higher frequency trading.
1 Introduction
In the middle of sixties, the algorithmic complexity theory was independently developed by Kolmogorov [1] and Chaitin [2]. To parameterize complexity in deterministic or random dynamical systems, the most important quantity which may be used is entropy. There are different ways to count the diversity of any pattern generated by a data source: Shannon entropy, metric entropy, topological entropy, etc. After the seminal works of Shannon [3], in 1949 the word entropy came to the fore in the new context of information theory, coding theory, and cryptography. Recently the concept of entropy is also used in econophysics (see [4, 5] and references therein) and sociodynamics [6]. The concept of entropy has been evolved along different ways: Renyi entropy [7], topological entropy [8], Tsallis entropy [9], directional entropy [10], permutation entropy [11], epsilon-tau entropy [12], etc. Permutation entropy was introduced by Bandt, Keller, and Pompe in [13, 14]. Entropies are basic observables for dynamical systems. In [14] a piecewise monotone map from an interval into itself is defined, and it is shown that for piecewise monotone interval maps the Kolmogorov-Sinai entropy can be obtained from order statistics of the values in a generic orbit. It has been shown that it is possible to use the permutation entropy to detect dynamical changes in a complex time series [15].
Recently, permutation entropy has been used to study dynamical changes of EEG data [16]; and based on permutation entropy, mutual information of two oscillators has been calculated [17].
In this article variety of micro patterns in financial time series have been studied. Variety of patterns in financial time series is an important measure. In a completely random series all different patterns may occur with equal weight. If some patterns in a time series are much less than the others, the time series contains dominant patterns. These dominant patterns represent some characteristics of the system, which needs to be revealed. This information also could be used for prediction of future changes, which for financial time series represent inefficiency in the target market. There are several definition for the efficient market hypothesis (EMH) [18, 19, 20]. According to the EMH hypothesis, asset prices move as random walks over time, and technical analysis should provide no useful information to predict future changes [21]. This means that asset prices in an efficient market fluctuate randomly in response to the unanticipated component of news [22]. Some people take EMH as a core assumption in finance theory [23]. But many physicists consider it only an approximation [24]. According to EMH, in an efficient market variety of patterns for increments of the price in different scales should be at maximum level.
It is now known that most markets behave efficiently in macro scale, and there are no dominate patterns in their financial time series. But it seems that the investigation of micro patterns, and searching for dominant patterns by participants in markets, in recent years, have faded those patterns. Permutation entropy is taken as a criteria for measuring the variety of micro patterns which may be seen in financial time series. Tick to tick exchange rate time series are considered as an example.
2 Definition
Consider a set of distinct real numbers, . One may define a map from these numbers to the set in such a way that the ordering of the second set is the same as the first one. The range of this map will be permutations. The permutation corresponding to is called the pattern, and is denoted by . See fig. 1, for the case . Consider a time series . By a window of length , we mean any subsequence of the form . There are windows of length , to each of them there corresponds a pattern . If is a given pattern, we define
| (1) |
where is the number of consecutive numbers with pattern . For large , tends to the probability of occurring the pattern . Permutation entropy of order of a time series, , is defined as (see e.g. [13])
| (2) |
It can be shown that [25]. Upper bound occurs when all ’s have the same value, i.e. when the time series is a completely random series; and the lower bound occurs when only one of ’s is nonzero, which happens when the time series is a decreasing or increasing sequence.
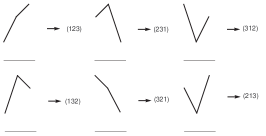
Permutations , for
In some cases a linear function is a good approximation. This means that for these time series, in the view of permutation entropy, there are just two degrees of freedom for the time series444Of course this is not a common case, for example, in a completely random time series , for large , which is not a linear function of ..
For large , determines the behavior of . To quantize the variety of patterns in this type of time series one may use the parameter .
It is useful to define a new parameter, which is the permutations entropy of order of a time series per symbol:
| (3) |
The denominator is , because calculating a change means . For large , converges to . Therefore to calculate one can find the slope of as a function of .
3 The problem
If the information embodied in a time series cannot be compressed, the time series is called unpredictable. As it is stated in [26], no difference can be detected between a time series carrying a large amount of non-redundant economic information and a pure random process, and it is well-known that the financial time series carries a large amount of non-redundant information. Therefore, the complexity of time series can be measured by assigning a measure to the variety of patterns which are embedded in time series.
We have analyzed the exchange rates as a time series. The data we have used, are tick to tick exchange rates of USD/JPY, EUR/GBP and GBP/CHF for 2003 which are time series of about 5000,000 data points, denoted by . Let us calculate for . As it is seen from fig. 2, is a linear function of . So it is more useful to work with . To calculate we need for large . The difference between and is less than 5%. From now on by large , we mean , and we take as an approximation of .

The plot of , and as a function of . In some cases, such as a completely random time series, for large does not behave as a linear function of , for example in this special case behave as .
The plot of normalized complexity over time. is calculated for windows of length 10000. To obtain the time dependence of parameter, in each time step the window is shifted by 2000.
4 Variety of micro patterns in exchange rates
The dynamics of the parameter may represent the dynamics of complexity of the financial time series over time. It could also be used as a measure of complexity of financial time series.
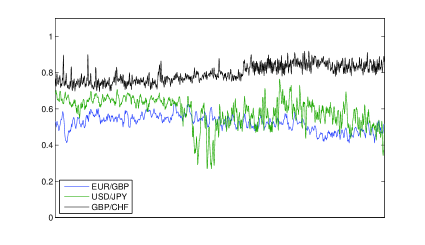
One may take a completely random series as a reference series, and compare the complexity of a financial time series with that of a completely random one. Since is not a proper parameter for a completely random series, we should take instead of . To compare the complexity of a time series with the complexity of completely random series, one may normalize it by dividing . Let us calculate for windows of length . To obtain the time dependence of this parameter, in each time step the window is shifted by 2000. The result for the exchange rate time series is shown in fig. 3. It is seen that tick to tick exchange rates time series show much less variety of micro patterns when compared with completely random series. This means that some patterns occur more than other patterns in these time series. So in micro scale some patterns can be seen more than the others.
5 High frequency trading and its effect on fading patterns
Recently technology development leads to quick news release, improving the quality of data analysis, better information sharing, and increasing the number of participants in financial markets. In 2009 high frequency trading accounts for over 60% of the financial exchanges trading volume [27]. High frequency trading strategies are characterized by a higher number of trades and a lower average gain per trade. Currently, there are categories of high-frequency trading strategies. Some of them are based on the investigation of micro patterns. Typically the holding period of these strategies are less than 1 minute. The micro patterns observed in the financial time series have been affected by these technology developments. We believe that the recent investigations of the micro patterns, and searching for the dominant patterns by participants in the markets, have faded those patterns. We now present our reasoning.
In an efficient market, the future price is determined entirely by the information which is not contained in the price series. This means that price changes are random, and the variety of patterns are at the maximum level. Financial time series may behave differently on different time scales [28, 29, 30, 31, 32]. We investigate the variety of patterns in a financial time series on different time scales. If we enlarge the sampling interval time from tick to tick to higher intervals, the sampling rate would decrease, and as a result high frequency contributions in the original time series will be removed. By high frequencies we mean those with time change less than the new sampling interval time. Finally, we compute the contributions of high frequencies in the complexity, for , See fig. 4. It is seen that removing high frequencies leads to increasing the complexity in the time period. This means that in larger scales, by the variety of patterns, these time series behave more similar to a complete random series, which is already known. But it is important to notice that in 2003, for 16 ticks period, there is still a large difference between these time series and a completely random series. It should be stated that for the time series we have used, the bid ask bounce effect appears only on 1 tick scale. Therefore, this market behaves inefficiently in both the micro and the macro scales; however, in the micro scale the market is more inefficient.
To test the accuracy of the theory of fading dominant patterns, and to investigate how the variety of patterns evolve in time, data for USD/JPY, EUR/GBP and GBP/CHF for 2003, 2009 and 2012 have been also analyzed. Normalized complexity of permutation patterns, , for first difference of exchange rates are computed and shown in tables 1, 2, and 3.
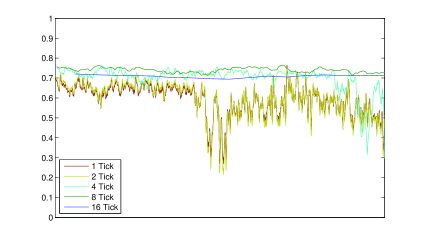
Normalized complexity of USD/JPY as a function of time for different sampling rate, e.g. for 16 ticks plot, the first data point is taken and the other 15 data points are discarded.
The sizes of data used in the tables are different. Consider the data with minimum size. Using Monte Carlo method, we have seen that the parameter , for a sample realizations of random walk with that minimum size, in 99% of cases is more than 0.98. So the number 0.98 could be taken as a critical value for rejection/acceptance ratio of the Efficient Market Hypothesis.
As it is seen from the figures, in 2012 the variety of patterns evolve through time , and for 4 ticks scale there are no dominant patterns i.e., the scale over which the target markets have no dominant patterns, decreases steadily over time with the emergence of higher frequency trading. Although there are still many attempts by the traders to find dominant patterns in micro scales; from our analysis we see that searching for dominant patterns is useless for liquid markets.
|
|
|
6 Conclusion
Variety of micro patterns in a financial time series is an important measure, and investigating it may provide useful information about the target market. In this article it is shown that, permutation entropy may be taken as a useful criteria for measuring variety of micro patterns which appears in financial time series. The permutation entropies of order for some financial time series are linear functions of . In these cases, the definition of permutation entropy per symbol, , is a useful parameter. As has a rapid convergence in terms of , one may use a finite instead of ; we have used . This makes the method to be very fast. The dynamics of the parameter may represent the dynamics of complexity of financial time series over time. It could also be used as a measure to compare complexities of financial time series. The complexity of a financial time series may be compared with that of a completely random series. We believe that in recent years, investigations of micro patterns and searching for dominant patterns by participants in the markets, have faded those patterns. As an application, this method is used for three exchange rates. It is seen that the variety of micro patterns have evolved between 2006 and 2012; and the scale over which the target markets have no dominant patterns, have decreased steadily over time with the emergence of higher frequency trading. Although there are still many attempts for finding dominant patterns in micro scales by traders, it seems that searching for dominant patterns is useless for liquid markets.
Acknowledgement
We would like to thank M. Khorrami, M. R. Rahimi Tabar and F. Ashtiani for fruitful discussions. We also thank A. Shariati for careful reading of the manuscript.
References
- [1] A. N. Kolmogorov; Problems of Information Transmission, 1, 4, (1965).
- [2] G. J. Chaitin; Journal of the ACM (JACM), 13, 547-569, (1966).
- [3] C. E. Shannon; Bell system technical journal 28.4, 656-715, (1949). C. E. Shannon & W. Weaver; University of Illinois Press 19.7, 1, (1949).
- [4] J. Voit; The Statistical Mechanics of Financial Markets, Springer (2005).
- [5] A. Golan; Information and Entropy Econometrics - A Review and Synthesis, Foundation and Trends® in Econometrics, 2, no. 1-2, pp. 1-145, (2006).
- [6] D. Helbing; Quantitative Sociodynamics, Stochastic Methods and Models of Social Interaction Processes, Springer (2010).
- [7] A. Renyi; On measures of entropy and information, Proceedings of the 4th Berkeley Symposium on Mathematics, Statistics and Probability pp. 547-561 (1960).
- [8] R. L. Adler, A. G. Konheim, & M. H. McAndrew, Topological Entropy, Transactions of the American Mathematical Society, 114, No. 2, pp. 309-319 (1965).
- [9] C. Tsallis; Journal of Statistical Physics, 52 479-487, (1988).
- [10] J. Milnor; Complex Systems, 2, 357-385, (1988).
- [11] José Amigó; Permutation Complexity in Dynamical Systems, Springer (2010).
- [12] E. C. Posner, E. R. Rodemich, & H. Rumsey; The Annals Mathematical Statistics 38, 1000-1020, (1967).
- [13] C. Bandt, B. Pomp; Physical Review Letters 88, 174102, (2002).
- [14] C. Bandt, G. Keller, & B. Pompe; Nonlinearity 15, 1595, (2002).
- [15] Y. Cao, W. Tung, J. B. Gao, V. A. Protopopescu, & L. M. Hively; Physical Review E70, 046217, (2004).
- [16] X. Li, G. Ouyangb, D. A. Richardsc; Epilepsy Research 77, 70-74 (2007).
- [17] A. Bahraminasab, F. Ghasemi, A. Stefanovska, P. V. E. McClintock, & H. Kantz; Physical Review Letters, 100, 084101, (2008).
- [18] E. F. Fama, L. Fisher, M. Jensen and R. Roll; International Economic Review, 10(1), (1969).
- [19] E. F. Fama; Journal of Finance, 46(5), (1991).
- [20] M. C. Jensen; Journal of Financial Economics, 6(2/3), (1978).
- [21] M. Beechey, D. W. R Gruen, J. Vickery; The efficient market hypothesis: a survey, Reserve Bank of Australia, Economic Research Department (2000).
- [22] P. A. Samuelson; Industrial management review, 6, no. 2 (1965).
- [23] S. A. Ross; Neoclassical finance, Princeton University Press, (2009).
- [24] J. P. Bouchaud, J. D Farmer, F. Lillo; Handbook of Financial Markets: Dynamics and Evolution, Amsterdam: Elsevier (2009).
- [25] T. M. Cover, J. A. Thomas; Elements of Information Theory, John Wiley & Sons (2006).
- [26] R. N. Mantegna, H. E. Stanley; An Introduction inEconophysics, Cambridge University Press (2004).
- [27] I. Aldridge; High-frequency trading: a practical guide to algorithmic strategies and trading systems, John Wiley & Sons (2013).
- [28] J. P. Bouchaud and M. Potters; Theory of financial risks: from statistical physics to risk management 12, Cambridge University Press, (2000), and references therein.
- [29] J. L. McCauley; Dynamics of markets: econophysics and finance 31, Cambridge University Press, (2004), and references therein.
- [30] A. H. Shirazi, C. Aghamohammadi, M. Anvari, A. Bahraminasab, M. R. R. Tabar, J. Peinke, M. Sahimi, & M. Marsili; Journal of Statistical Mechanics: Theory and Experiment, P02042 (2013).
- [31] G. R. Jafari, M. Sadegh Movahed, P. Norouzzadeh, A. Bahraminasab, M. Sahimi, F. Ghasemi, & M. R. R. Tabar; International Journal of Modern Physics C18, no. 11, 1689-1697, (2007).
- [32] F. Farahpour, Z. Eskandari, A. Bahraminasab, G. R. Jafari, F. Ghasemi, M. Sahimi, & M. R. R. Tabar; Physica A: Statistical Mechanics and its Applications, 385, 2, 601-608, (2007).