11email: lyuda@usm.lmu.de 22institutetext: Institute of Astronomy, Russian Academy of Sciences, RU-119017 Moscow, Russia
22email: lima@inasan.ru 33institutetext: Zentrum für Astronomie der Universität Heidelberg, Landessternwarte, Königstuhl 12, D-69117 Heidelberg, Germany
33email: N.Christlieb@lsw.uni-heidelberg.de 44institutetext: Department of Astronomy and Space Physics, Uppsala University, Box 515, 75120 Uppsala, Sweden
The Hamburg/ESO R-process Enhanced Star survey (HERES) ††thanks: Based on observations collected at the European Southern Observatory, Paranal, Chile (Proposal numbers 170.D-0010, and 280.D-5011). ††thanks: Table 3 is only available in electronic form at the CDS via anonymous ftp to cdsarc.u-strasbg.fr (130.79.128.5) or via http://cdsweb.u-strasbg.fr/cgi-bin/qcat?J/A+A/
Abstract
Context. Studies of the -process enhanced stars are important for understanding the nature and origin of the -process better.
Aims. We present a detailed abundance analysis of a very metal-poor giant star discovered in the HERES project, HE 2252–4225, which exhibits overabundances of the -process elements with [/Fe] = +0.80.
Methods. We determined the stellar atmosphere parameters, K, log g = 1.65, and [Fe/H] , and chemical abundances by analysing the high-quality VLT/UVES spectra. The surface gravity was calculated from the non-local thermodynamic equilibrium (NLTE) ionisation balance between Fe i and Fe ii.
Results. Accurate abundances for a total of 38 elements, including 22 neutron-capture elements beyond Sr and up to Th, were determined in HE 22524225. For every chemical species, the dispersion in the single line measurements around the mean does not exceed 0.12 dex. This object is deficient in carbon, as expected for a giant star with K. The stellar Na–Zn abundances are well fitted by the yields of a single supernova of 14.4 . For the neutron-capture elements in the Sr–Ru, Ba–Yb, and Os–Ir regions, the abundance pattern of HE 22524225 is in excellent agreement with the average abundance pattern of the strongly -process enhanced stars CS 22892-052, CS 31082-001, HE 1219-0312, and HE 1523-091. This suggests a common origin of the first, second, and third -process peak elements in HE 22524225 in the classical -process. We tested the solar -process pattern based on the most recent -process calculations of Bisterzo, Travaglio, Gallino, Wiescher, and Käppeler and found that elements in the range from Ba to Ir match it very well. No firm conclusion can be drawn about the relationship between the first neutron-capture peak elements, Sr to Ru, in HE 22524225 and the solar -process, owing to the uncertainty in the solar -process. The investigated star has an anomalously high Th/Eu abundance ratio, so that radioactive dating results in a stellar age of Gyr that is not expected for a very metal-poor halo star.
Key Words.:
Stars: abundances – Stars: atmospheres – Stars: fundamental parameters – Nuclear reactions, nucleosynthesis, abundances1 Introduction
HE 22524225 was identified as a candidate metal-poor star in the Hamburg/ESO Survey (HES; see Christlieb et al. 2008, for details of the candidate selection procedures). Moderate-resolution ( Å) spectroscopy obtained at the Siding Spring Observatory (SSO) 2.3 m-telescope with the Double Beam Spectrograph (DBS) confirmed its metal-poor nature. Therefore, it was included in the target list of the Hamburg/ESO R-process-Enhanced Star survey (HERES). A detailed description of the project and its aims can be found in Christlieb et al. (2004, hereafter Paper I), and the methods of automated abundance analysis of high-resolution “snapshot” spectra are described in Barklem et al. (2005, hereafter Paper II). “Snapshot” spectra with a spectral resolution and a signal-to-noise ratio of per pixel at 4100 Å were used to show that HE 22524225 is a very metal-poor (VMP) star, with the iron abundance [Fe/H]111In the classical notation, where [X/Y] = . , and it exhibits overabundances of the heavy elements produced via rapid neutron captures (-process), with [Eu/Fe] = and (Paper II).
The astrophysical site(s) of the -process is still unclear. Studies of the strongly -process enhanced and VMP stars can provide an empirical information about the origin of the heavy elements beyond the iron group in the early Galaxy. Christlieb et al. (2004) suggest referring to metal-poor stars having [Eu/Fe] = +0.3 to +1.0 and as r-I stars. Stars with similar [Ba/Eu] abundance ratio, but higher , belong to the group of r-II stars. Among a dozen discovered r-II stars, the six stars, CS 22892-052 (Sneden et al. 1994), CS 31082-001 (Cayrel et al. 2001), CS 29497-004 (Paper I), HE 1219-0312 (Paper II), HE 1523-091 (Frebel et al. 2007), and SDSS J2357-0052 (Aoki et al. 2010), are extremely enhanced in the -process elements, with [Eu/Fe] . Their heavy-element abundances are expected to be dominated by the influence of a single event, or at most very few -process nucleosynthesis events.
It was established that r-II and r-I stars have a very similar heavy-element abundance pattern in the Ba–Hf region that, in turn, is consistent with a scaled solar system (SS) -process abundance distribution (see for example Sneden et al. 2008, Cowan et al. 2002, Ivans et al. 2006, Sitnova & Mashonkina 2011, Siqueira-Mello et al. 2014). This suggests a universal production ratio of the second -process peak elements during the Galaxy history. A different case is the light trans-iron elements. Observations of MP halo stars appear to infer a distinct production mechanism for Sr–Zr and heavy elements beyond Ba in the early Galaxy (Aoki et al. 2005, François et al. 2007, Mashonkina et al. 2007b). Mashonkina et al. (2010) found a clear distinction in Sr/Eu abundance ratios between the r-II and r-I stars, namely, the r-II stars contain a low Sr/Eu abundance ratio at [Sr/Eu] = , while the r-I stars have 0.36 dex higher Sr/Eu values.
In this paper, we investigate whether the heavy-element abundance pattern of HE 22524225 matches that of the extremely neutron-capture-rich r-II stars. What is the behaviour of the first -process peak elements from Sr to Pd in HE 22524225? Can a nucleo-chronometric age of HE 22524225 be estimated from measurement of the radioactive element thorium? How can an abundance analysis of HE 22524225 improve our knowledge of the -process? To answer these questions, we continue our series of papers on the HERES project and aim to revise stellar parameters and to perform detailed abundance analysis of HE 22524225, based on the high-quality VLT/UVES spectra and refined theoretical methods of line-formation modelling.
This paper is structured as follows. After presenting the observations in Sect. 2, we describe our determination of stellar parameters and abundance analysis of HE 22524225 in Sects. 3 and 4. Section 5 analyses the heavy element abundance pattern of the investigated star. An anomalously high Th abundance of HE 22524225 is discussed in Sect. 6. Our conclusions are presented in Sect. 7.
2 Observations
For the convenience of the reader, we list the coordinates and photometry of HE 22524225 in Table 1. The photometry was taken from Beers et al. (2007). High-quality spectra of this star was acquired during May–September 2005 with the VLT and UVES in dichroic mode. The BLUE390RED580 (9 h total integration time), and BLUE437RED860 (10 h) standard settings were employed to ensure a wide wavelength coverage. The slit width of in both arms yielded a resolving power of . A pixel binning ensured proper sampling of the spectra. The observations are summarised in Table 2.
The pipeline-reduced spectra were shifted to the stellar rest frame and then co-added in an iterative procedure in which we identified pixels in the individual spectra affected by cosmic ray hits that had not been fully removed during the data reduction, or those affected by CCD defects or other artefacts. These pixels were flagged and ignored in the final iteration of the co-addition. Both sets of co-added blue spectra have of at least 50 per pixel at Å. At the shortest wavelengths, the of the BLUE390 and BLUE437 is (at 3400 Å) and 70 (at 3756 Å), respectively. The red arm spectra have per pixel in most of the covered spectral range.
| R.A.(2000.0) | 22:54:58.6 |
|---|---|
| dec.(2000.0) | 42:09:19 |
| Setting | |||
|---|---|---|---|
| BLUE390 | – Å | h | – |
| BLUE437 | – Å | h | – |
| REDL580 | – Å | h | – |
| REDU580 | – Å | h | – |
| REDL860 | – Å | h | – |
| Notes. 1 refers to rest frame wavelengths, | |||
| 2 refers to the signal-to-noise ratio per pixel. | |||
3 Stellar atmosphere parameters
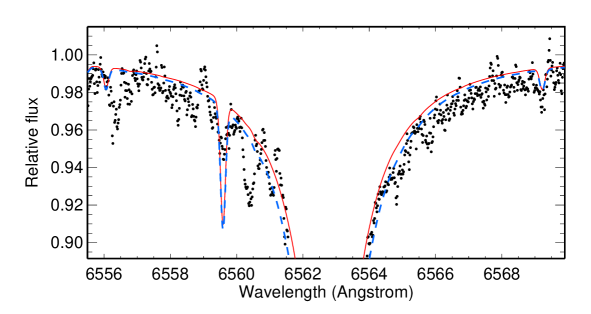
In Paper II, an effective temperature of K was determined from photometry when adopting the reddening derived from the maps of Schlegel et al. (1998). A subsequent analysis of the snapshot spectrum inferred that HE 22524225 is a VMP giant with the surface gravity , [Fe/H] = and the microturbulence velocity km s-1. These parameters appear to be close to those of HD 122563, which is one of the best observed halo stars, with well-determined and log g. Recent measurements of the angular diameter of HD 122563 resulted in = 460041 K (Creevey et al. 2012). Employing the same , Mashonkina et al. (2011) calculated log g = 1.600.07 from the HIPPARCOS parallax and [Fe/H] = from the NLTE analysis of the Fe lines. We found that HE 22524225 and HD 122563 have very similar line profiles for H and H (Fig. 1, top panel displays only H). This confirms that HE 22524225 is indeed cool, and its effective temperature may be only slightly higher than that of HD 122563. The high-quality spectrum of HD 122563 ( and S/N ) was taken from the ESO UVESPOP survey (Bagnulo et al. 2003).
In this study, we check K through a profile analysis of H and H and revise the surface gravity, iron abundance, and microturbulence velocity using lines of Fe i and Fe ii. H was not used due to heavy blending of the line wings. Our calculations are based on non-local thermodynamic equilibrium (NLTE) line formation for H i and Fe i-ii, employing the methods described by Mashonkina et al. (2008) and Mashonkina et al. (2011), respectively. The coupled radiative transfer and statistical equilibrium (SE) equations were solved with a revised version of the DETAIL code (Butler & Giddings 1985). The update was presented by Mashonkina et al. (2011). The obtained departure coefficients were then used by the code SIU (Reetz 1991) to calculate the synthetic line profiles.
When determining the stellar parameters of HE 22524225, we used the MARCS model structures (Gustafsson et al. 2008)222http://marcs.astro.uu.se, which were interpolated for given , log g, and [Fe/H] using a FORTRAN-based routine written by Thomas Masseron333http://marcs.astro.uu.se/software.php.
3.1 Effective temperature
The Balmer lines were computed for a small grid of model atmospheres with common K, but varying gravity, with log g = 1.2, 1.53, 1.65, and 1.75, and metallicity, with [M/H] = , , , and . The theoretical profiles were obtained by convolving the profiles resulting from the thermal, natural, and Stark broadening (Vidal et al. 1973), as well as self-broadening (Barklem et al. 2000). In the SE calculations, inelastic collisions with hydrogen atoms were accounted for using the classical Drawin rates (Drawin 1968, 1969) scaled by a factor of = 2, as recommended by Mashonkina et al. (2008). It was found that a variation in log g and [M/H] within 0.24 dex and 0.12 dex, respectively, produces minor effect on the H and H profiles, such that the difference in derived does not exceed 30 K. Figure 1 displays observed profiles of the two Balmer lines in HE 22524225 compared with the theoretical NLTE and LTE (only for H) ones calculated for and . The departures from LTE are weak for the H profile beyond the core, such that the difference between derived for this line, assuming either NLTE or LTE, does not exceed 30 K. For both lines, the observed wings are satisfactorily reproduced by the model atmosphere with K, and this value was adopted as a final effective temperature of HE 22524225.


3.2 Surface gravity, iron abundance, and microturbulence velocity
The lines employed to determine log g, [Fe/H], and were mainly selected from the linelist produced in our previous HERES paper (Mashonkina et al. 2010, hereafter, Paper V). They are listed in Table LABEL:linelist (online material), along with transition information, references for the adopted -values, and the final element abundances. The LTE and NLTE abundances were calculated for the four model atmospheres, with common K and [M/H] = , but various log g = 1.20, 1.53, 1.65, and 1.75 and = 1.7, 1.9, and 2.1 km s-1. In the atmospheres of MP stars, the main source of uncertainties in NLTE results is poorly known inelastic collisions with H i atoms. Therefore, the two sets of NLTE abundances corresponding to = 0.1 and = 1 were computed for each model. Figure 2 displays the NLTE( = 0.1) abundances from individual lines of Fe i and Fe ii in the model /log g/[M/H]/ = 4710/1.65/-2.66/1.7.
We found that the low-excitation lines ( 1.2 eV) of Fe i give systematically higher abundances compared with the mean from the remaining lines, independent of either LTE or NLTE and independent of the used and log g. For example, in the model 4710/1.65/-2.66/1.7, the abundance difference between the 1.2 eV and 1.2 eV lines of Fe i amounts to 0.19 dex in NLTE( = 0.1) and 0.21 dex in LTE. This can be caused by ignoring hydrodynamic phenomena (3D effects) in the atmosphere of HE 22524225. Collet et al. (2007), Hayek et al. (2011), and Dobrovolskas et al. (2013) predicted that the (3D-1D) abundance corrections are negative for lines of Fe i in the [M/H] and models of VMP cool giants and the magnitude of the correction depends strongly on excitation energy of the lower level. For example, in the 4858/2.2/ model, (3D-1D) = dex and dex for the = 0 and 4 eV lines, respectively (Hayek et al. 2011). We do not see such a large discrepancy between the low- and high-excitation lines of Fe i in HE 22524225. Nevertheless, we excluded lines with 1.2 eV, when calculating the mean abundance and analysing the abundance trend with the line strength for Fe i.
It was found that a variation of 0.2 km s-1 in led to a similar change of 0.03 dex in the derived mean abundances from Fe i and Fe ii lines, therefore, the gravity determination did not depend on the adopted value of . However, including the results for km s-1 produced a steep trend with observed equivalent widths, , for the abundances found from individual Fe i and Fe ii lines, independent of the adopted values of log g. The least slope of the - plot was obtained with km s-1.
Consistent iron abundances for the two ionisation stages were obtained with log g = 1.2 in LTE, log g = 1.35 in NLTE with = 1, and log g = 1.65 in NLTE with = 0.1. The discrepancy in LTE gravity between this study and Paper II can be explained by using different sources of -values for Fe ii lines and a different list of the Fe lines in the two studies. The present results are based on recent -values of Meléndez & Barbuy (2009). When choosing between = 1 and 0.1, we relied on an analysis of iron lines in HD 122563, where applying = 0.1 led to consistent NLTE abundances for Fe i and Fe ii for the gravity calculated from the HIPPARCOS parallax (Mashonkina et al. 2011). Thus, log g = 1.65 was adopted as a final surface gravity of HE 22524225. The uncertainty in log g was estimated as 0.15 dex based on the statistical errors of the mean abundances for Fe i, = 4.790.09, and Fe ii, = 4.790.07. We refer to abundances on the usual scale, where . Hereafter, the statistical error is the dispersion in the single line measurements around the mean: .
We did not use the ionisation equilibrium between Ca i and Ca ii to constrain the gravity because the observed Ca ii 3933 Å and 8498 Å lines are very strong, with = 5 848 mÅ and 509 mÅ, respectively, and they cannot be accurately measured due to the uncertainty in continuum normalisation. Furthermore, Ca ii 8498 Å is insensitive to surface gravity variation. The difference in abundance from Ca ii 8498 Å amounts to dex between log g = 1.20 and 1.53, and it is smaller than 0.01 dex between log g = 1.53, 1.65, and 1.75.
| Parameter | Value | Uncertainty |
|---|---|---|
| 4710 K | K | |
| 1.65 | ||
| 1.7 km s-1 | km s-1 |
The obtained parameters K, log g = 1.65, [Fe/H] = , and = 1.7 km s-1 were employed to compute the final model atmosphere with the code MARCS. Enhancements of the -elements O, Mg, Si, and Ca were adopted to be typical of galactic halo stars, with [/Fe] = 0.4. We found that moving from the interpolated to an explicitly tailored model atmosphere does not require any revision in derived surface gravity and microturbulence velocity, and the mean NLTE abundances from lines of Fe i and Fe ii increase by a similar and small amount of 0.03 dex. With the new model atmosphere, they equal = 4.820.08 and = 4.820.07. We also checked lines of CH, Ca i, and Ba ii. For the atomic lines, the difference nowhere exceeds 0.03 dex. However, the use of the interpolated model leads to a 0.08 dex lower C abundance from the CH molecular lines. The adopted stellar parameters of HE 22524225 are given in Table 4. The investigated star is, most probably, a distant object, with a spectroscopic distance of 12.6 kpc, as estimated assuming a stellar mass of 0.8 solar mass.
4 Abundance analysis
Our determinations of the elemental abundances are based on line-profile and equivalent-width analyses, using the codes SIU (Reetz 1991) and WIDTH9444http://kurucz.harvard.edu/programs/WIDTH/ (Kurucz 2005), respectively. The SIU and WIDTH9 codes both treat continuum scattering correctly; i.e., scattering is taken into account not only in the absorption coefficient, but also in the source function.
The lines used in the abundance analysis are listed in Table LABEL:linelist (online material), along with the transition information and references to the adopted -values. They were mostly selected from the list produced in Paper V. The data from Paper V were replaced with -values from recent laboratory measurements for Ti i (Lawler et al. 2013), Ti ii (Wood et al. 2013), Mn i (Den Hartog et al. 2011), and Zn i (Roederer & Lawler 2012), where available. Hyper-fine splitting (HFS) and/or isotopic splitting (IS) structure were accounted for properly for the lines of chemical elements that are represented by either a single isotope with an odd number of nucleons or multiple isotopes. Table LABEL:linelist (online material) provides notes that indicate whether HFS/IS was considered in a given feature, and references to the HFS/IS data used. For Mn i levels, we used magnetic dipole constants from Table 1 in Lefèbvre et al. (2003). The method of calculations and adopted isotope abundances were described in detail in Paper V. We ignored any lines with equivalent widths larger than 100 mÅ. Exceptions were the elements, such as strontium, for which only strong lines can be detected in HE 22524225.
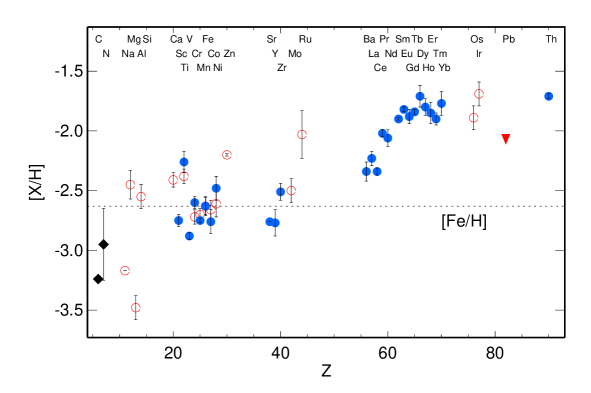
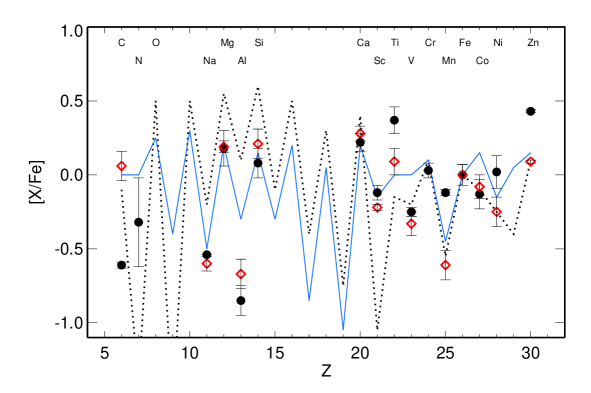
Owing to the high-quality and broad wavelength coverage of the spectra used in this study, we derived the abundance of 38 elements from C to Th in HE 22524225 and, for 22 elements of them, in the nuclear charge range between and 90. The oxygen, copper, and hafnium abundances could not be determined from the available observed spectrum. We were unsuccessful in obtaining abundances for Rh and Pd, because the strongest lines of these elements, Rh i 3434 Å and Pd i 3404 Å, could not be extracted from the noise in the observed spectrum of HE 22524225. The element abundances obtained from individual lines are listed in Table LABEL:linelist (online material). For each feature, we provide the LTE abundance and, for selected species, also the NLTE abundance. Table 5 presents the mean abundances, the number of used lines, , and , where . We also list the solar photosphere abundances, , adopted from Lodders et al. (2009), and the abundances relative to iron, [X/Fe]. For computing [X/Fe], [Fe/H] was chosen as the reference, with the exception of the neutral species calculated based on a LTE assumption, where the reference is [Fe I/H]. Figure 3 displays the element abundance pattern of HE 22524225.
| Species | ||||||
| 3 | Li I | 1.10 | 1 | – | ||
| 6 | CH | 8.39 | 4 | 5.15 | 0.02 | –0.61 |
| 7 | NH | 7.86 | 1 | 4.91 | –0.32 | |
| 11 | Na I | 6.30 | 2 | 3.13N | 0.00 | –0.54 |
| 12 | Mg I | 7.54 | 3 | 5.09N | 0.12 | 0.18 |
| 13 | Al I | 6.47 | 1 | 2.99N | –0.85 | |
| 14 | Si I | 7.52 | 1 | 4.97N | 0.08 | |
| 20 | Ca I | 6.33 | 10 | 3.92N | 0.06 | 0.22 |
| 21 | Sc II | 3.07 | 4 | 0.32 | 0.05 | –0.12 |
| 22 | Ti I | 4.90 | 10 | 2.26 | 0.06 | 0.25 |
| 22 | Ti II | 4.90 | 16 | 2.64 | 0.09 | 0.37 |
| 23 | V II | 4.00 | 3 | 1.12 | 0.03 | –0.25 |
| 24 | Cr I | 5.64 | 5 | 2.66 | 0.06 | –0.09 |
| 24 | Cr II | 5.65 | 4 | 3.05 | 0.05 | 0.03 |
| 25 | Mn I | 5.37 | 3 | 2.41 | 0.05 | –0.07 |
| 25 | Mn II | 5.37 | 3 | 2.62 | 0.02 | –0.12 |
| 26 | Fe I | 7.45 | 43 | 4.82N | 0.08 | 0.00 |
| 26 | Fe II | 7.45 | 12 | 4.82N | 0.07 | 0.00 |
| 27 | Co I | 4.92 | 3 | 2.00 | 0.08 | –0.03 |
| 27 | Co II | 4.92 | 1 | 2.16 | –0.13 | |
| 28 | Ni I | 6.23 | 6 | 3.36 | 0.11 | 0.02 |
| 28 | Ni II | 6.23 | 1 | 3.75 | 0.15 | |
| 30 | Zn I | 4.62 | 2 | 2.42T | 0.01 | 0.43 |
| 38 | Sr II | 2.92 | 2 | 0.16 | 0.00 | –0.13 |
| 38 | Sr II | 2.92 | 2 | 0.20N | 0.05 | –0.09 |
| 39 | Y II | 2.21 | 9 | 0.11 | –0.14 | |
| 40 | Zr II | 2.58 | 12 | 0.07 | 0.07 | 0.12 |
| 42 | Mo I | 1.92 | 1 | 0.13 | ||
| 44 | Ru I | 1.84 | 1 | 0.60 | ||
| 56 | Ba II | 2.17 | 3 | 0.08 | 0.29 | |
| 56 | Ba II | 2.17 | 3 | 0.04 | 0.14 | |
| 57 | La II | 1.14 | 8 | 0.06 | 0.40 | |
| 58 | Ce II | 1.61 | 10 | 0.03 | 0.29 | |
| 59 | Pr II | 0.76 | 3 | 0.03 | 0.61 | |
| 60 | Nd II | 1.45 | 19 | 0.07 | 0.57 | |
| 62 | Sm II | 1.00 | 5 | 0.01 | 0.73 | |
| 63 | Eu II | 0.52 | 4 | 0.02 | 0.81 | |
| 63 | Eu II | 0.52 | 4 | 0.03 | 0.91 | |
| 64 | Gd II | 1.11 | 4 | 0.06 | 0.75 | |
| 65 | Tb II | 0.28 | 3 | 0.00 | 0.79 | |
| 66 | Dy II | 1.13 | 14 | 0.09 | 0.92 | |
| 67 | Ho II | 0.51 | 4 | 0.07 | 0.83 | |
| 68 | Er II | 0.96 | 8 | 0.09 | 0.78 | |
| 69 | Tm II | 0.14 | 5 | 0.05 | 0.73 | |
| 70 | Yb II | 0.86 | 1 | 0.86 | ||
| 76 | Os I | 1.45 | 1 | 0.74 | ||
| 77 | Ir I | 1.38 | 2 | 0.10 | 0.94 | |
| 82 | Pb I | 2.00 | 1 | 0.30 | ||
| 82 | Pb I | 2.00 | 1 | 0.30 | ||
| 90 | Th II | 0.08 | 2 | 0.02 | 0.92 | |
| 90 | Th II | 0.08 | 2 | 0.01 | 1.00 | |
| Notes. (N) NLTE abundance; | ||||||
| (T) NLTE correction from Takeda et al. (2005). | ||||||
4.1 NLTE effects
NLTE abundances were derived for a number of chemical species, using the NLTE methods from Alexeeva et al. (2014, Na i), Mashonkina (2013, Mg i), Baumueller & Gehren (1996, Al i), Shi et al. (2008, Si i), Mashonkina et al. (2007a, Ca i), Belyakova & Mashonkina (1997, Sr ii), Mashonkina et al. (1999, Ba ii), Mashonkina & Gehren (2000, Eu ii, updated), and Mashonkina et al. (2012, Pb i, Th ii). Quantum-mechanical rate coefficients from Barklem et al. (2010) and Barklem et al. (2012) were applied for Na+H and Mg+H collisions, respectively. For the remaining NLTE species, collisions with H i atoms were computed with the Drawinian rates (Drawin 1968, 1969) scaled by a factor of = 0.1. An exception is Sr ii and Ba ii, for which = 0.01 was adopted, as recommended by Mashonkina & Gehren (2001).
We calculated that the NLTE abundances derived from the Na i 5890 and 5896 Å lines are dex lower than the corresponding LTE values. In contrast, the NLTE abundance correction, , is positive for lines of Mg i, Al i, and Ca i. For Ca i, dex, on average. The departures from LTE are small for Mg i 4703 and 5528 Å, with = 0.03 and 0.01 dex, respectively. A small negative correction of dex was calculated for Si i 3905 Å.
Evidence of notable departures from LTE was obtained for Ti i, Cr i, Mn i, Co i, and Ni i. Each of the corresponding elements is observed in HE 22524225 for two ionisation stages, and the LTE abundance derived from lines of the neutrals is lower than that for the first ions with the following differences:
(Ti i - Ti ii) = dex,
(Cr i - Cr ii) = dex,
(Mn i - Mn ii) = dex,
(Co i - Co ii) = dex,
(Ni i - Ni ii) = dex.
This can be understood as follows. Similar to Fe i, the listed neutrals are the minority species in the atmosphere of HE 22524225, and they are expected to be subject to ultra-violet overionisation resulting in weakened spectral lines compared with their LTE strengths, while the departures from LTE should be minor for the first ions, which are the majority species. For titanium, the difference in LTE abundances is largely removed, when applying the NLTE abundance corrections of 0.31 dex and 0.01 dex for Ti i and Ti ii, respectively, as computed by Bergemann (2011) for the stellar parameters, K, log g = 1.6, and [Fe/H] = , close to those of HE 22524225. We note that the calculated NLTE effects for Ti i-ii and Fe i-ii are similar. In this study, we obtained = 0.26 dex for Fe i and 0.00 for Fe ii. However, significantly larger NLTE corrections of 0.44 dex and 0.64 dex were computed for Mn i (Bergemann & Gehren 2008) and Co i (Bergemann et al. 2010), respectively, using the same model, 4600/1.6/. Applying these corrections would lead to NLTE abundances that are too high for lines of neutral Mn and Co in HE 22524225 compared with those for their first ions. Here, we took into consideration that dex for Co ii (Bergemann et al. 2010) and assumed that dex for Mn ii. For Cr i-ii, the NLTE calculations were performed for the MP dwarf stars (Bergemann & Cescutti 2010), but not giants. In the [Fe/H] stars, is of up to 0.35 dex for Cr i and 0.08 dex for Cr ii. Larger positive corrections are required for the Cr i lines to remove abundance discrepancy between Cr i and Cr ii in HE 22524225.
For Zn i 4810 Å in HE 22524225, the NLTE correction is expected to be small with dex (Takeda et al. 2005). We assume that the departures from LTE for the second zinc line, Zn i 4722 Å, are as small, as is the case for Zn i 4810 Å. The NLTE effects for the heavy elements beyond the Fe group are discussed in Sect. 4.3.
In this study, we did not consider the influence of the 3D effects on the derived element abundances, although we took care to minimise such an influence, where possible, for example by removing low-excitation lines of Fe i and Mn i. Using the 3D hydrodynamic model atmosphere of VMP cool giant 5020/2.5/, Dobrovolskas et al. (2013) predicted that the (3D-1D) abundance corrections are negative and large in absolute value of up to to dex for the lines arising from the ground state of the minority species, such as Mg i, Ti i, and Ni i, but they decrease rapidly towards higher excitation energy of the lower level and do not exceed dex, when = 2 eV. We did not determine such a large discrepancy between the and eV lines for Mg i and Ni i (Table LABEL:linelist, online material). In contrast to the predictions, the measured difference in 1D-LTE abundances (Ti i - Ti ii) is negative, but not positive, and it is fully removed, when applying the 1D-NLTE abundance corrections. These results may cast a shadow of doubt on 3D calculations. However, our interpretation is that one cannot simply add 1D-NLTE and 3D-LTE results when both NLTE and 3D effects are significant. This is exactly the case in HE 22524225.
The heavy elements beyond the Fe group are mostly observed in HE 22524225 for their majority species, such as Ba ii and Eu ii, and in the low-excitation lines. Dobrovolskas et al. (2013) predicted that the (3D-1D) corrections for the = 0 lines of Ba ii and Eu ii are small and very similar in magnitude, dex and dex, respectively.
We comment below on abundances of individual groups of elements. The sample of cool giants from Cayrel et al. (2004, hereafter, Cayrel2004) was chosen as our comparison sample.
4.2 Lithium to zinc
Lithium. As expected for a red giant, HE 22524225 has a very low abundance of Li. The central depth of the Li i 6708 Å line is about 1 % in the observed spectrum, and only an upper limit of was estimated.
Carbon and nitrogen. The C abundances obtained from CH lines in the regions 4310–4314 Å and 4362–4367 Å are consistent with each other to within 0.03 dex (see Table LABEL:linelist, online material). The mean abundance is , which is similar to those of the giants with K from the sample of Cayrel2004. Such a low [C/Fe] ratio in the cool giants is likely due to mixing, which has brought processed material to the surface from deep layers, where C is converted into N. This explains a factor of 2 higher N/C ratio in HE 22524225 compared with the solar value. The abundance of nitrogen could only be determined from the NH line at 3416.64 Å. We checked the spectral region around 3416.64 Å in the solar spectrum (Kurucz et al. 1984) and fitted it with -value of the NH line that had been reduced by dex compared with what was calculated by Kurucz (1993). With this correction, we derived the relative abundance [N/Fe] . It is worth noting that several papers applied “solar oscillator strengths” of the NH molecular lines, where Kurucz (1993) -values were reduced by a factor of 0.807 dex (Hill et al. 2002), 0.4 dex (Aoki et al. 2006, Hayek et al. 2009, Mashonkina et al. 2010), and 0.3 dex (Shavrina et al. 1996, Johnson et al. 2007).
The -process elements Mg, Si, Ca, and Ti are enhanced relative to iron: , , , and (from Ti ii lines). This is in line with the behaviour of other metal-poor halo stars, although the [Mg/Fe] and [Ca/Fe] abundance ratios of HE 22524225 are significantly lower than [Mg/Fe] = 0.61 and [Ca/Fe] = 0.50 obtained by Andrievsky et al. (2010) and Spite et al. (2012) for the Cayrel2004 stellar sample when taking departures from LTE for Mg i and Ca i into account. The reason, most probably, is the use of different methods for determining surface gravity and iron abundance in Cayrel et al. (2004) and this paper. This is illustrated well by the results for HD 122563, which was included in the Cayrel2004 sample and which was also investigated in our earlier papers (Mashonkina et al. 2008, 2011) applying the same methods as in this study. The absolute NLTE abundances of HD 122563 for magnesium, = 5.36, and calcium, = 4.04, as determined by Mashonkina et al. (2008), are similar to = 5.39 from Andrievsky et al. (2010) and = 3.97 from Spite et al. (2012). However, very different iron abundances of HD 122563 were determined in different studies. With K, Cayrel et al. (2004) derived log g = 1.1 and [Fe/H] = from LTE analysis of Fe i and Fe ii lines, while Mashonkina et al. (2008) calculated log g = 1.50 from the HIPPARCOS parallax of HD 122563 and [Fe/H] = from LTE analysis of Fe ii lines. Mashonkina et al. (2011) have shown that NLTE leads to consistent iron abundances for the two ionisation stages, with [Fe/H] = , when employing log g = 1.60 based on the updated HIPPARCOS parallax of HD 122563. It is worth noting that all three VMP giants with NLTE based gravity, metallicity, and element abundances available, i.e. HD 122563 (Mashonkina et al. 2008), HE 23275642 (Mashonkina et al. 2010), and HE 22524225 (this study) reveal moderate -enhancement with [Mg/Fe] = 0.18 to 0.31 and [Ca/Fe] = 0.21 to 0.28.
Sodium and aluminium. HE 22524225 displays an underabundance of the odd elements Na and Al relative to iron of and , and also relative to the even element Mg of and . This is not exceptional for a metal-poor halo star. From a NLTE analysis of the dwarf and giant stars in the range , Andrievsky et al. (2010) determined the mean values and . The reason for the lower [Al/Mg] ratio of HE 22524225 compared with that of the VMP stellar sample is, probably, the smaller positive NLTE correction computed in this study for the Al i line. For example, Fig. 2 from Andrievsky et al. (2008) displays (Al i 3961 Å) = 0.45 dex for K, log g = 1.65, and [Fe/H] = , while we compute (Al i 3961 Å) = 0.14 dex for the 4710/1.65/ model.
We could not make the source(s) of the discrepancy clear. Andrievsky et al. (2008) employed a modified version of the code MULTI (Carlsson 1986). We would not like to cast any shadow of doubt on the modification made by Korotin et al. (1999). Extensive tests of Bergemann et al. (2012) for Fe i-Fe ii demonstrate very similar behaviour of departure coefficients computed with the codes MULTI (Carlsson 1986) and DETAIL (Butler & Giddings 1985), when using common input data. Bergemann et al. (2012) noted: “Perhaps, the only systematic effect is that MULTI predicts slightly stronger NLTE effects than DETAIL mainly due to the differences in the background opacity.” We performed test calculations for Al i with the code DETAIL by excluding the two sources from the background opacity, namely the lines of calcium and iron and quasi-molecular hydrogen absorption as described by Doyle (1968), and found larger departures from LTE compared with that for the standard opacity package (Fig. LABEL:fig:bf_al1) and larger NLTE correction of = 0.33 dex for Al i 3961 Å.
Scandium to nickel and zinc. Abundances of the elements in the nuclear charge range between and 28 were reliably determined from lines of either two ionisation stages or the majority species of a given element. As in Paper V, we did not use the Mn i resonance lines to calculate the mean presented in Table 5. In HE 22524225, the abundance difference between Mn i 4033 Å and the three Mn i subordinate lines amounts to dex. It is worth noting that for each element X observed in HE 22524225 for two ionisation stages, the relative LTE abundances [X I/Fe I] and [X II/Fe II] are consistent with each other to within the error bars. We found that HE 22524225 is slightly deficient in the odd elements Sc, V, Mn, and Co relative to iron and solar ratios with very similar [Sc/Fe], [Mn/Fe], and [Co/Fe] abundance ratios of , , and , respectively, and [V/Fe] = . The abundance of Cr and, most probably, Ni follows the iron one. From the only line of Ni ii at 3769.46 Å, we obtained [Ni II/Fe II] = 0.15, using the predicted -value from Kurucz (2003). The six lines of Ni i led to a close-to-solar ratio of [Ni I/Fe I] = 0.02. The investigated star is overabundant in Zn relative to iron with [Zn/Fe] = 0.43.
Lines of the first ions V ii, Cr ii, and Mn ii were employed by Lai et al. (2008, hereafter, Lai2008) to derive the element abundances of the sample of 28 VMP stars. In the [Fe/H] range, they obtained, on average, close-to-solar ratios for [V II/Fe] and [Cr II/Fe] and a decline in [Mn II/Fe] towards lower metallicity with [Mn II/Fe] at [Fe/H] . Compared with the Lai2008 and Cayrel2004 stellar samples, HE 22524225 reveals similar element-to-iron abundance ratios for Cr, Mn, Ni, and Zn. However, HE 22524225 is slightly deficient in Sc, V, and Co relative to Fe, in contrast to stars of close metallicities in both VMP stellar samples.
We found that the element abundance pattern of HE 22524225 in the Na–Zn range (Fig. 3) resembles that of the VMP giant HE 23275642 (5050/2.34/), which was investigated in Paper V using the same methods as in this study. The star HE 22524225 has a significantly lower C abundance, presumably because it is a more evolved star compared with HE 23275642. The difference concerns with Ti, Mn, and Zn, which have higher abundances relative to Fe in HE 22524225 compared with HE 23275642.
On the basis of their Na to Zn abundances, HE 22524225 and HE 23275642 do not appear to be exceptional. Lai et al. (2008) fitted the average abundance pattern of their stellar sample to the entire library of single supernova (SN) yields, attempting to define a ”typical” Population III star that has enriched the interstellar medium out of which the VMP stars formed. A fairly good fit was obtained for SN of 14.4 . In Fig. 3, we compare the abundance patterns of HE 22524225 and HE 23275642 with the best fit model from Lai et al. (2008) and also the chemical evolution calculations of Kobayashi et al. (2011). In general, the single SN model fits the observations well. The exceptions are Al, V, and Co, which are overproduced in the model, and Ti, which, in contrast, is underproduced. The observed underabundances of V and Co relative to Fe are reproduced well by the model of Kobayashi et al. (2011).
4.3 Heavy elements: Sr to Th
We measured five light trans-iron elements with , 14 elements in the region of the second -process peak, osmium and iridium, which represent the third peak, and the actinide thorium. For the Pb abundance, we could only estimate an upper limit.

Mashonkina & Christlieb (2014) showed an advantage of applying the NLTE approach when constraining a pure -process Ba/Eu ratio from observations of the strongly -process enhanced VMP stars. In this study, NLTE abundances were determined for five heavy elements: Sr, Ba, Eu, Pb, and Th. They are presented in Tables 5 and LABEL:linelist (online material). The largest departures from LTE were found for Pb i 4057 Å. This can be understood, because Pb i represents a minor fraction of the element abundance, and its number density can easily deviate from the population in thermodynamic equilibrium, because of deviations in the mean intensity of ionising radiation from the Planck function. NLTE leads to overionisation of Pb i resulting in the weakened line and positive of 0.41 dex. Different NLTE mechanisms connected with the radiative bound-bound transitions are in action for Sr ii, Ba ii, Eu ii, and Th ii that represent a major fraction of their element abundances. The Sr ii resonance lines are strong, and they are weakly affected by departures from LTE. The barium abundance of HE 22524225 was determined from the three subordinate lines, Ba ii 5853, 6141, and 6497 Å, which are almost free of HFS effects. Our NLTE calculations for HE 22524225 showed that they are stronger than in the LTE case, resulting in a negative NLTE abundance correction of different magnitude for different lines, dex, dex, and dex, respectively. NLTE largely removes the difference in LTE abundances between different Ba ii lines, and the statistical error reduces to = 0.04 dex. We calculated positive NLTE abundance corrections for the lines of Eu ii and Th ii, finding values close to dex. All the elements from lanthanum to ytterbium are observed in the lines of their majority species, with term structures as complicated as that for Eu ii and Th ii, so the departures from LTE are expected to be similar to those for Eu ii and Th ii. This is largely true also for osmium and iridium detected in the lines of their neutrals, Os i and Ir i, which have relatively high ionisation energies of 8.44 and 8.97 eV, respectively. Fortunately, the abundance ratios among heavy elements except Ba are probably only weakly affected by departures from LTE. Indeed, the differences in mean abundance between Th and Eu are very similar in LTE and NLTE, dex and dex, respectively. For consistency, we used the abundances of the heavy elements beyond strontium as determined based on the LTE assumption.
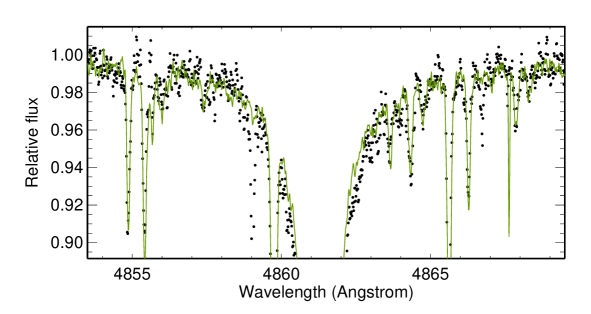
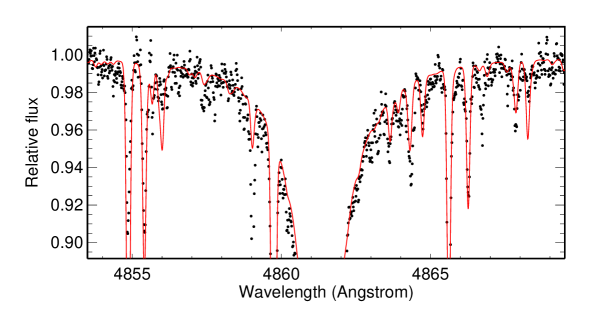
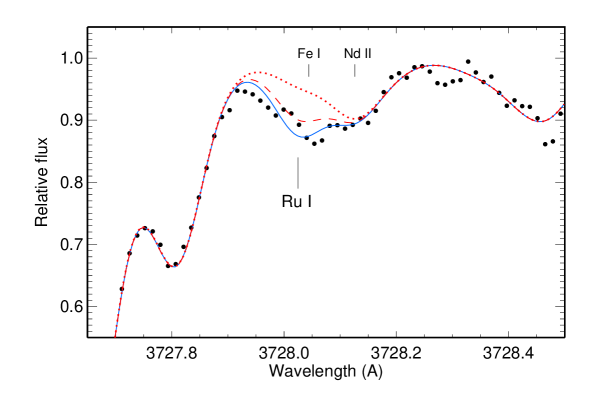
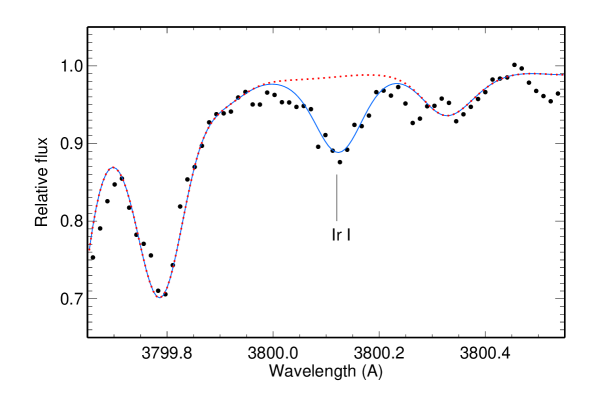
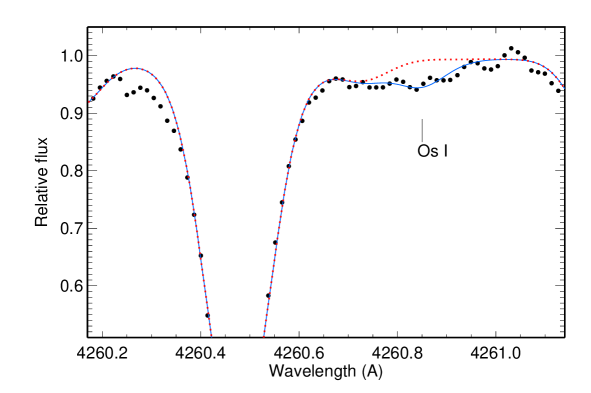
The abundance analysis was based on line profile fitting. Figures 5 and 6 illustrate the quality of the fits for a few selected lines. For most chemical species, 2 to 19 spectral lines were employed, and nowhere does exceed 0.11 dex. For Mo, Ru, Yb, and Os, the abundance was derived from a single line. Mo i 3864 Å, Yb ii 3694 Å, and Os i 4260 Å (Fig. 5, bottom right panel) were found to be free of blends in the spectrum of HE 22524225. Because of the high of the observed spectrum in the relevant wavelength range, the uncertainty in the derived abundances was estimated as 0.1 dex. The observed feature at 3728.0-3728.2 Å (Fig. 5, top left panel) is attributed to a combination of the Ru i 3728.025 Å, Fe i 3728.044 Å, Nd ii 3728.126 Å, and two lines of Ce ii at 3728.019 and 3728.180 Å. For the blending lines, atomic data were taken from the VALD database (Kupka et al. 1999, hereafter, VALD). Ignoring the Ce ii lines completely leads to a dex higher ruthenium abundance. The uncertainty in Ru abundance grows, when considering a possible variation in the Nd and Fe abundances. We carefully estimate dex for the Ru abundance obtained.
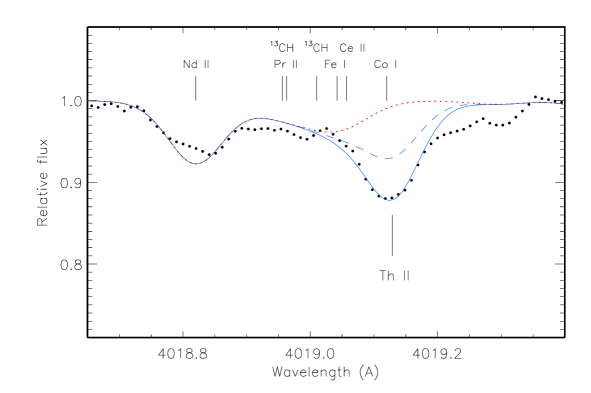
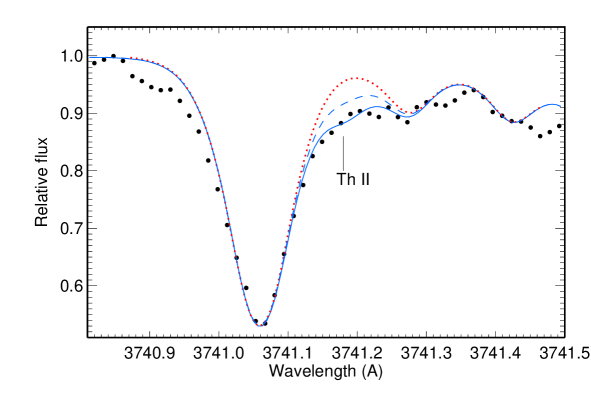
The radioactive element thorium was clearly detected in HE 22524225 in the two lines, Th ii 4019 and 3741 Å (Fig. 6). To determine the Th abundance as accurately as possible, we updated the list of lines contributing to the 4019 Å blend. The used lines, together with the sources of atomic data, are indicated in Table 6. The second line, Th ii 3741.183 Å, is located between the strong Ti i 3741.059 Å (/log = 0.02 eV/) and Sm ii 3741.276 Å (0.19 eV/) lines. Atomic data are indicated according to VALD. To fit the observed feature at 3741 Å in HE 22524225, we used a 0.6 dex lower -value of Ti i 3741 Å and , which is only 0.02 dex higher than the obtained mean Sm abundance. The abundance derived from Th ii 3741 Å agrees to within 0.03 dex with that for Th ii 4019 Å.
| Species | (Å) | (eV) | log | Refs. |
| Ce ii | 4018.820 | 1.546 | –0.960 | 1 |
| Nd ii | 4018.820 | 0.064 | –0.880 | 1 |
| Fe i | 4018.887 | 4.256 | –2.604 | 1 |
| Ce ii | 4018.900 | 1.013 | –1.220 | 1 |
| Ce ii | 4018.927 | 0.635 | –1.680 | 1 |
| V i | 4018.929 | 2.581 | –0.557 | 1 |
| 13CH | 4018.956 | 0.463 | –1.379 | 2 |
| Pr ii | 4018.963 | 0.204 | –1.030 | 1 |
| Mn i | 4018.987 | 4.354 | –1.884 | 1 |
| Fe i | 4019.003 | 4.320 | –1.793 | 1 |
| 13CH | 4019.010 | 0.463 | –1.354 | 2 |
| Fe i | 4019.042 | 2.608 | –2.780 | 1 |
| V ii | 4019.044 | 3.753 | –1.232 | 1 |
| Ce ii | 4019.057 | 1.014 | –0.530 | 1 |
| Mn i | 4019.066 | 4.666 | –0.523 | 1 |
| Ni i | 4019.067 | 1.935 | –3.121 | 1 |
| Co i | 4019.110 | 2.280 | –3.287 | 3 |
| Co i | 4019.118 | 2.280 | –3.173 | 3 |
| Co i | 4019.120 | 2.280 | –3.876 | 3 |
| Co i | 4019.125 | 2.280 | –3.298 | 3 |
| Co i | 4019.125 | 2.280 | –3.492 | 3 |
| Th ii | 4019.129 | 0.000 | –0.228 | 1 |
| Co i | 4019.134 | 2.280 | –3.287 | 3 |
| V i | 4019.134 | 1.804 | –2.234 | 1 |
| Co i | 4019.135 | 2.280 | –3.474 | 3 |
| Co i | 4019.138 | 2.280 | –3.173 | 3 |
| Co i | 4019.140 | 2.280 | –3.298 | 3 |
| Ce ii | 4019.271 | 0.328 | –2.320 | 1 |
| Co i | 4019.292 | 0.580 | –4.371 | 1 |
| Co i | 4019.297 | 0.630 | –3.432 | 1 |
| Refs. 1 = VALD, 2 = Hill et al. (2002), | ||||
| 3 = Johnson & Bolte (2001). | ||||
We attempted to detect the second actinide uranium. The only useful line, U ii 3859.57 Å, lies between the two strong lines, Fe i 3859.21 Å and Fe i 3859.91 Å, in their overlapping wings. Our calculations with [U/Fe] = 1 predicted a depression of about 1 % at the U ii 3859 Å line centre, however, no absorption feature was found at this place in the observed spectrum of HE 22524225. This indicates [U/Fe] for HE 22524225, although [U/Fe] cannot be ruled out, because the is about 100 in this region.
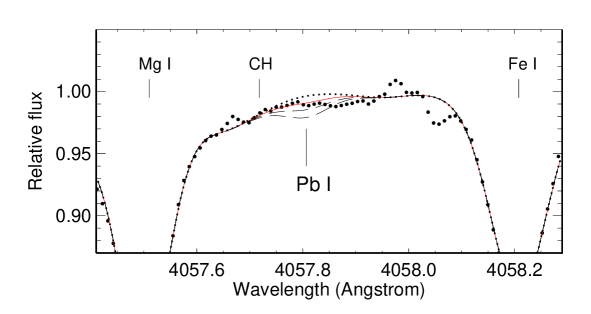
It would be of great interest to know the Pb abundance of HE 22524225, since Th and U decay to the stable element lead. In the visual spectra, lead can only be observed in the two lines of similar strengh, i.e. Pb i 3683 Å ( = 0.97 eV, log ) and 4057 Å ( = 1.32 eV, log ). However, the first line lies in a rather crowded spectral region, and most stellar Pb abundance analyses rely on using Pb i 4057 Å. In the spectrum of HE 22524225, there is a hint of a weak absorption feature at the Pb i 4057 Å line centre (Fig. 7). However, the is quite low (), and we could only estimate an upper limit for the Pb abundance to be and .
5 Heavy-element abundance pattern of HE 22524225 and r-II stars
This study confirms that HE 22524225 is enhanced in the heavy elements beyond Ba relative to iron and solar ratios (Fig. 3). For seven elements (i.e. Eu, Gd, Tb, Dy, Ho, Er, and Tm), where there is an -process contribution to the SS matter of more than 80 % according to the predictions of Bisterzo et al. (2014, hereafter, Bisterzo2014), the average abundance ratio is . The obtained [Ba/Eu] is consistent with the earlier estimate from Paper II, and the difference between [Eu/Fe] = 0.81 (this study) and [Eu/Fe] = 0.99 (Paper II) is mostly due to the higher revised iron abundance.
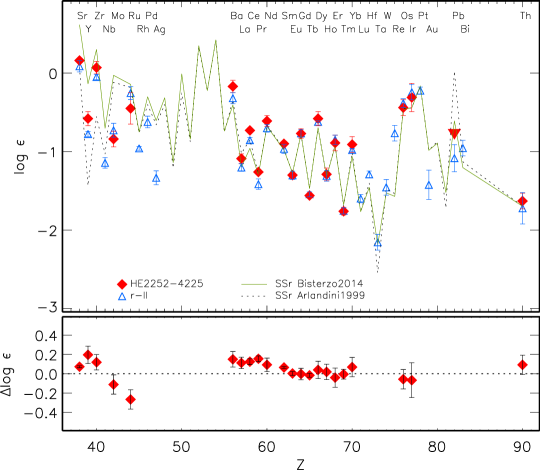
For the abundance comparison, we choose the four r-II stars with the largest number of measured species in the Sr–Th region. These are CS 22892-052 (Sneden et al. 2003), CS 31082-001 (Siqueira Mello et al. 2013), HE 1523-091 (Sneden et al. 2008), and HE 1219-0312 (Hayek et al. 2009). For each of them, the heavy-element abundances have been scaled to match Eu–Tm in HE 22524225, and the scaled abundances have been averaged. The average abundances are plotted in Fig. 8. The dispersion in the single star measurements around the mean does not exceed 0.1 dex for every investigated species except Th, indicating very similar abundance patterns of the r-II stars in the Sr–Ir region and a common origin of the first, second, and third -process peak elements in the classical -process. It is clear from Fig. 8 that the elements in the range from Ba to Yb and also Os and Ir in HE 22524225 match the scaled abundances of the r-II stars very well, with a mean difference of . No notable discrepancies between HE 22524225 and the r-II stars are also found for the light trans-iron elements Sr, Y, Zr, and Mo. For example [Sr/Eu] and [Zr/Eu] of HE 22524225 are in excellent agreement with the average abundance ratios [Sr/Eu] and [Zr/Eu] calculated in Paper V for nine r-II stars, and they are significantly lower than the corresponding values, and , for the 32 r-I stars. Thus, HE 22524225 should be referred to as r-II star, despite the slightly low derived europium enhancement of [Eu/Fe] = 0.81 (LTE) and 0.91 (NLTE).
As proposed by Mashonkina et al. (2010), a membership of a given -process enhanced MP star to the r-II or r-I group could be connected to an origin of the neutron-capture elements, if a separation involved the criteria based on not only [Eu/Fe] and [Ba/Eu], but also [Sr/Eu]. For example, the well-studied stars HD 221170 (Ivans et al. 2006) and BD +17∘3248 (Cowan et al. 2002) have very similar [Eu/Fe] and 0.91 and [Ba/Eu] and to those for HE 22524225, and by definition (Paper I), all three objects are of type r-I. However, [Sr/Eu] ratios of and for HD 221170 and BD +17∘3248, respectively, are higher than for HE 22524225 (), and an origin of the first -process peak elements in HD 221170 and BD +17∘3248 remains unclear.
In Fig. 8, we also plot the scaled solar -process residuals calculated by subtracting theoretical -process yields from the observed SS total abundance. For the latter, we rely on the meteoritic abundances of Lodders et al. (2009). For the solar -abundances, we consider the -process predictions of Arlandini et al. (1999, stellar model; hereafter, Arlandini1999) and Bisterzo et al. (2014). Arlandini1999 used stellar AGB models of 1.5 and 3 with half solar metallicity. Bisterzo2014 performed the Galactic chemical evolution (GCE) calculations that considered the -process contributions from different generations of AGB stars of various mass. Hereafter, the solar -residuals are referred to as the solar system -process (SSr) abundance pattern. A notable difference between two sets of the solar -residuals was obtained for all elements with dominant -process contribution to their solar abundances. For example for Sr, Y, and Zr, Arlandini1999 predicted a main -process contribution of 85, 92, and 83 %, respectively, while the corresponding numbers in Bisterzo2014 are 69, 72, and 66%.
The elements in the range from La to Yb and also the third -process peak elements Os and Ir in HE 22524225 were found to match the solar -process pattern very well, with a mean difference of and for the solar -abundances of Arlandini1999 and Bisterzo2014, respectively. This finding is in line with the earlier results obtained for other -process rich stars (for a review, see Sneden et al. 2008) and provides additional evidence of universal production ratio of these elements during the Galactic history. As for Ba, it does matter whether its stellar abundance and also abundances of the -process elements are determined in LTE or NLTE. The difference between the barium LTE abundance of HE 22524225 and the scaled solar -abundance amounts to 0.17 dex and 0.24 dex for the data of Arlandini1999 and Bisterzo2014, respectively. Our calculations show that NLTE leads to a 0.15 dex lower Ba, but 0.10 dex higher Eu abundance of HE 22524225 and, thus, removes the difference in Ba abundance between HE 22524225 and SSr of Bisterzo2014, when assuming the NLTE corrections for Gd-Tm abundances to be similar to those for Eu.
6 Thorium in -process enhanced stars
It would be rather challenging to determine the stellar age of HE 22524225 by comparing the observed Th-to-stable neutron-capture element-abundance ratios with the corresponding initial values at the time when the star was born, log(Th/)0:
For HE 22524225, the ratio log(Th/Eu) (LTE) or (NLTE) deviates by only a little, 0.01 or 0.03 dex, from the solar -residual ratio log(Th/Eu) (Bisterzo2014), resulting in too low an age of Gyr. Since the Sun is approximately 4.5 Gyr old, a corresponding correction of +0.1 dex accounting for the thorium radioactive decay was introduced to the solar current thorium abundance. To be as old as the galactic halo VMP stars, HE 22524225 should have an approximately 0.3 dex lower Th abundance. Figure 6 displays the effect of a variation in Th abundance on the synthetic spectrum of Th ii 4019 Å and Th ii 3741 Å. It is evident that the stellar Th abundance cannot be significantly lower than . The observational error represented by the dispersion in the measurements of multiple lines around the mean amounts to 0.02 dex for Th/Eu of HE 22524225. The systematic errors linked to our choice of stellar parameters have a common sign and very similar magnitudes for lines of Eu ii and Th ii, i.e. 0.08 dex and 0.09 dex, respectively. Thus, the total uncertainty in Th/Eu is small, and it is translated to an uncertainty of less than 1.5 Gyr for the age of HE 22524225.
Application of the above formula to the Th/ pairs involving other -process elements leads to to 3.3 Gyr for Gd, Ho, Er, and Os, and 7.9 Gyr for Dy and Ir, and negative age for Tb and Tm. It is clear that Th does appear to be enhanced in HE 22524225 to a higher level than observed for elements of the second and third -process peaks, and HE 22524225 belongs to the group of the so-called actinide boost stars.
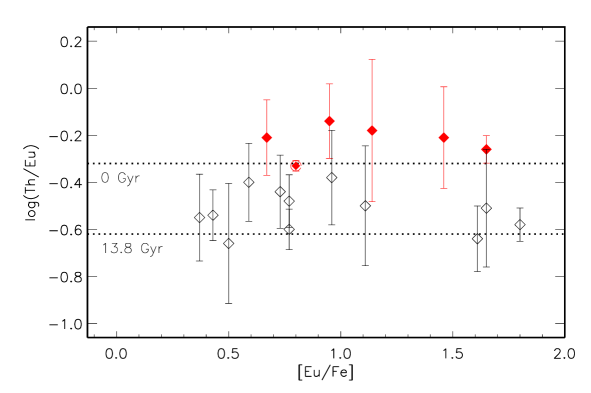
The first discovered star with an anomalously high Th/Eu abundance ratio of log(Th/Eu) was CS 31082-001 (Hill et al. 2002). Roederer et al. (2009) revised Eu and Th abundances of 15 MP stars that reveal pure -process neutron-capture elements. Figure 9 displays the Th/Eu abundance ratios of the Roederer et al. (2009) sample and also HE 23275642 (Paper V), CS 30315-029 (Siqueira-Mello et al. 2014), and HE 22524225. It appears that 12 of the 18 stars have no obvious enhancement of thorium with respect to the scaled solar -process pattern, and for each of them, its stellar age agrees within the error bars with the cosmic age Gyr (Bennett et al. 2013) derived from the updated results of the Wilkinson Microwave Anisotropy Probe (WMAP). For example, Gyr was calculated for CS 22892-052 with log(Th/Eu) . The remaining six stars, namely, CS 31082-001, CS 30306-132 (discovered by Honda et al. 2004), CS 31078-018 (Lai et al. 2008), HE 1219-0312 (Hayek et al. 2009), CS 30315-029 (Siqueira-Mello et al. 2014), and HE 22524225, exhibit an actinide boost, and their ages cannot be derived when only a single radioactive element Th is detected. Indeed, a negative age of Gyr is calculated for CS 31082-001, when using the Th/Eu abundance ratio. This implies that thorium in the actinide boost stars was overproduced compared with the normal Th/Eu stars and the SS matter. Only the detection of the second actinide, uranium, made possible an estimation of the stellar age of CS 31082-001 through analysis of U/Th; i.e., Gyr was first obtained by Cayrel et al. (2001), and the revised value is Gyr (Hill et al. 2002). This provided solid evidence that different -process nucleosynthesis events may produce significantly different yields in the actinide region (). To find out whether variations in progenitor mass or explosion energy, or other intrinsic and environmental factors, or all of these, influence the -process yields for the heaviest elements, more measurements of Th and U abundances in stars should be done.
7 Conclusions
We revised the stellar parameters and performed a detailed abundance analysis of the VMP giant HE 22524225 using high-quality VLT/UVES spectra and refined theoretical methods of line-formation modelling. The effective temperature, K, previously derived in Paper II was confirmed through analysis of the H and H line wings in HE 22524225. The surface gravity, log g = 1.65, the iron abundance, [Fe/H] , and the microturbulence velocity, km s-1, were calculated from the NLTE ionisation balance between Fe i and Fe ii.
Accurate abundances for a total of 38 elements from C to Th were determined in HE 22524225. For each chemical species, the dispersion in the single line measurements around the mean does not exceed 0.12 dex. The investigated star was found to be deficient in carbon, as expected for a giant star with K. The elements in the range from Na to Zn reveal a typical behaviour of the galactic halo VMP stars. The Na–Zn abundance pattern of HE 22524225 is well fitted by the yields of a single supernova of 14.4 , similar to the Lai et al. (2008) stellar sample.
We confirmed that HE 22524225 is -process enhanced, having . The investigated star and four benchmark r-II stars; i.e., CS 22892-052 (Sneden et al. 2003), CS 31082-001 (Siqueira Mello et al. 2013), HE 1219-0312 (Hayek et al. 2009), and HE 1523-091 (Sneden et al. 2008) have very similar abundance patterns of the elements in the range from Sr to Ir. Hence, neutron-capture elements beyond Sr and up to Ir in HE 22524225 have a common origin in the classical main -process. Applying the third criterion, [Sr/Eu] (Mashonkina et al. 2010), in addition to the two, [Eu/Fe] and [Ba/Eu] , as suggested by Christlieb et al. (2004), makes membership to r-II stars have a physical sense related to an origin of the neutron-capture elements in the star; i.e., an r-II star can be defined as a star having neutron-capture elements originating in a single -process.
We tested the solar -process pattern based on recent -process calculations of Bisterzo et al. (2014) and found that the elements in the range from Ba to Ir in HE 22524225 match it very well. No firm conclusion can be drawn about the relationship between the first neutron-capture peak elements, Sr to Ru, in HE 22524225 and the solar -process, owing to the uncertainty in the solar -process.
The star HE 22524225 has an anomalously high Th/Eu abundance ratio, so that radioactive age dating results in a stellar age of Gyr that is not expected for a very metal-poor halo star. This is the sixth star in the group of actinide boost stars. Understanding the mechanisms resulting in different yields in the actinide region from different -process events is a challenge for nucleosynthesis theory and requires studying larger samples of r-I and r-II stars.
Acknowledgements.
This work was supported by Sonderforschungsbereich SFB 881 “The Milky Way System” (subprojects A4 and A5) of the German Research Foundation (DFG). L.M. is supported by the Russian Foundation for Basic Research (grant 14-02-91153) and the Swiss National Science Foundation (SCOPES project No. IZ73Z0-152485). We made use the NIST and VALD databases.References
- Alexeeva et al. (2014) Alexeeva, S., Pakhomov, Y., & Mashonkina, L. 2014, Astronomy Letters, 40, 406
- Andrievsky et al. (2010) Andrievsky, S. M., Spite, M., Korotin, S. A., et al. 2010, A&A, 509, A88
- Andrievsky et al. (2008) Andrievsky, S. M., Spite, M., Korotin, S. A., et al. 2008, A&A, 481, 481
- Anstee & O’Mara (1995) Anstee, S. D. & O’Mara, B. J. 1995, MNRAS, 276, 859
- Aoki et al. (2010) Aoki, W., Beers, T. C., Honda, S., & Carollo, D. 2010, ApJ, 723, L201
- Aoki et al. (2006) Aoki, W., Frebel, A., Christlieb, N., et al. 2006, ApJ, 639, 897
- Aoki et al. (2005) Aoki, W., Honda, S., Beers, T. C., et al. 2005, ApJ, 632, 611
- Arlandini et al. (1999) Arlandini, C., Käppeler, F., Wisshak, K., et al. 1999, ApJ, 525, 886
- Bagnulo et al. (2003) Bagnulo, S., Jehin, E., Ledoux, C., et al. 2003, The Messenger, 114, 10
- Bard et al. (1991) Bard, A., Kock, A., & Kock, M. 1991, A&A, 248, 315
- Barklem & Aspelund-Johansson (2005) Barklem, P. S. & Aspelund-Johansson, J. 2005, A&A, 435, 373
- Barklem et al. (2010) Barklem, P. S., Belyaev, A. K., Dickinson, A. S., & Gadéa, F. X. 2010, A&A, 519, A20
- Barklem et al. (2012) Barklem, P. S., Belyaev, A. K., Spielfiedel, A., Guitou, M., & Feautrier, N. 2012, A&A, 541, A80
- Barklem et al. (2005) Barklem, P. S., Christlieb, N., Beers, T. C., et al. 2005, A&A, 439, 129, (Paper II)
- Barklem & O’Mara (1997) Barklem, P. S. & O’Mara, B. J. 1997, MNRAS, 290, 102
- Barklem & O’Mara (1998) Barklem, P. S. & O’Mara, B. J. 1998, MNRAS, 300, 863
- Barklem et al. (1998) Barklem, P. S., O’Mara, B. J., & Ross, J. E. 1998, MNRAS, 296, 1057
- Barklem et al. (2000) Barklem, P. S., Piskunov, N., & O’Mara, B. J. 2000, A&A, 363, 1091
- Baumueller & Gehren (1996) Baumueller, D. & Gehren, T. 1996, A&A, 307, 961
- Beers et al. (2007) Beers, T., Flynn, C., Rossi, S., et al. 2007, ApJ Suppl., 168, 128
- Belyakova & Mashonkina (1997) Belyakova, E. V. & Mashonkina, L. I. 1997, Astronomy Reports, 41, 530
- Bennett et al. (2013) Bennett, C. L., Larson, D., Weiland, J. L., et al. 2013, ApJS, 208, 20
- Bergemann (2011) Bergemann, M. 2011, MNRAS, 413, 2184
- Bergemann & Cescutti (2010) Bergemann, M. & Cescutti, G. 2010, A&A, 522, A9
- Bergemann & Gehren (2008) Bergemann, M. & Gehren, T. 2008, A&A, 492, 823
- Bergemann et al. (2012) Bergemann, M., Lind, K., Collet, R., Magic, Z., & Asplund, M. 2012, MNRAS, 427, 27
- Bergemann et al. (2010) Bergemann, M., Pickering, J. C., & Gehren, T. 2010, MNRAS, 401, 1334
- Biémont et al. (1998) Biémont, E., Dutrieux, J.-F., Martin, I., & Quinet, P. 1998, Journal of Physics B Atomic Molecular Physics, 31, 3321
- Biémont et al. (2000) Biémont, E., Garnir, H. P., Palmeri, P., Li, Z. S., & Svanberg, S. 2000, MNRAS, 312, 116
- Biemont et al. (1989) Biemont, E., Grevesse, N., Faires, L. M., et al. 1989, A&A, 209, 391
- Bisterzo et al. (2014) Bisterzo, S., Travaglio, C., Gallino, R., Wiescher, M., & Käppeler, F. 2014, ApJ, 787, 10
- Blackwell et al. (1979) Blackwell, D. E., Ibbetson, P. A., Petford, A. D., & Shallis, M. J. 1979, MNRAS, 186, 633
- Blackwell et al. (1982a) Blackwell, D. E., Petford, A. D., Shallis, M. J., & Simmons, G. J. 1982a, MNRAS, 199, 43
- Blackwell et al. (1982b) Blackwell, D. E., Petford, A. D., & Simmons, G. J. 1982b, MNRAS, 201, 595
- Borghs et al. (1983) Borghs, G., de Bisschop, P., van Hove, M., & Silverans, R. E. 1983, Hyperfine Interactions, 15, 177
- Butler & Giddings (1985) Butler, K. & Giddings, J. 1985, Newsletter on the analysis of astronomical spectra, No. 9, University of London
- Cardon et al. (1982) Cardon, B. L., Smith, P. L., Scalo, J. M., Testerman, L., & Whaling, W. 1982, ApJ, 260, 395
- Carlsson (1986) Carlsson, M. 1986, Uppsala Astronomical Observatory Reports, 33
- Cayrel et al. (2004) Cayrel, R., Depagne, E., Spite, M., et al. 2004, A&A, 416, 1117
- Cayrel et al. (2001) Cayrel, R., Hill, V., Beers, T. C., et al. 2001, Nature, 409, 691
- Chang & Tang (1990) Chang, T. N. & Tang, X. 1990, J. Quant. Spec. Radiat. Transf., 43, 207
- Christlieb et al. (2004) Christlieb, N., Beers, T. C., Barklem, P. S., et al. 2004, A&A, 428, 1027, (Paper I)
- Christlieb et al. (2008) Christlieb, N., Schörck, T., Frebel, A., et al. 2008, A&A, 484, 721
- Collet et al. (2007) Collet, R., Asplund, M., & Trampedach, R. 2007, A&A, 469, 687
- Cowan et al. (2005) Cowan, J. J., Sneden, C., Beers, T. C., et al. 2005, ApJ, 627, 238
- Cowan et al. (2002) Cowan, J. J., Sneden, C., Burles, S., et al. 2002, ApJ, 572, 861
- Cowley & Corliss (1983) Cowley, C. R. & Corliss, C. H. 1983, MNRAS, 203, 651
- Creevey et al. (2012) Creevey, O. L., Thévenin, F., Boyajian, T. S., et al. 2012, A&A, 545, A17
- Den Hartog et al. (2003) Den Hartog, E. A., Lawler, J. E., Sneden, C., & Cowan, J. J. 2003, Astrophys. J. Suppl. Ser., 148, 543
- Den Hartog et al. (2006) Den Hartog, E. A., Lawler, J. E., Sneden, C., & Cowan, J. J. 2006, Astrophys. J. Suppl. Ser., 167, 292
- Den Hartog et al. (2011) Den Hartog, E. A., Lawler, J. E., Sobeck, J. S., Sneden, C., & Cowan, J. J. 2011, ApJS, 194, 35
- Dobrovolskas et al. (2013) Dobrovolskas, V., Kučinskas, A., Steffen, M., et al. 2013, A&A, 559, A102
- Doyle (1968) Doyle, R. O. 1968, ApJ, 153, 987
- Drawin (1968) Drawin, H.-W. 1968, Zeitschrift fur Physik, 211, 404
- Drawin (1969) Drawin, H. W. 1969, Zeitschrift fur Physik, 225, 483
- François et al. (2007) François, P., Depagne, E., Hill, V., et al. 2007, A&A, 476, 935
- Frebel et al. (2007) Frebel, A., Christlieb, N., Norris, J. E., et al. 2007, ApJ, 660, L117
- Fuhr et al. (1988) Fuhr, J. R., Martin, G. A., & Wiese, W. L. 1988, Journal of Physical and Chemical Reference Data, 17
- Fuhr & Wiese (1992) Fuhr, J. R. & Wiese, W. L. 1992, NIST Atomic Transition Probability Tables, CRC Handbook of Chemistry & Physics, 77th Edition, D. R. Lide (CRC Press, Inc., Boca Raton, FL)
- Ginibre (1989) Ginibre, A. 1989, Phys. Scr, 39, 694
- Gustafsson et al. (2008) Gustafsson, B., Edvardsson, B., Eriksson, K., et al. 2008, A&A, 486, 951
- Hannaford et al. (1982) Hannaford, P., Lowe, R. M., Grevesse, N., Biemont, E., & Whaling, W. 1982, ApJ, 261, 736
- Hayek et al. (2011) Hayek, W., Asplund, M., Collet, R., & Nordlund, Å. 2011, A&A, 529, A158
- Hayek et al. (2009) Hayek, W., Wiesendahl, U., Christlieb, N., et al. 2009, A&A, 504, 511
- Hill et al. (2002) Hill, V., Plez, B., Cayrel, R., et al. 2002, A&A, 387, 560
- Holt et al. (1999) Holt, R. A., Scholl, T. J., & Rosner, S. D. 1999, MNRAS, 306, 107
- Honda et al. (2004) Honda, S., Aoki, W., Kajino, T., et al. 2004, ApJ, 607, 474
- Ivans et al. (2006) Ivans, I. I., Simmerer, J., Sneden, C., et al. 2006, ApJ, 645, 613
- Ivarsson et al. (2003) Ivarsson, S., Andersen, J., Nordström, B., et al. 2003, Astron. and Astrophys., 409, 1141
- Ivarsson et al. (2001) Ivarsson, S., Litzén, U., & Wahlgren, G. M. 2001, Physica Scripta, 64, 455
- Johnson & Bolte (2001) Johnson, J. A. & Bolte, M. 2001, ApJ, 554, 888
- Johnson et al. (2007) Johnson, J. A., Herwig, F., Beers, T. C., & Christlieb, N. 2007, ApJ, 658, 1203
- Kling & Griesmann (2000) Kling, R. & Griesmann, U. 2000, ApJ, 531, 1173
- Kobayashi et al. (2011) Kobayashi, C., Karakas, A. I., & Umeda, H. 2011, MNRAS, 414, 3231
- Korotin et al. (1999) Korotin, S. A., Andrievsky, S. M., & Luck, R. E. 1999, A&A, 351, 168
- Kupka et al. (1999) Kupka, F., Piskunov, N., Ryabchikova, T. A., Stempels, H. C., & Weiss, W. W. 1999, A&AS, 138, 119, (VALD)
- Kurucz (1993) Kurucz, R. L. 1993, SYNTHE Spectrum Synthesis Programs and Line Data. Kurucz CD-ROM No. 18. Cambridge, Mass.: Smithsonian Astrophysical Observatory, 1993, 18.
- Kurucz (1994) Kurucz, R. L. 1994, Opacities for Stellar Atmospheres. CD-ROM No. 2-8 (Cambridge, Mass)
- Kurucz (2003) Kurucz, R. L. 2003, Robert L. Kurucz on-line database of observed and predicted atomic transitions
- Kurucz (2005) Kurucz, R. L. 2005, Memorie della Societa Astronomica Italiana Supplementi, 8, 14
- Kurucz et al. (1984) Kurucz, R. L., Furenlid, I., Brault, J., & Testerman, L. 1984, Solar flux atlas from 296 to 1300 nm (New Mexico: National Solar Observatory)
- Lai et al. (2008) Lai, D. K., Bolte, M., Johnson, J. A., et al. 2008, ApJ, 681, 1524
- Lawler et al. (2001a) Lawler, J. E., Bonvallet, G., & Sneden, C. 2001a, ApJ, 556, 452
- Lawler & Dakin (1989) Lawler, J. E. & Dakin, J. T. 1989, Journal of the Optical Society of America B Optical Physics, 6, 1457
- Lawler et al. (2006) Lawler, J. E., Den Hartog, E. A., Sneden, C., & Cowan, J. J. 2006, Astrophys. J. Suppl. Ser., 162, 227
- Lawler et al. (2013) Lawler, J. E., Guzman, A., Wood, M. P., Sneden, C., & Cowan, J. J. 2013, ApJS, 205, 11
- Lawler et al. (2004) Lawler, J. E., Sneden, C., & Cowan, J. J. 2004, ApJ, 604, 850
- Lawler et al. (2009) Lawler, J. E., Sneden, C., Cowan, J. J., Ivans, I. I., & Den Hartog, E. A. 2009, Astrophys. J. Suppl. Ser., 182, 51
- Lawler et al. (2008) Lawler, J. E., Sneden, C., Cowan, J. J., et al. 2008, ApJS, 178, 71
- Lawler et al. (2001b) Lawler, J. E., Wickliffe, M. E., Cowley, C. R., & Sneden, C. 2001b, Astrophys. J. Suppl. Ser., 137, 341
- Lawler et al. (2001c) Lawler, J. E., Wickliffe, M. E., den Hartog, E. A., & Sneden, C. 2001c, ApJ, 563, 1075
- Lawler et al. (2001d) Lawler, J. E., Wyart, J.-F., & Blaise, J. 2001d, ApJS, 137, 351
- Lefèbvre et al. (2003) Lefèbvre, P.-H., Garnir, H.-P., & Biémont, E. 2003, A&A, 404, 1153
- Ljung et al. (2006) Ljung, G., Nilsson, H., Asplund, M., & Johansson, S. 2006, A&A, 456, 1181
- Lodders et al. (2009) Lodders, K., Plame, H., & Gail, H.-P. 2009, in Landolt-Börnstein - Group VI Astronomy and Astrophysics Numerical Data and Functional Relationships in Science and Technology Volume 4B: Solar System. Edited by J.E. Trümper, 2009, 4.4., 44–54
- Mårtensson-Pendrill et al. (1994) Mårtensson-Pendrill, A.-M., Gough, D. S., & Hannaford, P. 1994, Phys. Rev. A, 49, 3351
- Malcheva et al. (2006) Malcheva, G., Blagoev, K., Mayo, R., et al. 2006, MNRAS, 367, 754
- Mashonkina (2013) Mashonkina, L. 2013, A&A, 550, A28
- Mashonkina & Christlieb (2014) Mashonkina, L. & Christlieb, N. 2014, A&A, 565, A123
- Mashonkina et al. (2010) Mashonkina, L., Christlieb, N., Barklem, P. S., et al. 2010, A&A, 516, A46, (Paper V)
- Mashonkina & Gehren (2000) Mashonkina, L. & Gehren, T. 2000, A&A, 364, 249
- Mashonkina & Gehren (2001) Mashonkina, L. & Gehren, T. 2001, A&A, 376, 232
- Mashonkina et al. (1999) Mashonkina, L., Gehren, T., & Bikmaev, I. 1999, A&A, 343, 519
- Mashonkina et al. (2011) Mashonkina, L., Gehren, T., Shi, J.-R., Korn, A. J., & Grupp, F. 2011, A&A, 528, A87
- Mashonkina et al. (2007a) Mashonkina, L., Korn, A. J., & Przybilla, N. 2007a, A&A, 461, 261
- Mashonkina et al. (2012) Mashonkina, L., Ryabtsev, A., & Frebel, A. 2012, A&A, 540, A98
- Mashonkina et al. (2008) Mashonkina, L., Zhao, G., Gehren, T., et al. 2008, A&A, 478, 529
- Mashonkina et al. (2007b) Mashonkina, L. I., Vinogradova, A. B., Ptitsyn, D. A., Khokhlova, V. S., & Chernetsova, T. A. 2007b, Astronomy Reports, 51, 903
- McWilliam et al. (1995) McWilliam, A., Preston, G. W., Sneden, C., & Searle, L. 1995, AJ, 109, 2757
- Meggers et al. (1975) Meggers, W. F., Corliss, C. H., & Scribner, B. F. 1975, Tables of spectral-line intensities. Part I, II_- arranged by elements., ed. Meggers, W. F., Corliss, C. H., & Scribner, B. F.
- Meléndez & Barbuy (2009) Meléndez, J. & Barbuy, B. 2009, A&A, 497, 611
- Nilsson et al. (2006) Nilsson, H., Ljung, G., Lundberg, H., & Nielsen, K. E. 2006, Astron. and Astrophys., 445, 1165
- Nilsson et al. (2002) Nilsson, H., Zhang, Z. G., Lundberg, H., Johansson, S., & Nordström, B. 2002, Astron. and Astrophys., 382, 368
- Nitz et al. (1999) Nitz, D. E., Kunau, A. E., Wilson, K. L., & Lentz, L. R. 1999, ApJS, 122, 557
- O’brian & Lawler (1991) O’brian, T. R. & Lawler, J. E. 1991, Phys. Rev. A, 44, 7134
- Pickering (1996) Pickering, J. C. 1996, ApJS, 107, 811
- Pickering et al. (2001) Pickering, J. C., Thorne, A. P., & Perez, R. 2001, ApJS, 132, 403
- Pinnington et al. (1993) Pinnington, E. H., Ji, Q., Guo, B., et al. 1993, Canadian Journal of Physics, 71, 470
- Ralchenko et al. (2008) Ralchenko, Y. A., Kramida, E., Reader, J., & Team, N. A. 2008, NIST Atomic Spectra Database (version 3.1.5) (USA)
- Reader et al. (1980) Reader, J., Corliss, C. H., Wiese, W. L., & Martin, G. A. 1980, Wavelengths and transition probabilities for atoms and atomic ions: Part 1. Wavelengths, part 2. Transition probabilities
- Reetz (1991) Reetz, J. K. 1991, Diploma Thesis (Universität München)
- Roederer et al. (2009) Roederer, I. U., Kratz, K.-L., Frebel, A., et al. 2009, ApJ, 698, 1963
- Roederer & Lawler (2012) Roederer, I. U. & Lawler, J. E. 2012, ApJ, 750, 76
- Salih et al. (1985) Salih, S., Lawler, J. E., & Whaling, W. 1985, Phys. Rev. A, 31, 744
- Sansonetti et al. (1995) Sansonetti, C. J., Richou, B., Engleman, Jr., R., & Radziemski, L. J. 1995, Phys. Rev. A, 52, 2682
- Schlegel et al. (1998) Schlegel, D. J., Finkbeiner, D. P., & Davis, M. 1998, ApJ, 500, 525
- Shavrina et al. (1996) Shavrina, A. V., Yakovina, L. A., & Bikmaev, I. F. 1996, Kinematics and Physics of Celestial Bodies, 12, 35
- Shi et al. (2008) Shi, J. R., Gehren, T., Butler, K., Mashonkina, L. I., & Zhao, G. 2008, A&A, 486, 303
- Siqueira-Mello et al. (2014) Siqueira-Mello, C., Hill, V., Barbuy, B., et al. 2014, ArXiv e-prints
- Siqueira Mello et al. (2013) Siqueira Mello, C., Spite, M., Barbuy, B., et al. 2013, A&A, 550, A122
- Sitnova & Mashonkina (2011) Sitnova, T. M. & Mashonkina, L. I. 2011, Astronomy Letters, 37, 480
- Smith (1981) Smith, G. 1981, A&A, 103, 351
- Smith & O’Neill (1975) Smith, G. & O’Neill, J. A. 1975, A&A, 38, 1
- Smith & Raggett (1981) Smith, G. & Raggett, D. S. J. 1981, Journal of Physics B Atomic Molecular Physics, 14, 4015
- Sneden et al. (2008) Sneden, C., Cowan, J. J., & Gallino, R. 2008, ARA&A, 46, 241
- Sneden et al. (2003) Sneden, C., Cowan, J. J., Lawler, J. E., et al. 2003, ApJ, 591, 936
- Sneden et al. (1994) Sneden, C., Preston, G. W., McWilliam, A., & Searle, L. 1994, ApJ, 431, L27
- Sobeck et al. (2007) Sobeck, J. S., Lawler, J. E., & Sneden, C. 2007, Astrophys. J., 667, 1267
- Spite et al. (2012) Spite, M., Andrievsky, S. M., Spite, F., et al. 2012, A&A, 541, A143
- Takeda et al. (2005) Takeda, Y., Hashimoto, O., Taguchi, H., et al. 2005, PASJ, 57, 751
- Vidal et al. (1973) Vidal, C. R., Cooper, J., & Smith, E. W. 1973, ApJS, 25, 37
- Whaling & Brault (1988) Whaling, W. & Brault, J. W. 1988, Phys. Scr, 38, 707
- Wickliffe & Lawler (1997a) Wickliffe, M. E. & Lawler, J. E. 1997a, Journal of the Optical Society of America B Optical Physics, 14, 737
- Wickliffe & Lawler (1997b) Wickliffe, M. E. & Lawler, J. E. 1997b, ApJS, 110, 163
- Wickliffe et al. (2000) Wickliffe, M. E., Lawler, J. E., & Nave, G. 2000, J. Quant. Spec. Radiat. Transf., 66, 363
- Wickliffe et al. (1994) Wickliffe, M. E., Salih, S., & Lawler, J. E. 1994, J. Quant. Spec. Radiat. Transf., 51, 545
- Wood et al. (2013) Wood, M. P., Lawler, J. E., Sneden, C., & Cowan, J. J. 2013, ApJS, 208, 27
| Z | Atom/ | Ref | [X/Fe] | Note, ref. | ||||||||
|---|---|---|---|---|---|---|---|---|---|---|---|---|
| mol | (Å) | (eV) | Solar | LTE | NLTE | (mÅ) | (rad/scm3) | |||||
| 1 | 2 | 3 | 4 | 5 | 6 | 7 | 8 | 9 | 10 | 11 | 12 | 13 |
| 3 | Li I | 6707.80 | 0.00 | 0.167 | NIST8 | 1.10 | 0.1 | Syn | 7.574 | IS:SRE95 | ||
| :ABO | ||||||||||||
| 6 | CH | 4310-4312.5 | BCB05 | 8.39 | 5.13 | 0.63 | Syn | |||||
| 6 | CH | 4314 | BCB05 | 8.39 | 5.16 | 0.60 | Syn | |||||
| 6 | CH | 4362-4364.5 | BCB05 | 8.39 | 5.14 | 0.62 | Syn | |||||
| 6 | CH | 4366-4367.0 | BCB05 | 8.39 | 5.16 | 0.60 | Syn | |||||
| 7 | NH | 3416.64 | 0.94 | K94 | 7.83 | 4.91 | 0.29 | Syn | ||||
| 11 | Na I | 5889.96 | 0.00 | 0.11 | NIST8 | 6.30 | 3.57 | 3.13 | 0.54 | Syn | 7.67 | :ABO |
| 11 | Na I | 5895.93 | 0.00 | 0.19 | NIST8 | 6.30 | 3.57 | 3.13 | 0.54 | Syn | 7.67 | :ABO |
| 12 | Mg I | 4571.10 | 0.00 | 5.62 | NIST8 | 7.54 | 4.98 | 5.22 | 0.31 | Syn | 7.77 | :ABO |
| 12 | Mg I | 4702.99 | 4.33 | 0.44 | CT90 | 7.54 | 4.98 | 5.01 | 0.10 | Syn | 6.99 | :M13 |
| 12 | Mg I | 5528.41 | 4.33 | 0.50 | CT90 | 7.54 | 5.02 | 5.03 | 0.12 | Syn | 7.18 | :M13 |
| 13 | Al I | 3961.52 | 0.01 | 0.34 | NIST8 | 6.47 | 2.85 | 2.99 | 0.85 | Syn | 7.32 | :ABO |
| 14 | Si I | 3905.53 | 1.91 | 1.04 | BL91 | 7.52 | 4.99 | 4.97 | 0.08 | Syn | 7.36 | :ABO |
| 20 | Ca I | 4425.44 | 1.88 | 0.36 | SON75 | 6.33 | 3.60 | 3.86 | 0.16 | 36.8 | 7.432 | :MKP07 |
| 20 | Ca I | 5349.46 | 2.71 | 0.31 | SR81 | 6.33 | 3.74 | 4.05 | 0.35 | 10.1 | 7.652 | :S81 |
| 20 | Ca I | 5588.75 | 2.53 | 0.36 | SR81 | 6.33 | 3.62 | 3.92 | 0.22 | 39.5 | 7.628 | :S81 |
| 20 | Ca I | 5857.45 | 2.93 | 0.24 | SR81 | 6.33 | 3.69 | 3.87 | 0.17 | 17.0 | 7.316 | :S81 |
| 20 | Ca I | 6122.22 | 1.89 | 0.31 | SON75 | 6.33 | 3.73 | 3.96 | 0.26 | 53.4 | 7.189 | :ABO |
| 20 | Ca I | 6162.17 | 1.90 | 0.09 | SON75 | 6.33 | 3.70 | 3.90 | 0.20 | 64.5 | 7.189 | :ABO |
| 20 | Ca I | 6169.56 | 2.53 | 0.48 | SR81 | 6.33 | 3.68 | 3.97 | 0.27 | 10.5 | 7.264 | :S81 |
| 20 | Ca I | 6439.08 | 2.53 | 0.39 | SR81 | 6.33 | 3.65 | 3.83 | 0.13 | 45.6 | 7.704 | :S81 |
| 20 | Ca I | 6449.81 | 2.52 | 0.50 | SR81 | 6.33 | 3.69 | 3.93 | 0.23 | 10.6 | 7.652 | :S81 |
| 20 | Ca I | 6493.78 | 2.52 | 0.11 | SR81 | 6.33 | 3.70 | 3.95 | 0.25 | 23.3 | 7.704 | :S81 |
| 21 | Sc II | 3567.70 | 0.00 | 0.48 | LD89 | 3.07 | 0.39 | 0.05 | Syn | HFS:MPS95 | ||
| 21 | Sc II | 4314.09 | 0.62 | 0.10 | LD89 | 3.07 | 0.31 | 0.13 | Syn | the same | ||
| 21 | Sc II | 4400.39 | 0.60 | 0.54 | LD89 | 3.07 | 0.26 | 0.18 | Syn | the same | ||
| 21 | Sc II | 4415.56 | 0.60 | 0.67 | LD89 | 3.07 | 0.31 | 0.13 | Syn | the same | ||
| 22 | Ti I | 3998.64 | 0.05 | 0.02 | LGW13 | 4.90 | 2.21 | 0.20 | 67.6 | 7.654 | :ABO | |
| 22 | Ti I | 4533.25 | 0.85 | 0.54 | LGW13 | 4.90 | 2.22 | 0.21 | 50.2 | 7.593 | the same | |
| 22 | Ti I | 4534.78 | 0.84 | 0.35 | LGW13 | 4.90 | 2.19 | 0.18 | 39.1 | 7.596 | the same | |
| 22 | Ti I | 4981.73 | 0.85 | 0.57 | LGW13 | 4.90 | 2.28 | 0.27 | 58.2 | 7.626 | the same | |
| 22 | Ti I | 4991.06 | 0.84 | 0.45 | LGW13 | 4.90 | 2.29 | 0.28 | 53.0 | 7.629 | the same | |
| 22 | Ti I | 5022.87 | 0.83 | 0.33 | LGW13 | 4.90 | 2.22 | 0.21 | 13.8 | 7.633 | the same | |
| 22 | Ti I | 5024.85 | 0.82 | 0.53 | LGW13 | 4.90 | 2.38 | 0.37 | 13.1 | 7.635 | the same | |
| 22 | Ti I | 5039.96 | 0.02 | 1.08 | LGW13 | 4.90 | 2.31 | 0.30 | 25.7 | 7.720 | the same | |
| 22 | Ti I | 5064.66 | 0.05 | 0.94 | LGW13 | 4.90 | 2.28 | 0.27 | 29.2 | 7.719 | the same | |
| 22 | Ti I | 5210.39 | 0.05 | 0.82 | LGW13 | 4.90 | 2.27 | 0.26 | 35.5 | 7.724 | the same | |
| 22 | Ti II | 4028.34 | 1.89 | 0.92 | WL13 | 4.90 | 2.62 | 0.36 | 56.8 | |||
| 22 | Ti II | 4053.83 | 1.89 | 1.07 | WL13 | 4.90 | 2.44 | 0.17 | 39.3 | |||
| 22 | Ti II | 4394.05 | 1.22 | 1.77 | WL13 | 4.90 | 2.65 | 0.38 | 59.6 | |||
| 22 | Ti II | 4395.85 | 1.24 | 1.93 | WL13 | 4.90 | 2.62 | 0.35 | 48.0 | |||
| 22 | Ti II | 4399.77 | 1.24 | 1.20 | WL13 | 4.90 | 2.74 | 0.47 | 89.1 | |||
| 22 | Ti II | 4417.72 | 1.16 | 1.19 | PTP01 | 4.90 | 2.76 | 0.49 | 94.0 | |||
| 22 | Ti II | 4418.33 | 1.24 | 1.99 | WL13 | 4.90 | 2.64 | 0.37 | 45.5 | |||
| 22 | Ti II | 4444.56 | 1.12 | 2.20 | WL13 | 4.90 | 2.71 | 0.44 | 46.1 | |||
| 22 | Ti II | 4450.48 | 1.08 | 1.52 | WL13 | 4.90 | 2.73 | 0.46 | 83.7 | |||
| 22 | Ti II | 4464.45 | 1.16 | 1.81 | PTP01 | 4.90 | 2.72 | 0.45 | 65.1 | |||
| 22 | Ti II | 4470.86 | 1.16 | 2.02 | PTP01 | 4.90 | 2.55 | 0.28 | 45.0 | |||
| 22 | Ti II | 5185.91 | 1.89 | 1.41 | WL13 | 4.90 | 2.54 | 0.27 | 33.2 | |||
| 22 | Ti II | 5188.70 | 1.58 | 1.05 | PTP01 | 4.90 | 2.70 | 0.43 | 82.4 | |||
| 22 | Ti II | 5226.55 | 1.57 | 1.26 | PTP01 | 4.90 | 2.61 | 0.34 | 67.8 | |||
| 22 | Ti II | 5336.79 | 1.58 | 1.60 | WL13 | 4.90 | 2.60 | 0.33 | 47.2 | |||
| 22 | Ti II | 5381.01 | 1.57 | 1.97 | WL13 | 4.90 | 2.60 | 0.33 | 28.6 | |||
| 23 | V II | 3530.76 | 1.07 | 0.47 | BGF89 | 4.00 | 1.09 | 0.28 | Syn | |||
| 23 | V II | 3545.19 | 1.10 | 0.26 | BGF89 | 4.00 | 1.14 | 0.23 | Syn | |||
| 23 | V II | 3592.03 | 1.10 | 0.26 | BGF89 | 4.00 | 1.14 | 0.23 | Syn | |||
| 24 | Cr I | 5206.04 | 0.94 | 0.02 | SLS07 | 5.64 | 2.62 | 0.13 | 83.6 | 7.597 | :ABO | |
| 24 | Cr I | 5296.69 | 0.98 | 1.36 | SLS07 | 5.64 | 2.73 | 0.02 | 17.4 | 7.621 | the same | |
| 24 | Cr I | 5345.81 | 1.00 | 0.95 | SLS07 | 5.64 | 2.70 | 0.05 | 32.8 | 7.620 | the same | |
| 24 | Cr I | 5348.33 | 1.00 | 1.21 | SLS07 | 5.64 | 2.60 | 0.15 | 17.2 | 7.620 | the same | |
| 24 | Cr I | 5409.80 | 1.03 | 0.67 | SLS07 | 5.64 | 2.64 | 0.11 | 42.8 | 7.620 | the same | |
| 24 | Cr II | 4558.65 | 4.07 | 0.45 | PGB93 | 5.65 | 3.10 | 0.08 | Syn | |||
| 24 | Cr II | 4588.20 | 4.07 | 0.63 | PGB93 | 5.65 | 3.08 | 0.06 | Syn | |||
| 24 | Cr II | 4634.07 | 4.07 | 0.98 | NLL06 | 5.65 | 2.99 | 0.03 | Syn | |||
| 24 | Cr II | 4848.23 | 3.86 | 1.00 | NLL06 | 5.65 | 3.01 | 0.01 | Syn | |||
| 25 | Mn I | 4033.06 | 0.00 | -0.64 | DLS11 | 5.37 | 2.05 | -0.43 | Syn | -7.738 | HFS:LGB03 | |
| :ABO | ||||||||||||
| 25 | Mn I | 4041.35 | 2.11 | 0.28 | DLS11 | 5.37 | 2.35 | 0.13 | Syn | -7.701 | the same | |
| 25 | Mn I | 4055.54 | 2.13 | 0.08 | DLS11 | 5.37 | 2.44 | 0.04 | Syn | -7.698 | the same | |
| 25 | Mn I | 4823.52 | 2.32 | 0.12 | DLS11 | 5.37 | 2.44 | 0.04 | Syn | -7.600 | the same | |
| 25 | Mn II | 3460.31 | 1.81 | 0.64 | KG00 | 5.37 | 2.63 | 0.11 | Syn | HFS:HSR99 | ||
| 25 | Mn II | 3482.90 | 1.83 | 0.84 | KG00 | 5.37 | 2.63 | 0.11 | Syn | the same | ||
| 25 | Mn II | 3488.67 | 1.85 | 0.95 | KG00 | 5.37 | 2.60 | 0.14 | Syn | the same | ||
| 26 | Fe I | 3917.18 | 0.99 | 2.15 | OWL91 | 7.45 | 4.82 | 5.04 | 0.22 | 91.7 | -7.695 | :AB |
| 26 | Fe I | 3949.95 | 2.18 | 1.25 | OWL91 | 7.45 | 4.60 | 4.84 | 0.02 | 61.8 | -7.820 | the same |
| 26 | Fe I | 4132.90 | 2.85 | 1.01 | OWL91 | 7.45 | 4.57 | 4.82 | 0.00 | 34.9 | -7.659 | the same |
| 26 | Fe I | 4147.67 | 1.49 | 2.07 | OWL91 | 7.45 | 4.70 | 4.91 | 0.09 | 69.5 | -7.648 | the same |
| 26 | Fe I | 4216.18 | 0.00 | 3.36 | FMW88 | 7.45 | 4.86 | 5.12 | 0.30 | 98.8 | -7.797 | the same |
| 26 | Fe I | 4260.47 | 2.40 | 0.08 | OWL91 | 7.45 | 4.53 | 4.70 | 0.12 | 110.0 | -7.274 | the same |
| 26 | Fe I | 4445.47 | 0.09 | 5.44 | BIP79 | 7.45 | 4.79 | 5.00 | 0.18 | 7.5 | -7.816 | the same |
| 26 | Fe I | 4602.94 | 1.49 | 2.21 | OWL91 | 7.45 | 4.65 | 4.89 | 0.07 | 65.6 | -7.790 | the same |
| 26 | Fe I | 4647.43 | 2.95 | 1.35 | OWL91 | 7.45 | 4.67 | 4.93 | 0.11 | 21.0 | -7.685 | the same |
| 26 | Fe I | 4920.50 | 2.83 | 0.07 | OWL91 | 7.45 | 4.56 | 4.75 | 0.07 | 94.8 | -7.276 | the same |
| 26 | Fe I | 4966.09 | 3.33 | 0.87 | OWL91 | 7.45 | 4.67 | 4.97 | 0.15 | 23.2 | -7.218 | the same |
| 26 | Fe I | 4994.13 | 0.92 | 2.97 | OWL91 | 7.45 | 4.67 | 4.89 | 0.07 | 66.6 | -7.744 | the same |
| 26 | Fe I | 5001.86 | 3.88 | 0.01 | FMW88 | 7.45 | 4.43 | 4.73 | 0.09 | 22.9 | -7.273 | the same |
| 26 | Fe I | 5014.94 | 3.94 | 0.30 | OWL91 | 7.45 | 4.65 | 4.93 | 0.11 | 16.8 | -7.268 | the same |
| 26 | Fe I | 5051.63 | 0.92 | 2.77 | OWL91 | 7.45 | 4.82 | 5.03 | 0.21 | 84.1 | -7.746 | the same |
| 26 | Fe I | 5068.77 | 2.94 | 1.04 | OWL91 | 7.45 | 4.55 | 4.81 | 0.01 | 31.1 | -7.265 | the same |
| 26 | Fe I | 5150.84 | 0.99 | 3.04 | OWL91 | 7.45 | 4.62 | 4.83 | 0.01 | 55.7 | -7.742 | the same |
| 26 | Fe I | 5166.28 | 0.00 | 4.20 | OWL91 | 7.45 | 4.81 | 5.05 | 0.23 | 70.8 | -7.826 | the same |
| 26 | Fe I | 5192.34 | 3.00 | 0.42 | OWL91 | 7.45 | 4.47 | 4.74 | 0.08 | 57.5 | -7.266 | the same |
| 26 | Fe I | 5194.94 | 1.56 | 2.02 | OWL91 | 7.45 | 4.66 | 4.86 | 0.04 | 75.4 | -7.680 | the same |
| 26 | Fe I | 5198.71 | 2.22 | 2.14 | BPSS | 7.45 | 4.65 | 4.87 | 0.05 | 25.2 | -7.600 | the same |
| 26 | Fe I | 5216.27 | 1.61 | 2.08 | OWL91 | 7.45 | 4.62 | 4.81 | 0.01 | 67.0 | -7.674 | the same |
| 26 | Fe I | 5217.39 | 3.21 | 1.07 | BKK91 | 7.45 | 4.51 | 4.75 | 0.07 | 15.9 | -7.220 | the same |
| 26 | Fe I | 5232.94 | 2.94 | 0.06 | OWL91 | 7.45 | 4.51 | 4.74 | 0.08 | 82.1 | -7.288 | the same |
| 26 | Fe I | 5247.06 | 0.09 | 4.95 | BIP79 | 7.45 | 4.75 | 4.98 | 0.16 | 22.0 | -7.826 | the same |
| 26 | Fe I | 5250.21 | 0.12 | 4.94 | BIP79 | 7.45 | 4.76 | 4.98 | 0.16 | 21.0 | -7.832 | the same |
| 26 | Fe I | 5281.79 | 3.04 | 0.83 | OWL91 | 7.45 | 4.51 | 4.78 | 0.04 | 35.0 | -7.266 | the same |
| 26 | Fe I | 5283.62 | 3.24 | 0.52 | OWL91 | 7.45 | 4.61 | 4.87 | 0.05 | 43.7 | -7.221 | the same |
| 26 | Fe I | 5324.18 | 3.21 | 0.10 | BKK91 | 7.45 | 4.43 | 4.69 | 0.13 | 59.3 | -7.235 | the same |
| 26 | Fe I | 5339.93 | 3.27 | 0.72 | OWL91 | 7.45 | 4.58 | 4.84 | 0.02 | 30.4 | -7.221 | the same |
| 26 | Fe I | 5364.87 | 4.45 | 0.23 | OWL91 | 7.45 | 4.65 | 4.97 | 0.15 | 15.7 | -7.136 | the same |
| 26 | Fe I | 5367.47 | 4.41 | 0.44 | OWL91 | 7.45 | 4.50 | 4.84 | 0.02 | 18.8 | -7.153 | the same |
| 26 | Fe I | 5369.96 | 4.37 | 0.54 | OWL91 | 7.45 | 4.44 | 4.79 | 0.03 | 22.1 | -7.179 | the same |
| 26 | Fe I | 5383.37 | 4.31 | 0.64 | OWL91 | 7.45 | 4.45 | 4.81 | 0.01 | 30.2 | -7.219 | the same |
| 26 | Fe I | 5393.17 | 3.24 | 0.72 | BKK91 | 7.45 | 4.53 | 4.79 | 0.03 | 29.8 | -7.235 | the same |
| 26 | Fe I | 5410.91 | 4.47 | 0.40 | OWL91 | 7.45 | 4.43 | 4.77 | 0.05 | 13.5 | -7.132 | the same |
| 26 | Fe I | 5415.20 | 4.39 | 0.64 | OWL91 | 7.45 | 4.42 | 4.80 | 0.02 | 25.0 | -7.182 | the same |
| 26 | Fe I | 5434.52 | 1.01 | 2.13 | OWL91 | 7.45 | 4.79 | 4.94 | 0.12 | 110.0 | -7.749 | the same |
| 26 | Fe I | 5445.04 | 4.39 | 0.02 | FMW88 | 7.45 | 4.74 | 5.06 | 0.24 | 13.2 | -7.189 | the same |
| 26 | Fe I | 5506.78 | 0.99 | 2.80 | OWL91 | 7.45 | 4.79 | 4.98 | 0.16 | 80.3 | -7.753 | the same |
| 26 | Fe I | 5576.09 | 3.43 | 1.00 | FMW88 | 7.45 | 4.70 | 4.94 | 0.12 | 16.5 | -7.200 | the same |
| 26 | Fe I | 5586.76 | 3.37 | 0.10 | BKK91 | 7.45 | 4.43 | 4.68 | 0.13 | 49.9 | -7.221 | the same |
| 26 | Fe I | 5615.64 | 3.33 | 0.05 | BKK91 | 7.45 | 4.39 | 4.64 | 0.18 | 59.0 | -7.234 | the same |
| 26 | Fe I | 6065.48 | 2.61 | 1.53 | BPS82 | 7.45 | 4.62 | 4.83 | 0.01 | 33.8 | -7.636 | the same |
| 26 | Fe I | 6136.62 | 2.45 | 1.41 | OWL91 | 7.45 | 4.65 | 4.86 | 0.04 | 53.0 | -7.609 | the same |
| 26 | Fe I | 6137.69 | 2.59 | 1.35 | OWL91 | 7.45 | 4.60 | 4.81 | 0.01 | 43.9 | -7.589 | the same |
| 26 | Fe I | 6191.56 | 2.43 | 1.42 | OWL91 | 7.45 | 4.57 | 4.79 | 0.03 | 50.1 | -7.615 | the same |
| 26 | Fe I | 6213.43 | 2.22 | 2.48 | OWL91 | 7.45 | 4.59 | 4.81 | 0.01 | 13.6 | -7.704 | the same |
| 26 | Fe I | 6252.56 | 2.40 | 1.69 | BPSS | 7.45 | 4.66 | 4.88 | 0.06 | 41.3 | -7.680 | the same |
| 26 | Fe I | 6393.60 | 2.43 | 1.43 | OWL91 | 7.45 | 4.50 | 4.75 | 0.07 | 46.0 | -7.622 | the same |
| 26 | Fe I | 6400.00 | 3.60 | 0.29 | BKK91 | 7.45 | 4.48 | 4.77 | 0.05 | 30.2 | -7.232 | the same |
| 26 | Fe I | 6411.65 | 3.65 | 0.59 | BKK91 | 7.45 | 4.52 | 4.79 | 0.03 | 16.9 | -7.224 | the same |
| 26 | Fe I | 6421.35 | 2.28 | 2.03 | BPSS | 7.45 | 4.66 | 4.86 | 0.04 | 31.9 | -7.792 | the same |
| 26 | Fe I | 6430.85 | 2.18 | 1.95 | OWL91 | 7.45 | 4.59 | 4.81 | 0.01 | 39.2 | -7.704 | the same |
| 26 | Fe II | 4491.40 | 2.86 | 2.71 | MB09 | 7.45 | 4.80 | 4.80 | 0.02 | 25.1 | -7.880 | the same |
| 26 | Fe II | 4508.29 | 2.86 | 2.44 | MB09 | 7.45 | 4.88 | 4.89 | 0.07 | 42.4 | -7.870 | the same |
| 26 | Fe II | 4582.83 | 2.84 | 3.18 | MB09 | 7.45 | 4.73 | 4.73 | 0.09 | 9.5 | -7.880 | the same |
| 26 | Fe II | 4620.52 | 2.83 | 3.21 | MB09 | 7.45 | 4.69 | 4.70 | 0.12 | 8.6 | -7.880 | the same |
| 26 | Fe II | 4923.93 | 2.89 | 1.26 | MB09 | 7.45 | 4.85 | 4.82 | 0.01 | 98.5 | -7.890 | the same |
| 26 | Fe II | 5018.44 | 2.89 | 1.10 | MB09 | 7.45 | 4.89 | 4.86 | 0.04 | 109.0 | -7.890 | the same |
| 26 | Fe II | 5197.58 | 3.23 | 2.22 | MB09 | 7.45 | 4.84 | 4.85 | 0.03 | 31.4 | -7.880 | the same |
| 26 | Fe II | 5234.62 | 3.22 | 2.18 | MB09 | 7.45 | 4.82 | 4.83 | 0.01 | 33.3 | -7.880 | the same |
| 26 | Fe II | 5264.81 | 3.23 | 3.13 | MB09 | 7.45 | 4.91 | 4.92 | 0.10 | 6.4 | -7.880 | the same |
| 26 | Fe II | 5284.11 | 2.89 | 3.11 | MB09 | 7.45 | 4.85 | 4.85 | 0.03 | 13.5 | -7.890 | the same |
| 26 | Fe II | 6247.56 | 3.89 | 2.30 | MB09 | 7.45 | 4.72 | 4.74 | 0.08 | 5.3 | -7.880 | the same |
| 26 | Fe II | 6456.38 | 3.90 | 2.05 | MB09 | 7.45 | 4.85 | 4.87 | 0.05 | 11.6 | -7.880 | the same |
| 27 | Co I | 3412.33 | 0.51 | 0.03 | CSS82 | 4.92 | 1.91 | 0.12 | Syn | -7.666 | HFS:P96 | |
| :ABO | ||||||||||||
| 27 | Co I | 3489.40 | 0.92 | 0.15 | CSS82 | 4.92 | 2.00 | 0.03 | Syn | -7.610 | the same | |
| 27 | Co I | 4121.31 | 0.92 | 0.30 | NKW99 | 4.92 | 2.08 | 0.05 | Syn | -7.724 | the same | |
| 27 | Co II | 3501.72 | 2.20 | 1.00 | SLW85 | 4.92 | 2.16 | 0.13 | Syn | |||
| 28 | Ni I | 3413.47 | 0.16 | 1.48 | FMW88 | 6.23 | 3.15 | 0.19 | Syn | -7.690 | :ABO | |
| 28 | Ni I | 3413.93 | 0.11 | 1.72 | FMW88 | 6.23 | 3.25 | 0.09 | Syn | -7.785 | the same | |
| 28 | Ni I | 3783.52 | 0.42 | 1.31 | FMW88 | 6.23 | 3.34 | 0.00 | Syn | -7.780 | the same | |
| 28 | Ni I | 3807.14 | 0.42 | 1.18 | FMW88 | 6.23 | 3.45 | 0.11 | Syn | -7.694 | the same | |
| 28 | Ni I | 3858.29 | 0.42 | 0.97 | FMW88 | 6.23 | 3.35 | 0.01 | Syn | -7.700 | the same | |
| 28 | Ni I | 5035.37 | 3.63 | 0.29 | WL97a | 6.23 | 3.51 | 0.17 | Syn | -7.231 | the same | |
| 28 | Ni II | 3769.46 | 3.10 | 1.72 | K03 | 6.23 | 3.75 | 0.15 | Syn | |||
| 30 | Zn I | 4722.16 | 4.01 | 0.37 | RL12 | 4.62 | 2.43 | 2.41 | 0.42 | Syn | ||
| 30 | Zn I | 4810.54 | 4.08 | 0.15 | RL12 | 4.62 | 2.44 | 2.42 | 0.43 | Syn | ||
| 38 | Sr II | 4077.72 | 0.00 | 0.15 | RCW80 | 2.92 | 0.16 | 0.23 | 0.06 | Syn | -7.792 | HFS:BBH83 |
| :MZG08 | ||||||||||||
| 38 | Sr II | 4215.54 | 0.00 | 0.17 | RCW80 | 2.92 | 0.16 | 0.16 | 0.13 | Syn | -7.792 | HFS:BBH83 |
| :MZG08 | ||||||||||||
| 39 | Y II | 3549.01 | 0.13 | 0.28 | HLG82 | 2.21 | 0.36 | 0.06 | Syn | |||
| 39 | Y II | 3600.74 | 0.18 | 0.28 | HLG82 | 2.21 | 0.56 | 0.14 | Syn | |||
| 39 | Y II | 3611.04 | 0.13 | 0.01 | HLG82 | 2.21 | 0.77 | 0.35 | Syn | |||
| 39 | Y II | 3774.33 | 0.13 | 0.21 | HLG82 | 2.21 | 0.56 | 0.14 | Syn | |||
| 39 | Y II | 3788.69 | 0.10 | 0.07 | HLG82 | 2.21 | 0.59 | 0.17 | Syn | |||
| 39 | Y II | 3950.35 | 0.10 | 0.49 | HLG82 | 2.21 | 0.55 | 0.13 | Syn | |||
| 39 | Y II | 4398.01 | 0.13 | 1.00 | HLG82 | 2.21 | 0.54 | 0.12 | Syn | |||
| 39 | Y II | 4883.68 | 1.08 | 0.07 | HLG82 | 2.21 | 0.62 | 0.20 | Syn | |||
| 39 | Y II | 5087.43 | 1.08 | 0.17 | HLG82 | 2.21 | 0.64 | 0.22 | Syn | |||
| 40 | Zr II | 3404.83 | 0.36 | 0.49 | LNA06 | 2.58 | 0.06 | 0.01 | Syn | |||
| 40 | Zr II | 3457.56 | 0.56 | 0.47 | MBM06 | 2.58 | 0.11 | 0.06 | Syn | |||
| 40 | Zr II | 3479.39 | 0.71 | 0.18 | LNA06 | 2.58 | 0.06 | 0.11 | Syn | |||
| 40 | Zr II | 3481.17 | 0.80 | 0.16 | CC83 | 2.58 | 0.07 | 0.12 | Syn | |||
| 40 | Zr II | 3499.57 | 0.41 | 1.06 | LNA06 | 2.58 | 0.04 | 0.09 | Syn | |||
| 40 | Zr II | 3505.67 | 0.16 | 0.39 | LNA06 | 2.58 | 0.09 | 0.14 | Syn | |||
| 40 | Zr II | 3551.95 | 0.10 | 0.36 | LNA06 | 2.58 | 0.07 | 0.12 | Syn | |||
| 40 | Zr II | 3766.82 | 0.41 | 0.83 | LNA06 | 2.58 | 0.17 | 0.22 | Syn | |||
| 40 | Zr II | 3991.13 | 0.76 | 0.31 | LNA06 | 2.58 | 0.06 | 0.11 | Syn | |||
| 40 | Zr II | 3998.97 | 0.56 | 0.52 | LNA06 | 2.58 | 0.12 | 0.17 | Syn | |||
| 40 | Zr II | 4161.21 | 0.71 | 0.59 | LNA06 | 2.58 | 0.09 | 0.14 | Syn | |||
| 40 | Zr II | 4208.98 | 0.71 | 0.51 | LNA06 | 2.58 | 0.12 | 0.17 | Syn | |||
| 42 | Mo I | 3864.11 | 0.00 | 0.01 | FW96 | 1.92 | 0.84 | 0.13 | Syn | |||
| 44 | Ru I | 3728.02 | 0.00 | 0.27 | WSL94 | 1.84 | 0.45 | 0.60 | Syn | |||
| 56 | Ba II | 5853.67 | 0.60 | 1.00 | RCW80 | 2.17 | 0.25 | 0.27 | 0.19 | Syn | -7.584 | :ABO |
| 56 | Ba II | 6141.71 | 0.70 | 0.08 | RCW80 | 2.17 | 0.18 | 0.35 | 0.11 | Syn | -7.584 | the same |
| 56 | Ba II | 6496.90 | 0.60 | 0.38 | RCW80 | 2.17 | 0.10 | 0.33 | 0.13 | Syn | -7.584 | the same |
| 57 | La II | 3849.01 | 0.00 | 0.45 | LBS01 | 1.14 | 1.12 | 0.37 | Syn | HFS:LBS01 | ||
| 57 | La II | 3949.10 | 0.40 | 0.49 | LBS01 | 1.14 | 1.16 | 0.33 | Syn | the same | ||
| 57 | La II | 3988.51 | 0.40 | 0.21 | LBS01 | 1.14 | 1.15 | 0.34 | Syn | the same | ||
| 57 | La II | 3995.74 | 0.17 | 0.06 | LBS01 | 1.14 | 1.11 | 0.38 | Syn | the same | ||
| 57 | La II | 4077.34 | 0.24 | 0.06 | LBS01 | 1.14 | 1.01 | 0.48 | Syn | the same | ||
| 57 | La II | 4086.71 | 0.00 | 0.07 | LBS01 | 1.14 | 1.14 | 0.35 | Syn | the same | ||
| 57 | La II | 4196.55 | 0.32 | 0.30 | LBS01 | 1.14 | 1.09 | 0.40 | Syn | the same | ||
| 57 | La II | 4920.98 | 0.13 | 0.58 | LBS01 | 1.14 | 0.99 | 0.50 | Syn | the same | ||
| 58 | Ce II | 3942.15 | 0.00 | 0.22 | LSC09 | 1.61 | 0.75 | 0.27 | Syn | |||
| 58 | Ce II | 3992.38 | 0.45 | 0.22 | LSC09 | 1.61 | 0.75 | 0.27 | Syn | |||
| 58 | Ce II | 3999.24 | 0.30 | 0.06 | LSC09 | 1.61 | 0.75 | 0.27 | Syn | |||
| 58 | Ce II | 4073.47 | 0.48 | 0.21 | LSC09 | 1.61 | 0.72 | 0.30 | Syn | |||
| 58 | Ce II | 4083.22 | 0.70 | 0.27 | LSC09 | 1.61 | 0.73 | 0.29 | Syn | |||
| 58 | Ce II | 4127.36 | 0.68 | 0.31 | LSC09 | 1.61 | 0.77 | 0.25 | Syn | |||
| 58 | Ce II | 4137.64 | 0.52 | 0.40 | LSC09 | 1.61 | 0.74 | 0.28 | Syn | |||
| 58 | Ce II | 4222.60 | 0.12 | 0.15 | LSC09 | 1.61 | 0.68 | 0.34 | Syn | |||
| 58 | Ce II | 4486.91 | 0.30 | 0.18 | LSC09 | 1.61 | 0.73 | 0.29 | Syn | |||
| 58 | Ce II | 4562.36 | 0.48 | 0.21 | LSC09 | 1.61 | 0.68 | 0.34 | Syn | |||
| 59 | Pr II | 4179.40 | 0.20 | 0.48 | ILW01 | 0.76 | 1.23 | 0.64 | Syn | HFS:G89 | ||
| 59 | Pr II | 4408.82 | 0.00 | 0.18 | ILW01 | 0.76 | 1.29 | 0.58 | Syn | the same | ||
| 59 | Pr II | 4222.93 | 0.05 | 0.27 | ILW01 | 0.76 | 1.25 | 0.62 | Syn | the same | ||
| 60 | Nd II | 3784.25 | 0.38 | 0.15 | DLS03 | 1.45 | 0.72 | 0.46 | Syn | |||
| 60 | Nd II | 3838.98 | 0.00 | 0.24 | DLS03 | 1.45 | 0.68 | 0.50 | Syn | |||
| 60 | Nd II | 3991.74 | 0.00 | 0.26 | DLS03 | 1.45 | 0.58 | 0.60 | Syn | |||
| 60 | Nd II | 4018.82 | 0.06 | 0.85 | DLS03 | 1.45 | 0.66 | 0.52 | Syn | |||
| 60 | Nd II | 4021.33 | 0.32 | 0.10 | DLS03 | 1.45 | 0.69 | 0.49 | Syn | |||
| 60 | Nd II | 4023.00 | 0.56 | 0.04 | DLS03 | 1.45 | 0.64 | 0.54 | Syn | |||
| 60 | Nd II | 4059.95 | 0.20 | 0.52 | DLS03 | 1.45 | 0.71 | 0.47 | Syn | |||
| 60 | Nd II | 4061.08 | 0.47 | 0.55 | DLS03 | 1.45 | 0.61 | 0.57 | Syn | |||
| 60 | Nd II | 4069.26 | 0.06 | 0.57 | DLS03 | 1.45 | 0.56 | 0.62 | Syn | |||
| 60 | Nd II | 4135.32 | 0.63 | 0.07 | DLS03 | 1.45 | 0.60 | 0.58 | Syn | |||
| 60 | Nd II | 4156.08 | 0.18 | 0.16 | DLS03 | 1.45 | 0.56 | 0.62 | Syn | |||
| 60 | Nd II | 4177.33 | 0.06 | 0.10 | DLS03 | 1.45 | 0.62 | 0.56 | Syn | |||
| 60 | Nd II | 4232.37 | 0.06 | 0.47 | DLS03 | 1.45 | 0.64 | 0.54 | Syn | |||
| 60 | Nd II | 4385.66 | 0.20 | 0.30 | DLS03 | 1.45 | 0.64 | 0.54 | Syn | |||
| 60 | Nd II | 4446.38 | 0.20 | 0.35 | DLS03 | 1.45 | 0.61 | 0.57 | Syn | |||
| 60 | Nd II | 4462.98 | 0.56 | 0.04 | DLS03 | 1.45 | 0.56 | 0.62 | Syn | |||
| 60 | Nd II | 4563.22 | 0.18 | 0.88 | DLS03 | 1.45 | 0.44 | 0.74 | Syn | |||
| 60 | Nd II | 4706.54 | 0.00 | 0.71 | DLS03 | 1.45 | 0.58 | 0.60 | Syn | |||
| 60 | Nd II | 5319.82 | 0.55 | 0.14 | DLS03 | 1.45 | 0.62 | 0.56 | Syn | |||
| 62 | Sm II | 3993.31 | 0.04 | 0.93 | LDS06 | 1.00 | 0.92 | 0.71 | Syn | |||
| 62 | Sm II | 4318.94 | 0.28 | 0.25 | LDS06 | 1.00 | 0.89 | 0.74 | Syn | |||
| 62 | Sm II | 4434.32 | 0.38 | 0.07 | LDS06 | 1.00 | 0.89 | 0.74 | Syn | |||
| 62 | Sm II | 4467.34 | 0.66 | 0.15 | LDS06 | 1.00 | 0.91 | 0.72 | Syn | |||
| 62 | Sm II | 4519.63 | 0.54 | 0.35 | LDS06 | 1.00 | 0.89 | 0.74 | Syn | |||
| 63 | Eu II | 3819.67 | 0.00 | 0.51 | LWD01 | 0.52 | 1.31 | 1.24 | 0.87 | Syn | HFS:LWD01 | |
| 63 | Eu II | 3907.11 | 0.21 | 0.17 | LWD01 | 0.52 | 1.31 | 1.16 | 0.95 | Syn | the same | |
| 63 | Eu II | 4129.72 | 0.00 | 0.22 | LWD01 | 0.52 | 1.29 | 1.20 | 0.91 | Syn | the same | |
| 63 | Eu II | 4205.02 | 0.00 | 0.21 | LWD01 | 0.52 | 1.28 | 1.22 | 0.89 | Syn | the same | |
| 64 | Gd II | 3768.40 | 0.08 | 0.21 | DLS06 | 1.11 | 0.74 | 0.78 | Syn | |||
| 64 | Gd II | 3796.38 | 0.03 | 0.02 | DLS06 | 1.11 | 0.71 | 0.81 | Syn | |||
| 64 | Gd II | 4130.37 | 0.73 | 0.14 | DLS06 | 1.11 | 0.84 | 0.68 | Syn | |||
| 64 | Gd II | 4215.02 | 0.43 | 0.44 | DLS06 | 1.11 | 0.79 | 0.73 | Syn | |||
| 65 | Tb II | 3568.51 | 0.00 | 0.36 | LWC01 | 0.28 | 1.56 | 0.79 | Syn | HFS:LWB01 | ||
| 65 | Tb II | 3702.85 | 0.13 | 0.44 | LWC01 | 0.28 | 1.56 | 0.79 | Syn | the same | ||
| 65 | Tb II | 3848.73 | 0.00 | 0.28 | LWC01 | 0.28 | 1.56 | 0.79 | Syn | the same | ||
| 66 | Dy II | 3407.80 | 0.00 | 0.18 | WLN00 | 1.13 | 0.50 | 1.00 | Syn | |||
| 66 | Dy II | 3445.57 | 0.00 | 0.15 | WLN00 | 1.13 | 0.57 | 0.93 | Syn | |||
| 66 | Dy II | 3454.32 | 0.10 | 0.14 | WLN00 | 1.13 | 0.77 | 0.73 | Syn | |||
| 66 | Dy II | 3460.97 | 0.00 | 0.07 | WLN00 | 1.13 | 0.57 | 0.93 | Syn | |||
| 66 | Dy II | 3506.81 | 0.10 | 0.60 | WLN00 | 1.13 | 0.62 | 0.88 | Syn | |||
| 66 | Dy II | 3531.71 | 0.00 | 0.77 | WLN00 | 1.13 | 0.52 | 0.98 | Syn | |||
| 66 | Dy II | 3536.02 | 0.54 | 0.53 | WLN00 | 1.13 | 0.67 | 0.83 | Syn | |||
| 66 | Dy II | 3538.52 | 0.00 | 0.02 | WLN00 | 1.13 | 0.67 | 0.83 | Syn | |||
| 66 | Dy II | 3550.22 | 0.59 | 0.27 | WLN00 | 1.13 | 0.67 | 0.83 | Syn | |||
| 66 | Dy II | 3563.15 | 0.10 | 0.36 | WLN00 | 1.13 | 0.47 | 1.03 | Syn | |||
| 66 | Dy II | 3694.81 | 0.10 | 0.11 | WLN00 | 1.13 | 0.65 | 0.85 | Syn | |||
| 66 | Dy II | 3944.68 | 0.00 | 0.11 | WLN00 | 1.13 | 0.47 | 1.03 | Syn | |||
| 66 | Dy II | 3996.69 | 0.59 | 0.26 | WLN00 | 1.13 | 0.57 | 0.93 | Syn | |||
| 66 | Dy II | 4077.96 | 0.10 | 0.04 | WLN00 | 1.13 | 0.52 | 0.98 | Syn | |||
| 67 | Ho II | 3416.44 | 0.08 | 0.26 | LSC04 | 0.51 | 1.24 | 0.88 | Syn | HFS:LSC04 | ||
| 67 | Ho II | 3456.00 | 0.00 | 0.76 | LSC04 | 0.51 | 1.40 | 0.72 | Syn | the same | ||
| 67 | Ho II | 3796.67 | 0.00 | 0.16 | LSC04 | 0.51 | 1.23 | 0.89 | Syn | the same | ||
| 67 | Ho II | 3810.60 | 0.00 | 0.19 | LSC04 | 0.51 | 1.30 | 0.82 | Syn | the same | ||
| 68 | Er II | 3499.10 | 0.06 | 0.29 | LSC08 | 0.96 | 0.93 | 0.74 | Syn | |||
| 68 | Er II | 3633.54 | 0.00 | 0.53 | LSC08 | 0.96 | 1.08 | 0.59 | Syn | |||
| 68 | Er II | 3692.65 | 0.06 | 0.28 | LSC08 | 0.96 | 0.83 | 0.84 | Syn | |||
| 68 | Er II | 3729.52 | 0.00 | 0.59 | LSC08 | 0.96 | 0.83 | 0.84 | Syn | |||
| 68 | Er II | 3786.84 | 0.00 | 0.52 | LSC08 | 0.96 | 0.78 | 0.89 | Syn | |||
| 68 | Er II | 3830.48 | 0.00 | 0.22 | LSC08 | 0.96 | 0.88 | 0.79 | Syn | |||
| 68 | Er II | 3896.23 | 0.06 | 0.12 | LSC08 | 0.96 | 0.86 | 0.81 | Syn | |||
| 68 | Er II | 3938.63 | 0.00 | 0.52 | MCS75 | 0.96 | 0.98 | 0.69 | Syn | |||
| 69 | Tm II | 3462.20 | 0.00 | 0.03 | WL97b | 0.14 | 1.81 | 0.68 | Syn | |||
| 69 | Tm II | 3700.26 | 0.03 | 0.38 | WL97b | 0.14 | 1.71 | 0.78 | Syn | |||
| 69 | Tm II | 3701.36 | 0.00 | 0.54 | WL97b | 0.14 | 1.81 | 0.68 | Syn | |||
| 69 | Tm II | 3795.76 | 0.03 | 0.23 | WL97b | 0.14 | 1.74 | 0.75 | Syn | |||
| 69 | Tm II | 3848.02 | 0.00 | 0.14 | WL97b | 0.14 | 1.74 | 0.75 | Syn | |||
| 70 | Yb II | 3694.19 | 0.00 | 0.30 | BDM98 | 0.86 | 0.91 | 0.86 | Syn | HFS:MGH94 | ||
| 76 | Os I | 4260.85 | 0.00 | 1.43 | IAN03 | 1.45 | 0.44 | 1.00 | Syn | |||
| 77 | Ir I | 3513.630 | 0.00 | 1.21 | IAN03 | 1.38 | 0.25 | 1.26 | Syn | HFS:CSB05 | ||
| 77 | Ir I | 3800.120 | 0.00 | 1.44 | IAN03 | 1.38 | 0.39 | 1.12 | Syn | HFS:CSB05 | ||
| 82 | Pb I | 4057.81 | 1.32 | 0.17 | BGP00 | 2.00 | 0.78 | 0.37 | 0.26 | Syn | ||
| 90 | Th II | 3741.18 | 0.19 | 0.17 | NZL02 | 0.08 | 1.65 | 1.55 | 1.00 | Syn | ||
| 90 | Th II | 4019.13 | 0.00 | 0.23 | NZL02 | 0.08 | 1.62 | 1.56 | 0.99 | Syn | ||
| ABO | Anstee & O’Mara (1995); Barklem & O’Mara (1997); Barklem et al. (1998); |
|---|---|
| Barklem & O’Mara (1998); Barklem & Aspelund-Johansson (2005); Barklem (2012, private comm.); | |
| BBH83 | Borghs et al. (1983); |
| BCB05 | Barklem et al. (2005); |
| BDM98 | Biémont et al. (1998); |
| BGF89 | Biemont et al. (1989); |
| BGP00 | Biémont et al. (2000); |
| BIP79 | Blackwell et al. (1979); |
| BKK91 | Bard et al. (1991); |
| BL91 | O’brian & Lawler (1991); |
| BPSS | Blackwell et al. (1982a); |
| BPS82 | Blackwell et al. (1982b); |
| CC83 | Cowley & Corliss (1983); |
| CSB05 | Cowan et al. (2005); |
| CSS82 | Cardon et al. (1982); |
| CT90 | Chang & Tang (1990); |
| DLS03 | Den Hartog et al. (2003); |
| DLS06 | Den Hartog et al. (2006); |
| DLS11 | Den Hartog et al. (2011); |
| FMW88 | Fuhr et al. (1988); |
| FW96 | Fuhr & Wiese (1992); |
| G89 | Ginibre (1989); |
| HLG82 | Hannaford et al. (1982); |
| HSR99 | Holt et al. (1999); |
| IAN03 | Ivarsson et al. (2003); |
| ILW01 | Ivarsson et al. (2001); |
| K94 | Kurucz (1994); |
| K03 | Kurucz (2003); |
| KG00 | Kling & Griesmann (2000); |
| LBS01 | Lawler et al. (2001a); |
| LD89 | Lawler & Dakin (1989); |
| LDS06 | Lawler et al. (2006); |
| LGB03 | Lefèbvre et al. (2003); |
| LGW13 | Lawler et al. (2013); |
| LNA06 | Ljung et al. (2006); |
| LSC04 | Lawler et al. (2004); |
| LSC08 | Lawler et al. (2008); |
| LSC09 | Lawler et al. (2009); |
| LWB01 | Lawler et al. (2001d); |
| LWC01 | Lawler et al. (2001b); |
| LWD01 | Lawler et al. (2001c); |
| M13 | Mashonkina (2013); |
| MB09 | Meléndez & Barbuy (2009); |
| MBM06 | Malcheva et al. (2006); |
| MCS75 | Meggers et al. (1975); |
| MGH94 | Mårtensson-Pendrill et al. (1994); |
| MKP07 | Mashonkina et al. (2007a); |
| MPS95 | McWilliam et al. (1995); |
| MZG08 | Mashonkina et al. (2008); |
| NIST8 | Ralchenko et al. (2008); |
| NKW99 | Nitz et al. (1999); |
| NLL06 | Nilsson et al. (2006); |
| NZL02 | Nilsson et al. (2002); |
| OWL91 | O’brian & Lawler (1991); |
| P96 | Pickering (1996); |
| PGB93 | Pinnington et al. (1993); |
| PTP01 | Pickering et al. (2001); |
| RCW80 | Reader et al. (1980); |
| RL12 | Roederer & Lawler (2012); |
| S81 | Smith (1981); |
| SLS07 | Sobeck et al. (2007); |
| SLW85 | Salih et al. (1985); |
| SR81 | Smith & Raggett (1981); |
| SON75 | Smith & O’Neill (1975); |
| SRE95 | Sansonetti et al. (1995); |
| WB88 | Whaling & Brault (1988); |
| WL13 | Wood et al. (2013); |
| WL97a | Wickliffe & Lawler (1997b); |
| WL97b | Wickliffe & Lawler (1997a); |
| WLN00 | Wickliffe et al. (2000); |
| WSL94 | Wickliffe et al. (1994); |