Sub-barrier enhancement of fusion as compared to a microscopic method in 18O+12C
Abstract
- Background
-
Measurement of the energy dependence of the fusion cross-section at sub-barrier energies provides an important test for theoretical models of fusion.
- Purpose
-
To extend the measurement of fusion cross-sections in the sub-barrier domain for the 18O+12C system. Use the new experimental data to confront microscopic calculations of fusion.
- Method
-
Evaporation residues produced in fusion of 18O ions with 12C target nuclei were detected with good geometric efficiency and identified by measuring their energy and time-of-flight. Theoretical calculations with a density constrained time dependent Hartree-Fock (DC-TDHF) theory include for the first time the effect of pairing on the fusion cross-section.
- Results
-
Comparison of the measured fusion excitation function with the predictions of the DC-TDHF calculations reveal that the experimental data exhibits a smaller decrease in cross-section with decreasing energy than is theoretically predicted.
- Conclusion
-
The larger cross-sections observed at the lowest energies measured indicate a larger tunneling probability for the fusion process. This larger probability can be associated with a smaller, narrower fusion barrier than presently included in the theoretical calculations.
pacs:
21.60.Jz, 26.60.Gj, 25.60.Pj, 25.70.JjUnderstanding the origin of the elements, namely where and how they are formed, is one of the grand challenges in science NSA (2007). Independent of where they are formed whether in stellar interiors Penionzhkevich (2010); Carnelli et al. (2014) or on earth Zagrebaev et al. (2012); Back et al. (2014); Yanez et al. (2014), nucleosynthesis involves nuclear fusion. An accurate description of fusion is thus key to understanding nucleosynthesis. In recent years, fusion reactions have also been proposed to be important in exotic astrophysical environments, for example triggering X-ray superbursts that originate in the crust of an accreting neutron star Strohmayer and Bildsten (2006). The putative reactions involve fusion of neutron-rich light nuclei at sub-barrier energies Horowitz et al. (2008, 2009); Horowitz and Berry (2009). Initial measurements of fusion induced with neutron-rich light nuclei suggest an enhancement of the fusion probability as compared to standard models of fusion-evaporation Rudolph et al. (2012). At sub-barrier energies one is particularly sensitive to the microscopic degrees-of-freedom as the two nuclei collide, hence a microscopic treatment is the most relevant. For reactions at sub-barrier energies, the initial interpenetration of the matter distributions of the two nuclei is small but at the inner turning-point the nuclei have significant overlap. Consequently, a theoretical approach that can accurately describe the matter distributions at the outer and inner turning-points is desirable. The time-dependent Hartree-Fock (TDHF) theory provides a practical foundation for a fully microscopic theory of large amplitude collective motion and is thus well suited to study low-energy fusion reactions Negele (1982); Simenel (2012). Recent advances provide a more realistic treatment of tunneling through the use of microscopically obtained heavy-ion potentials Umar and Oberacker (2006a); Washiyama and Lacroix (2008). To test the accuracy of these microscopic calculations, high quality experimental data is needed. In the present work, we present a measurement of the total fusion cross-section for 18O + 12C that extends one order of magnitude lower in cross-section than previous measurements. We utilize this data to compare to the microscopic calculations of fusion.
To conduct the experiment, a beam of 18O ions with an intensity of 1.5-4105 p/s was accelerated to energies between Elab = 16.25 MeV and Elab = 36 MeV using the FN tandem at Florida State University’s John D. Fox accelerator center. The beam was pulsed at a frequency of 12.125 MHz. As the beam energy is critical to the accurate measurement of the fusion excitation function, the accuracy of the accelerator energy calibration was checked using known proton resonance energies and determined to be within 7 keV. After passing through a microchannel plate (MCP) detector approximately 1 m upstream of the target (US MCP), the beam was incident on a 93 g/cm2 thick 12C foil which served as the target (TGT MCP) as depicted in Fig. 1a. The 12C target foil also served as a secondary emission foil for a microchannel plate detector Steinbach et al. (2014) thus providing a timing signal for a time-of-flight (TOF) measurement. Measurement of the TOF between the two MCPs allows one to reject beam particles scattered or degraded prior to the target.
Earlier measurements of sub-barrier fusion for similar systems identified fusion events by measuring the -rays emitted by the fusion residues as they de-excited Cujec and Barnes (1976); Christensen et al. (1977). While this approach, of tagging fusion through -rays, allows the use of thick targets and high intensity beams, it suffers from the low efficiency inherent in -ray detection and any uncertainties in the knowledge of the relevant decay channels. We have therefore elected to directly measure the fusion residues in order to determine the fusion cross-section.
Reaction products were detected in the angular range 4.3∘ 11.0∘ using a segmented, annular silicon detector which provided both an energy and fast timing signal deSouza et al. (2011). Due to the kinematics of the reaction, the angular range subtended by this detector resulted in a high geometric efficiency for detection of fusion residues. Reaction products were distinguished on the basis of their energy and time-of-flight (ETOF) Steinbach et al. (2014). A typical ETOF spectrum measured is depicted in Fig. 1b where the energy corresponds to the energy deposited in the silicon detector while the time-of-flight is the time difference between the target MCP and the silicon detector.
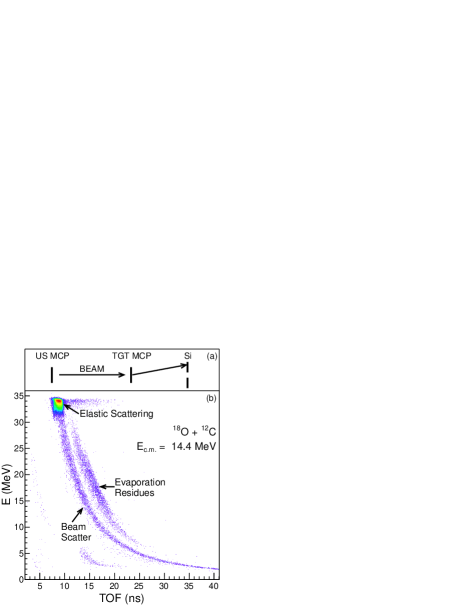
The most prominent feature in Fig. 1b is the peak at E 34 MeV that corresponds to elastically scattered particles. Originating from this peak is a locus of points with lower energies and longer TOF values. Points in this locus are scattered beam particles. Visible at larger TOF and clearly separated from the beam scatter line is an island of reaction products. This island is populated by evaporation residues that result from fusion of the projectile and target nuclei to form a compound nucleus which subsequently de-excites. Protons and alpha particles which are emitted during this de-excitation cascade of the compound nucleus manifest themselves in the spectrum with a characteristic energy time-of-flight relationship. Alpha particles are observed with energies between 10 MeV and 25 MeV and TOF values of approximately 5 ns. Protons are observed at deposited energies of E 6 MeV, consistent with the Si detector thickness, and TOF values of approximately 15 ns. The larger TOF values observed for protons as compared to the alpha particles is due to the slower risetime exhibited by protons and the leading edge discrimination employed. Also visible in the spectrum is a tail on the elastic peak which is constant in energy and extends to larger TOF values. This tail occurs with low probability (0.4) as compared to the elastic peak.
The measured evaporation residue cross-section was ascertained by using the measured number of beam particles incident on the target, the measured number of evaporation residues, and the known target thickness. The total number of beam particles incident on the target was determined by counting the coincidences between the MCP at the target position and the upstream MCP. The number of residues detected was established by selecting the appropriate region of the ETOF spectrum and summing the number of evaporation residues contained within it. The limits of the region of integration were established by calculating the TOF for different mass residues and using the beam scatter line as a reference. After accounting for the finite time resolution, an interval in mass number, 22 A 30 was used for measurements at Ec.m. 7.5 MeV and 24 A 30 for Ec.m. 7.5 MeV.
In order to determine the total fusion cross-section it is necessary to know the geometric efficiency of the experimental setup. The efficiency was determined by using a statistical model, evapOR Nicolis and Beene (1993), which simulates the decay of a compound nucleus using a Hauser-Feshbach approach. By calculating the fraction of the evaporation residues that lie within the detector acceptance, the geometric efficiency of the experimental setup is obtained. The bombarding energy dependent efficiency lies between 50 and 59. Using the efficiency together with the measured evaporation residue cross-section, the total fusion cross-section is extracted. Since the MCP efficiency affects both the counting of the total number of beam particles and the number of evaporation residues, it does not impact the measured total fusion cross-section.
The measured excitation function is displayed in Fig. 2 along with previously published results Eyal et al. (1976); Kovar et al. (1979); Heusch et al. (1982). As expected, the fusion cross-sections decrease with decreasing Ec.m. indicative of a barrier controlled phenomenon. It is noteworthy that even for the lowest energies measured an exponential decrease of the cross-section with decreasing energy is observed. Vertical error bars on the present data include both the statistical uncertainties as well as a 2 systematic error.
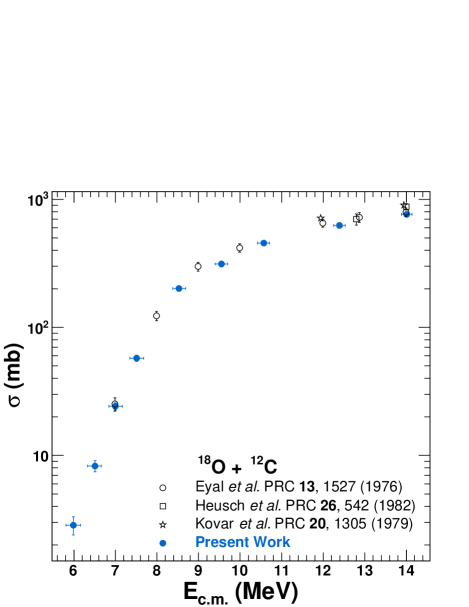
This systematic error is associated with the analysis. Horizontal error bars represent the uncertainty in whether the fusion occurs at the front or back of the target foil. Using the direct measurement of evaporation residues as done in the present experiment, previous measurements only measured the fusion cross-section down to the 25 mb level Eyal et al. (1976). In contrast, in the present work we measure the fusion cross-section down to the 2.8 mb level, close to a full order of magnitude lower in cross-section. At energies where the present dataset overlaps with existing data, overall agreement of the cross-sections is good, close to the statistical uncertainties of the prior measurements. This overall agreement not only indicates that our approach in extracting the fusion cross-section is sound but that there are no significant uncertainties in the values of the target thickness or detector efficiency. Closer comparison of the present dataset with the data of Ref. Eyal et al. (1976) indicates that the presently measured cross-sections are approximately 7 lower for Ec.m. 10 MeV. While the prior measurements required integration of an angular distribution measured with a low geometric efficiency detector, the present measurement directly measures a large fraction of the evaporation residue yield. We therefore believe that the present cross-sections are more accurate. It should be noted that the statistical quality of the present dataset is substantially better than that of the earlier measurements.
In recent years it has become possible to perform TDHF calculations on a 3D Cartesian grid thus not requiring any artificial symmetry restrictions and with much more accurate numerical methods Umar et al. (1991); Umar and Oberacker (2006b); Maruhn et al. (2014). In addition, the quality of the effective interactions has been substantially improved Reinhard et al. (1988); Umar et al. (1989); Chabanat et al. (1998); Klüpfel et al. (2009); Kortelainen et al. (2010). Over the past several years, the density constrained TDHF (DC-TDHF) method for calculating heavy-ion potentials Umar and Oberacker (2006a) has been employed to calculate heavy-ion fusion cross-sections with remarkable success Keser et al. (2012); Back et al. (2014). While most applications have been for systems involving heavy nuclei, recently the theory was used to study above and below barrier fusion cross-sections for lighter systems, specifically for reactions involving various isotopes of O+O and O+C Umar et al. (2012); deSouza et al. (2013) relevant for the reactions that occur in the neutron star crust. One general characteristic of TDHF and DC-TDHF calculations for light systems is that the fusion cross-section at energies well above the barrier are usually overestimated Simenel et al. (2013); Umar et al. (2014), whereas an excellent agreement is found for sub-barrier cross-sections Umar et al. (2012). This is believed to be due to various breakup channels in higher energy reactions of these lighter systems that are not properly accounted for in TDHF dynamics and contribute to fusion instead. Nevertheless, the agreement is remarkable given the fact that the only input in DC-TDHF is the Skyrme effective N-N interaction, and there are no adjustable parameters.
An unfortunate consequence of the TDHF approach, however, is the inability to treat pairing during the collision process. This shortcoming in the inclusion of pairing has led to the prediction of deformation of the ground state for some even-even nuclei such as 18,20O in disagreement with self-consistent mean field calculations that include pairing. To overcome this shortcoming, in prior work an average of all orientations of the deformed nucleus with respect to the target nucleus has been performed deSouza et al. (2013). It can be qualitatively argued that this averaging nonetheless results in a larger fusion cross-section as compared to the spherical nucleus.
In this work we report for the first time on the inclusion of pairing in the DC-TDHF calculations. This was achieved by performing a BCS pairing calculation for the static solution of 18O resulting in a spherical nucleus with a subsequent density constraint calculation to produce this density as a solution of the ordinary Hartree-Fock equations in the spirit of the density-functional theory. This nucleus with frozen occupations was then used in the TDHF time evolution. Subsequent density-constraint calculations in DC-TDHF method preserves this spherical shape during the entrance channel dynamics. As can be seen in Fig. 3a, inclusion of pairing in the DC-TDHF calculation for 18O + 12C results in a significant reduction of the fusion cross-section. The standard DC-TDHF calculations are presented as the dashed curve while the calculations that include pairing are depicted as the solid curve. At all energies, pairing acts to reduce the fusion cross-section. At the highest energies shown pairing reduces the cross-section to 80 of the value calculated without pairing. This difference between the calculations with and without pairing increases dramatically as the incident energy decreases. At the lowest energies shown the introduction of pairing in the calculation reduces the cross-section to 36 of the cross-section calculated without pairing.
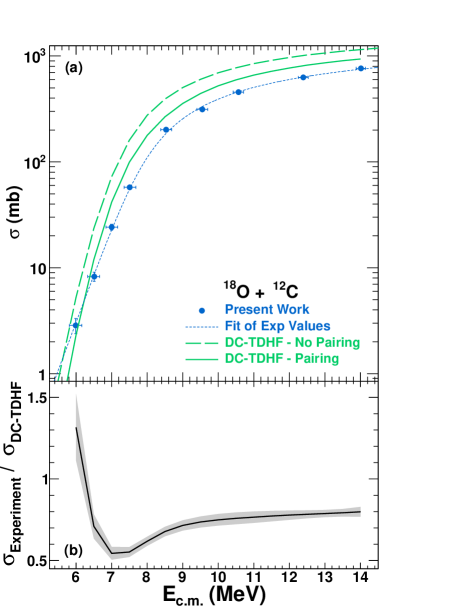
Comparison of the experimental fusion excitation function with the DC-TDHF microscopic calculations is presented in Fig. 3a. The presently measured fusion cross-sections, previously shown in Fig. 2, are indicated as solid symbols. Overall comparison of the experimental cross-sections with the DC-TDHF calculations indicate that the experimental cross-sections are lower than the theoretical predictions. In order to facilitate a quantitative comparison of the experimental excitation function with the theoretical predictions, we have fit the experimental cross-sections with a functional form Wong (1973) that describes the penetration of an inverted parabolic barrier:
| (1) |
where is the radius of the fusion barrier, is the height of the interaction barrier, is the frequency, and is the incident energy. The best fit achieved using this functional form is shown as the dotted line in Fig. 3a and has values of = 7.24 0.16 fm, = 7.62 0.14 MeV, and = 2.78 0.29 MeV, remarkably the calculated DC-TDHF barrier also has a barrier height of 7.60 MeV. Shown in Fig. 3b is the ratio of the fit of the experimentally measured cross-sections to the DC-TDHF calculations with pairing. For energies Ec.m. 9 MeV, the ratio / is 0.75 and decreases weakly with decreasing energy. A stronger decrease in the ratio is observed as the energy decreases from Ec.m. = 9 MeV to Ec.m. = 7 MeV. At this energy, the ratio is minimum with a value of 0.54. As the incident energy decreases further, the ratio increases reaching a value of 1.32 at the lowest energy measured, Ec.m. 6 MeV. The presence of breakup reactions at energies above the barrier could explain the fact that the ratio is less than unity in this energy range. With decreasing incident energy, the role of breakup reactions diminishes hence the ability of the DC-TDHF method to describe fusion is expected to improve. We therefore focus our attention on the comparison of the model and experiment in the sub-barrier region. The key feature in the ratio is therefore its change with decreasing incident energy in the sub-barrier domain, specifically its increase from a value smaller than unity to a value larger than unity. This trend emphasizes that the experimental and theoretical excitation functions have different shapes with the experimental cross-section falling more slowly with decreasing incident energy than is theoretically predicted by the DC-TDHF method. This enhancement of the experimental fusion cross-sections relative to the DC-TDHF predictions is a factor of 2.4 as the incident energy decreases from Ec.m. = 7 MeV to Ec.m. = 6 MeV. We have assessed the impact of the experimental uncertainties on the ratio presented and display the result as a shaded band in Fig. 3b. It is clearly evident that the trends exhibited by the ratio are significantly larger than the magnitude of the uncertainties.
The fact that the sub-barrier experimental fusion cross-sections decrease more slowly with decreasing energy than the calculated cross-sections can be interpreted as a larger tunneling probability for the experimental data as compared to the theoretical calculations. This enhanced tunneling probability can be associated with a narrower barrier, which deviates from an inverted parabolic shape. The fundamental reason that the barrier determined from the experimental data is weaker than in the theory is presently unclear. It should also be recalled that within the DC-TDHF calculations, inclusion of pairing decreased the predicted cross-sections. It was assumed that the initial occupation numbers calculated with pairing were frozen as the reaction dynamics proceeded. It can be argued that relaxing this stringent condition would result in larger cross-sections. Unfortunately, microscopic calculations which allow the pairing to evolve in response to changes in the shape of the nuclear system as the fusion proceeds are beyond the scope of the present work. Such calculations would provide a more realistic treatment of the impact of pairing on fusion. It is noteworthy that the previous experimental data Eyal et al. (1976) only extended down to Ec.m. = 7 MeV. The dramatic increase in cross-section relative to the DC-TDHF method occurs at energies below Ec.m. = 7 MeV. This enhancement of the fusion cross-section in the sub-barrier domain demonstrates the importance of measuring the sub-barrier fusion cross-section for light, heavy-ion reactions. This sub-barrier cross-section enhancement could yield new insight into the fusion dynamics of neutron-rich light nuclei.
We wish to acknowledge the support of the staff at Florida State University’s John D. Fox accelerator in providing the high quality beam that made this experiment possible. This work was supported by the U.S. Department of Energy under Grant No. DE-FG02-88ER-40404 (Indiana University) and Grant No. DE-FG02-96ER40975 (Vanderbilt University) and the National Science Foundation under Grant No. PHY-1064819 (Florida State University).
References
- NSA (2007) 2007 NSAC Long Range Plan: The Frontiers of Nuclear Science (2007).
- Penionzhkevich (2010) Y. Penionzhkevich, Physics of Atomic Nuclei 73, 1460 (2010).
- Carnelli et al. (2014) P. F. F. Carnelli et al., Phys. Rev. Lett. 112, 192701 (2014).
- Zagrebaev et al. (2012) V. I. Zagrebaev, A. V. Karpov, and W. Greiner, Phys. Rev. C. 85, 014608 (2012).
- Back et al. (2014) B. B. Back, H. Esbensen, C. L. Jiang, and K. E. Rehm, Rev. Mod. Phys. 86, 317 (2014).
- Yanez et al. (2014) R. Yanez et al., Phys. Rev. Lett. 112, 152702 (2014).
- Strohmayer and Bildsten (2006) T. Strohmayer and L. Bildsten, Compact X-ray Stellar Sources (Cambridge University, 2006) p. 113.
- Horowitz et al. (2008) C. J. Horowitz, H. Dussan, and D. K. Berry, Phys. Rev. C 77, 045807 (2008).
- Horowitz et al. (2009) C. J. Horowitz, O. L. Caballero, and D. K. Berry, Phys. Rev. E 79, 026103 (2009).
- Horowitz and Berry (2009) C. J. Horowitz and D. K. Berry, Phys. Rev. C 79, 065803 (2009).
- Rudolph et al. (2012) M. J. Rudolph et al., Phys. Rev. C 85, 024605 (2012).
- Negele (1982) J. W. Negele, Rev. Mod. Phys 54, 913 (1982).
- Simenel (2012) C. Simenel, Eur. Phy. J. A 48, 152 (2012).
- Umar and Oberacker (2006a) A. S. Umar and V. E. Oberacker, Phys. Rev. C 74, 021601(R) (2006a).
- Washiyama and Lacroix (2008) K. Washiyama and D. Lacroix, Phys. Rev. C 78, 024610 (2008).
- Steinbach et al. (2014) T. K. Steinbach et al., Nucl. Instr. and Meth. A743, 5 (2014).
- Cujec and Barnes (1976) B. Cujec and C. A. Barnes, Nucl. Phys. A 266, 461 (1976).
- Christensen et al. (1977) P. R. Christensen, Z. E. SwitkowskiW, and R. A. Dayras, Nucl. Phys. A 280, 189 (1977).
- deSouza et al. (2011) R. T. deSouza et al., Nucl. Instr. and Meth. A632, 133 (2011).
- Nicolis and Beene (1993) N. G. Nicolis and J. R. Beene, unpublished (1993).
- Eyal et al. (1976) Y. Eyal, M. Beckerman, R. Chechik, Z. Fraenkel, and H. Stocker, Phys. Rev. C 13, 1527 (1976).
- Kovar et al. (1979) D. G. Kovar, D. F. Geesaman, T. H. Braid, Y. Eisen, W. Henning, T. R. Ophel, M. Paul, K. E. Rehm, S. J. Sanders, P. Sperr, J. P. Schiffer, S. L. Tabor, S. Vigdor, B. Zeidman, and F. W. Prosser, Jr., Phys. Rev. C 20, 1305 (1979).
- Heusch et al. (1982) B. Heusch, C. Beck, J. P. Coffin, P. Engelstein, R. M. Freeman, G. Guillaume, F. Haas, and P. Wagner, Phys. Rev. C 26, 542 (1982).
- Umar et al. (1991) A. S. Umar, M. R. Strayer, J. S. Wu, D. J. Dean, and M. C. Güçlü, Phys. Rev. C 44, 2512 (1991).
- Umar and Oberacker (2006b) A. S. Umar and V. E. Oberacker, Phys. Rev. C 73, 054607 (2006b).
- Maruhn et al. (2014) J. A. Maruhn, P.-G. Reinhard, P. D. Stevenson, and A. S. Umar, Comp. Phys. Comm. 185, 2195 (2014).
- Reinhard et al. (1988) P.-G. Reinhard, A. S. Umar, K. T. R. Davies, M. R. Strayer, and S.-J. Lee, Phys. Rev. C 37, 1026 (1988).
- Umar et al. (1989) A. S. Umar, M. R. Strayer, P.-G. Reinhard, K. T. R. Davies, and S.-J. Lee, Phys. Rev. C 40, 706 (1989).
- Chabanat et al. (1998) E. Chabanat, P. Bonche, P. Haensel, J. Meyer, and R. Schaeffer, Nucl. Phys. A 635, 231 (1998).
- Klüpfel et al. (2009) P. Klüpfel, P.-G. Reinhard, T. J. Bürvenich, and J. A. Maruhn, Phys. Rev. C 79, 034310 (2009).
- Kortelainen et al. (2010) M. Kortelainen, T. Lesinski, J. Moré, W. Nazarewicz, J. Sarich, N. Schunck, M. V. Stoitsov, and S. Wild, Phys. Rev. C 82, 024313 (2010).
- Keser et al. (2012) R. Keser, A. S. Umar, and V. E. Oberacker, Phys. Rev. C 85, 044606 (2012).
- Umar et al. (2012) A. S. Umar, V. E. Oberacker, and C. J. Horowitz, Phys. Rev. C 85, 055801 (2012).
- deSouza et al. (2013) R. T. deSouza, S. Hudan, V. E. Oberacker, and A. S. Umar, Phys. Rev. C 88, 014602 (2013).
- Simenel et al. (2013) C. Simenel, R. Keser, A. S. Umar, and V. E. Oberacker, Phys. Rev. C 88, 024617 (2013).
- Umar et al. (2014) A. S. Umar, C. Simenel, and V. E. Oberacker, Phys. Rev. C 89, 034611 (2014).
- Wong (1973) C. Y. Wong, Phys. Rev. Lett. 31, 766 (1973).