MUSE sneaks a peek at extreme ram-pressure stripping events. I. A kinematic study of the archetypal galaxy ESO137001.
Abstract
We present MUSE observations of ESO137001, a spiral galaxy infalling towards the center of the massive Norma cluster at . During the high-velocity encounter of ESO137001 with the intracluster medium, a dramatic ram-pressure stripping event gives rise to an extended gaseous tail, traced by our MUSE observations to kpc from the galaxy center. By studying the H surface brightness and kinematics in tandem with the stellar velocity field, we conclude that ram pressure has completely removed the interstellar medium from the outer disk, while the primary tail is still fed by gas from the inner regions. Gravitational interactions do not appear to be a primary mechanism for gas removal. The stripped gas retains the imprint of the disk rotational velocity to kpc downstream, without a significant gradient along the tail, which suggests that ESO137001 is fast moving along a radial orbit in the plane of the sky. Conversely, beyond kpc, a greater degree of turbulence is seen, with velocity dispersion up to . For a model-dependent infall velocity of , we conclude that the transition from laminar to turbulent flow in the tail occurs on timescales Myr. Our work demonstrates the terrific potential of MUSE for detailed studies of how ram-pressure stripping operates on small scales, providing a deep understanding of how galaxies interact with the dense plasma of the cluster environment.
keywords:
hydrodynamics – turbulence – techniques: spectroscopic – galaxies: ISM – galaxies: clusters: individual: ESO137-001 – galaxies: kinematics and dynamics1 Introduction
The discovery of a well-defined color bimodality in galaxy populations at redshifts is arguably one of the most significant legacies of galaxy surveys. Extensive discussion on the color properties in large samples of galaxies can be found in the literature (e.g. Bower et al., 1992; Strateva et al., 2001; Baldry et al., 2004; Bell et al., 2004; Weiner et al., 2005; Brammer et al., 2009). A major task for modern studies of galaxy formation is therefore to understand how and when internal processes and environment drive the evolution of galaxies from the blue to the red cloud. While internal mechanisms, including ejective feedback from supernovae or active galactic nuclei, are deemed responsible for suppressing and quenching star formation at all densities, environmental processes in the form of tidal interactions, harassment, and ram-pressure or viscous stripping are key players in shaping the observed color bimodality within rich galaxy clusters, especially at the faint end of the galaxy luminosity function. The origin and effects of these processes have been the subject of scrutiny of many studies and review articles (e.g. Larson et al., 1980; Hashimoto et al., 1998; Lewis et al., 2002; Gavazzi et al., 2002; Kauffmann et al., 2004; Balogh et al., 2004; Boselli & Gavazzi, 2006; Boselli et al., 2008; Gavazzi et al., 2010; Smith et al., 2012a; Dressler et al., 2013).
The smoking gun of ongoing environmental transformation in nearby clusters is the disturbed gas content of member galaxies. Globally, radio surveys at 21 cm reveal that spiral galaxies in rich environments are deficient of gas compared to matched samples at lower densities (e.g. Haynes et al., 1984; Giovanelli & Haynes, 1985). A deficiency of molecular gas has also been reported (Fumagalli et al., 2009; Boselli et al., 2014). More significantly, these gas-deficient galaxies, and particularly those residing near the cluster cores, often exhibit truncated and disturbed gas disks (e.g. Vollmer et al., 2008; Chung et al., 2009) or, in some cases, one-sided tails (e.g. Chung et al., 2007). Furthermore, extreme cases of disturbance are seen in “head-tail” radio continuum emission or in prominent H and UV tails arising from galaxies moving towards the centers of massive clusters, such as Coma, Virgo, and A1367 (e.g. Gavazzi & Jaffe, 1985; Gavazzi et al., 2001; Yoshida et al., 2002; Cortese et al., 2006; Kenney et al., 2008; Smith et al., 2010; Yagi et al., 2010; Fossati et al., 2012).
Detailed multiwavelength studies of these archetypal galaxies which are undergoing extreme gravitational and hydrodynamic transformations in the harsh cluster environment become an invaluable tool for unveiling the rich physics responsible for the morphological and color transformation of cluster galaxies. Many examples of these peculiar objects have been reported in the recent literature (e.g. Vollmer et al., 2004; Sun et al., 2006; Fumagalli & Gavazzi, 2008; Hester et al., 2010; Fumagalli et al., 2011; Arrigoni Battaia et al., 2012; Fossati et al., 2012; Kenney et al., 2014; Ebeling et al., 2014). In synergy with models and numerical simulations (e.g. Gunn & Gott, 1972; Nulsen, 1982; Moore et al., 1996; Quilis et al., 2000; Schulz & Struck, 2001; Vollmer et al., 2001a; Bekki & Couch, 2003; Kronberger et al., 2008; Tonnesen & Bryan, 2010; Ruszkowski et al., 2014), these peculiar systems are in fact ideal laboratories to constrain the efficiency with which gas can be removed, quenching star formation. Extrapolated to the more general cluster population, results from these studies offer a unique perspective for how the red sequence is assembled in dense environments.
A particularly stunning example of a galaxy which is undergoing environmental transformation is ESO137001, member of the massive Norma cluster. The Norma cluster, also known as A3627, has a dynamical mass of M⊙ and lies in the Great Attractor region at a radial velocity of , or redshift (Woudt et al., 2008; Nishino et al., 2012). ESO137001 is located at a projected distance of only from the central cluster galaxy WKK6269, corresponding to kpc for the adopted cosmology ( and for which kpc; Hinshaw et al., 2013). Observations across the entire electromagnetic spectrum, including X-ray, optical, infrared, and millimetric data (Sun et al., 2006, 2007, 2010; Sivanandam et al., 2010; Jachym et al., 2014), show that ESO137001 is suffering from an extreme ram-pressure stripping event during its first approach to the center of A3627. Most notably, ESO137001 exhibits a double tail which extend for kpc as seen in X-ray, pointing in the opposite direction from the cluster center (Sun et al., 2006, 2010). This tail, which is also detected in H (Sun et al., 2007) and contains both cold and warm molecular gas (Sivanandam et al., 2010; Jachym et al., 2014), is thought to originate from the interaction between the hot intracluster medium (ICM) and the warm/cold interstellar medium (ISM) which is being ablated from the stellar disk by ram pressure (e.g. Sun et al., 2010; Jachym et al., 2014).
A complete picture of how ram pressure operates in this galaxy and how the cold, warm, and hot gas phases coexist and interact inside the extended tail requires a detailed knowledge of the gas kinematics and of emission-line ratios. To date, these diagnostics have been limited to pointed radio observations (Jachym et al., 2014) or spectroscopy of selected HII regions (Sun et al., 2007, 2010). To dramatically improve the status of current observations, we exploit the unprecedented capabilities the Multi Unit Spectroscopic Explorer (MUSE; Bacon et al., 2010) at the UT4 Very Large Telescope. With its unique combination of high efficiency ( at 6800 Å), extended wavelength coverage (Å sampled at Å), and large field of view ( in Wide Field Mode, sampled with pixels), MUSE is a unique instrument to map at optical wavelengths the kinematics and line ratios of the disk and tail of ESO137001. In this paper, we present MUSE observations of ESO137001 which were conducted as part of the science verification run. After discussing the data reduction (Sect. 2) and the data analysis technique (Sect. 3), we present a study of the kinematics of the H emitting gas and of the stellar disk of ESO137001 (Sect. 4). A subsequent paper in this series (Fossati et al., in prep.) will analyze emission and absorption line ratios to characterize the physical properties of the emitting gas and of the stellar populations in the disk and tail of ESO137001.
2 Observations and data reduction
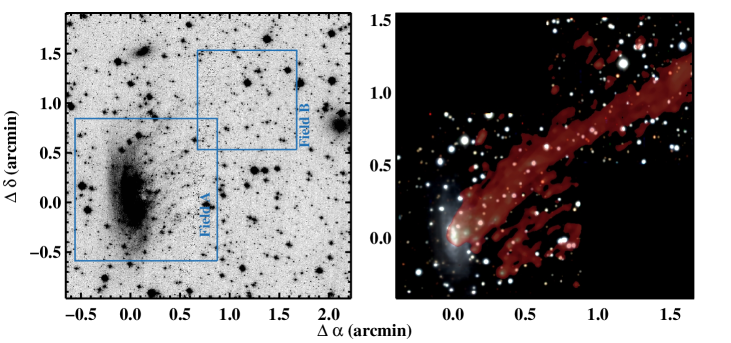
ESO137001 was observed with MUSE during the science verification run on UT June 21, 2014, under program 60.A-9349(A) (PI Fumagalli, Hau, Slezak). Observations were conducted while the galaxy was transiting at airmass , in photometric conditions and good seeing (). The disk and the inner tail of ESO137001 (“Field A” in Figure 1) were observed with three exposures of 900s each, with dithers of and a rotation of 90 degrees in the instrument position angle at each position. A single 900s exposure (“Field B” in Figure 1) was then acquired to cover the extent of the primary tail. Natural seeing mode and slow guiding mode were used.
The final data product is obtained using a combination of recipes from the early-release MUSE pipeline (v0.18.1) and a set of in-house IDL codes, which we have developed to improve the quality of the illumination, sky subtraction, and flux calibration of the MUSE data specifically for the problem at hand. First, using the MUSE pipeline, we construct for each IFU a master bias, a master flat field, and a master sky flat, together with a wavelength solution. Next, we apply these calibrations to each science exposure and to exposures of the standard star GD153, which was observed for 30s at the beginning of the night in photometric conditions. After computing the instrument response curve for flux calibration and the telluric correction spectrum within the MUSE pipeline, we apply a smoothing kernel of 80 pixel to the obtained sensitivity function so as to remove residual small-scale fluctuations in the instrument response, which are present in the current version of the MUSE pipeline. The quality of photometric calibration is confirmed by aperture photometry on the -band image reconstructed from the final datacube, which is in excellent agreement with -band magnitudes in APASS, the AAVSO All-Sky Photometric Survey (Henden et al., 2012).
Using the MUSE pipeline, we then produce resampled datacubes for each exposure (in spaxels of 1.25Å and ), also saving individual calibrated pixel tables which contain the data and variance pixels before interpolation. Cosmic rays are also identified as 7 outliers. At this stage, the MUSE pipeline could be used to compute the sky subtraction with the algorithm offered by the pipeline recipes. However, when sky subtraction is enabled, the reconstructed cube exhibits an evident variation in the illumination of each slice which, as noted in the pipeline manual, is currently not fully corrected by sky flats. Due to this variation, and perhaps to the particularly crowded nature of our field, the sky-subtracted cubes exhibit large negative residuals which would affect our subsequent analysis. To improve the data quality, we perform both an illumination correction and sky subtraction, using a set of IDL procedures which we have specifically developed to handle the reduced MUSE pixel tables. First, the illumination correction is computed by fitting eight bright sky lines in all slices within each exposure and by normalizing them to the median flux distribution across the entire field of view. After applying this illumination correction, we then generate a sky model in each exposure by combining pixels of comparable wavelength and within the 20-30th flux percentiles in a master sky spectrum. This operation is performed on the pixel table, to improve the spectral sampling of the sky model. We then subtract the sky model from each pixel, by interpolating the master sky spectrum with a spline function. Following these procedures, we find that the newly reconstructed datacubes present a more uniform illumination pattern and do not have evident residuals in the background level. As a further test of our procedure, we verify that the line flux from extragalactic sources in the sky-subtracted cubes and the non-sky subtracted cubes agree to within the typical flux standard deviation (see below). At each step, our IDL procedures propagate errors in the datacube which contains the pixel variance (also known as “stat” datacube).
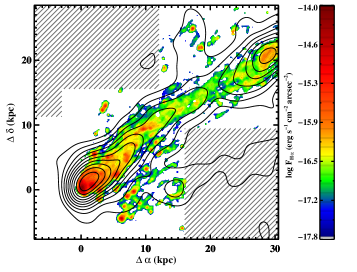
At the end of the reduction, we combine the four exposures and we reconstruct the final datacube inside the MUSE pipeline, after having registered the astrometry to the available HST imaging with in-house IDL codes to achieve a sub-arcsecond precision in both the absolute and relative astrometry. Data are interpolated over a regular grid of spatially and Å spectrally. Finally, we apply the heliocentric correction to the wavelengths computed in air by the pipeline. An RGB color image produced by combining three slices of 1000Å from the final MUSE datacube is shown in Figure 1. In this figure, we also superimpose a map of the H flux, obtained as described in the next section.
The final datacube has an excellent image quality, with full width at half maximum (FWHM) of for point sources in the field. We also characterize the noise properties by measuring in each spatial pixel the standard deviation of fluxes in the wavelength interval Å, which is clean of bright sky line residuals. The mean surface brightness limit at confidence level is erg s-1 cm-2 Å-1 arcsec-2 for Field A and erg s-1 cm-2 Å-1 arcsec-2 for Field B. Noise properties are uniform across the field, with a spatial variation expressed in unit of standard deviation about the mean of erg s-1 cm-2 Å-1 arcsec-2 for Field A and erg s-1 cm-2 Å-1 arcsec-2 for Field B. For an unresolved line of Å at Å, the line surface brightness limit becomes erg s-1 cm-2 arcsec-2 for Field A and erg s-1 cm-2 arcsec-2 for Field B.
3 Emission and absorption line modeling
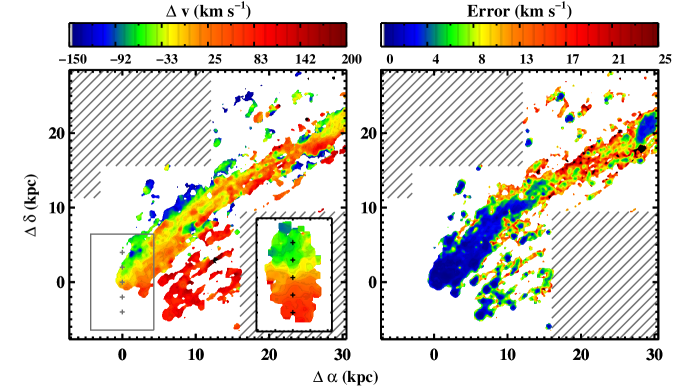
To characterize the kinematics of the gas in the disk and tail, and the galaxy stellar rotation, we extract maps of the zeroth, first and second moment of the H () line, together with a map of the first moment of the \textCa ii triplet (), as detailed below. Throughout this analysis, for consistency with previous work (Sun et al., 2010; Jachym et al., 2014), we assume a systemic heliocentric velocity of for ESO137001, equivalent to redshift .
3.1 Emission lines
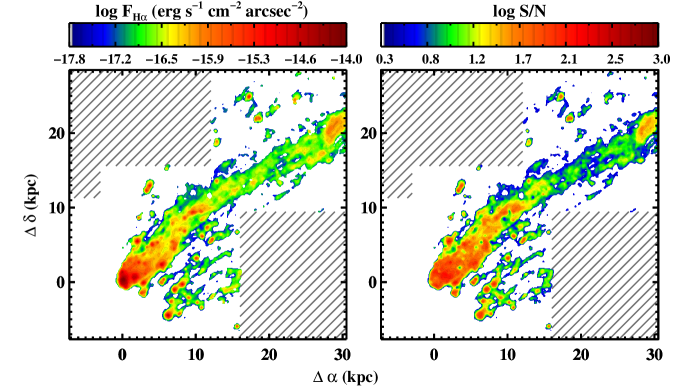
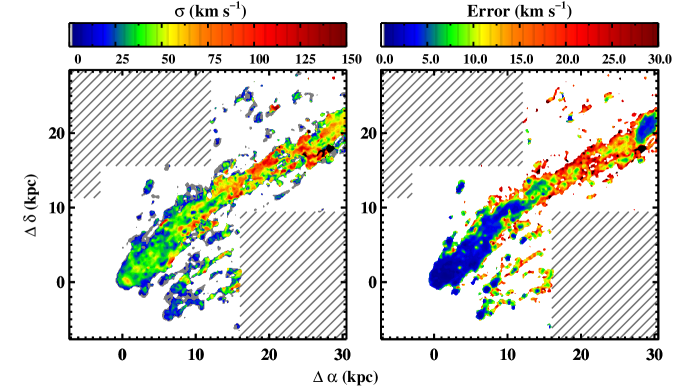
Maps of the H line flux (Figure 2), radial velocity relative to systemic (Figure 3), and of the velocity dispersion (Figure 4) are obtained from the final datacube using the IDL custom code kubeviz. With kubeviz, we fit a combination of 1D Gaussian functions to the H and [NII] lines, keeping the relative velocity separation and the flux ratio of the two [NII] lines constant. While measuring the intrinsic line width , we also fix the instrumental line width at each wavelength using an interpolation function constructed with a third degree polynomial fit to the resolution curve in the MUSE manual. At the observed wavelength of H computed for the systemic redshift of ESO137001 (Å), we find or , in agreement with the resolution measured from skylines within a resampled datacube before sky subtraction. The spatial variation of the spectral resolution is found to be negligible for emission lines with an intrinsic width of .
Before the fit, the datacube is median filtered in the spatial direction with a kernel of pixels to increase the individual per pixel. No spectral smoothing is performed. In each spectrum, the continuum is then evaluated inside two symmetric windows around the H-[NII] line complex. Only values between the 40th and 60th percentile are modeled with a linear polynomial to estimate the continuum under each line. The Gaussian fit is performed on all the continuum-subtracted spaxels, assigning a minimum value of to spectrally unresolved emission lines. During the fit, kubeviz takes into account the noise from the “stat” datacube, thus optimally suppressing skyline residuals. However, the adopted variance underestimates the real error, most notably because it does not account for correlated noise. We therefore renormalize the final errors on the fitted parameters so as to obtain a reduced . In the subsequent analysis, we mask spaxels where the of the H flux is on the filtered data. Further masking is applied to the spaxels for which the line centroids or the line widths are extreme outliers compared to the median value of their distributions, or the errors on these quantities exceeds 50 (i.e. conditions indicative of a non-converged fit). Throughout this analysis, the H flux has been corrected to account for appreciable Galactic extinction towards the Galactic plane (; Sun et al., 2007), but not for internal extinction. However, our conclusions primarily rely on kinematics that are not severely affected by the presence of internal dust.
As a consistency check on the velocity measurements, we also model the [SII] doublet following the same procedure. The derived velocities from H and [SII] are found to be in excellent agreement, to better than 1 on average over the entire cube. The difference in the two reconstructed velocity maps is for all regions where [SII] is detected at , and where . A similar agreement is found when comparing the two measurements of velocity dispersion. In the following, we will only present and analyze the velocity field measured via H emission, the strongest transition, which we use as tracer for the bulk of the ionized hydrogen. A detailed analysis the properties of [SII] and other emission lines will be presented in the second paper of this series. We also note that, given the tracer used in our study, we will focus on the ram-pressure stripping of warm disk gas, which differ from strangulation, the stripping of the hot gas in the halo.
As a final check, we compare the fluxes of HII regions in our data with the values reported by Sun et al. (2007) in their table 1. We focus on three isolated regions (ID 2, 3, and 7 in figure 1 of Sun et al., 2007), for which we find a flux difference of 1%, 3%, and 6%, respectively. This test confirms the excellent agreement in the flux calibrations of the two data sets.
3.2 Absorption lines
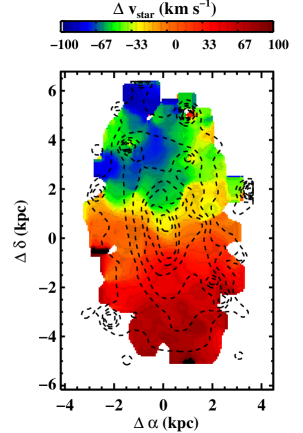
Following a similar procedure to the one adopted for modeling emission lines, we extract the rotation curve of the stellar disk of ESO137001 by fitting Gaussian functions to the \textCa ii triplet. Specifically, we apply to the datacube a median filter of pixels in the spatial direction, with no filtering in the spectral direction. We then identify stars on the continuum-subtracted image in the rest-frame wavelength range Å, which we masks with circular regions of . The velocity relative to systemic is then found by fitting all the spaxels which have per spaxels as measured on the filtered continuum image, using Gaussian functions with initial guesses at the rest-frame wavelengths of the \textCa ii triplet lines. We find that the best result is achieved by fitting only the strongest line, a choice which reduces the noise introduced by poorly converged fits on the weaker transitions at the lowest . A map of the reconstructed velocity field is in Figure 5.
The use of Gaussian functions, although rather simple, is preferred to full template fitting when handling spaxels in order to reduce the run time of the analysis by orders of magnitude. Nevertheless, we have conducted extensive tests comparing results from Gaussian fits to results from full template fitting on a coarsely binned datacube, so as to verify that our method yields accurate centroids. For this test, we rebin the data using the Voronoi tessellation method with the code developed by Cappellari & Copin (2003). The binning procedure is performed on a continuum image in the rest-frame wavelength range Å, requiring a final in the re-binned regions of . Galactic stars are again identified and masked. We then fit to the optimally-combined spectra in each Voronoi cell templates from Cenarro et al. (2001), using the Penalized Pixel-Fitting method (pPXF) developed by Cappellari & Emsellem (2004). During the fitting procedure, we assume an instrumental line width at relevant wavelengths of , computed as described in the previous section. Next, we apply our Gaussian fitting technique to the same binned spectra. When comparing these two independent measurements, we find a narrow Gaussian distribution, centered at and with standard deviation of , value which we assume as the typical uncertainty on the velocity measurement over the entire datacube. As for the case of emission lines, higher signal-to-noise regions are most likely affected by smaller uncertainties. Furthermore, the 2D velocity field measured in the coarser Voronoi cells is in excellent agreement with the higher-resolution map recovered with Gaussian fits, confirming the robustness of the measurement presented in Figure 5.
4 Discussion
Compared to traditional narrow band imaging in Å wide filters, MUSE enables us to extract from the datacube flux maps in very narrow wavelength windows (Å), in which we optimally weight the signal from emission lines over the background sky noise. In addition, by fitting emission lines in each spatial pixel, we can more precisely recover the line flux also in the presence of bright unrelated sources, such as foreground stars, if the Poisson noise introduced by these sources does not outweigh the signal. These key advantages, combined with the large VLT aperture, allow us to reconstruct a map of the H emission in the disk and tail of ESO137001 which is one order of magnitude deeper than previous observations (Sun et al., 2007), down to surface brightness limits of erg s-1 cm-2 arcsec-2 (see Figure 2).
At this depth, our observations reveal that the H tail extends continuously for more than 30 kpc, with surface brightness erg s-1 cm-2 arcsec-2. Figure 6 also shows that the H emission is co-spatial in projection with the primary X-ray tail. At the west edge of our field of view (), one can see a significant surface brightness enhancement, which is known to harbor M⊙ of molecular gas (Jachym et al., 2014) and it is coincident with an X-ray bright region within the primary tail (Sun et al., 2010). On both sides of this primary tail, both towards north and south, we also detect a group of compact sources, some of which were previously identified as HII regions in spectroscopic observations by Sun et al. (2007) and Sun et al. (2010).
At the superior depth of our observations, the southern clump complex () appears to be embedded in a lower surface brightness component, similar to the diffuse emission of the primary tail, stretching with the same projected orientation in the plane of the sky, with a position angle of approximately . This second H tail is co-aligned with the secondary X-ray tail visible in the Chandra map, suggesting a common origin of the two gas phases, which possibly originate from material that has been stripped from the southern part of the galaxy. Unfortunately, our observations do not cover the full extent of this secondary tail, as visible for instance in figure 2 of Sun et al. (2010). Additional observations in the south-west will thus be critical for a detailed investigation of the properties of the secondary tail. Near the disk, embedded within the H emission of this secondary tail, there are few bright H knots, which Sun et al. (2010) identified as HII regions. In contrast to the more diffuse emission, these bright HII regions (and in particular the southernmost clump) do not appear to be tightly correlated with the X-ray flux, hinting to a different physical origin of the emission in compact regions compared to the diffuse emission in the tails.
Our observations, in agreement with previous studies, point to ram-pressure stripping as the primary mechanism of gas removal. Indeed, we note how the stellar velocity field in Figure 5 exhibits an ordered velocity gradient along the major axis, as expected for a nearly edge-on rotating disk. Compared to the isophotes measured on an image extracted from the datacube in the wavelength range Å, the measured velocity field appears to be symmetric relative to the major axis and it is also well-centered at the optical location of ESO137001. This ordered motion and an extremely disturbed morphology of the ISM compared to unperturbed isophotes support the conclusion of earlier studies that ram-pressure stripping is responsible for the gas ablation. Indeed, ram-pressure stripping produces only subtle transformations in the stellar disks (e.g. Smith et al., 2012b), which largely retain memory of the original morphology and kinematics (e.g. Boselli et al., 2008; Toloba et al., 2011). One may however argue that the velocity map in Figure 5 suggests the presence of small perturbations in the velocity field in the northern part of the stellar disk. However, we are more cautious in interpreting these features that are detected only in regions of low surface brightness and in proximity to two bright foreground stars, which may contaminate our measurement of the velocity fields at these locations.
Our observations, combined with the available HST imaging (see Figure 1), support a picture in which the galaxy suffered from ram pressure in the disk outskirts in the past, and it is still being ablated of its gas from the innermost regions. Through models in which the efficiency of ram-pressure stripping depends on both gas density and galactocentric radius, as shown for example in figure 8 by Jachym et al. (2014), we can establish a correspondence between the spatial location of the H emitting gas and the time at which this gas was stripped. Moreover, lower density material in the less-bound outskirts of ESO137001 is stripped more easily at earlier times. This means that material originating from the disk outskirts traces a more rapid stripping process which will come to an end before the stripping from the nucleus.
Our map shows that the H bright knots that are offset from the primary tail are being stripped from the northern and southern parts of the disk, respectively. At these large galactocentric radii, there is no evidence of H emitting gas inside the stellar disk of ESO137001 to our sensitivity limit. Thus, ram pressure has already cleared the galaxy ISM in these less-bound regions. Conversely, the galaxy ISM is still present in the inner kpc of ESO137001 (see also Jachym et al., 2014), and this material is still being stripped, feeding the primary tail. We therefore conclude that the primary tail originates from the inner regions of ESO137001 and not from the northern trailing arm, as suggested by the earlier analysis of H narrow-band imaging (Sun et al., 2010). This outside-in stripping process offers a natural explanation for the different morphology of the primary H tail compared to the two complexes of H bright clumps in the north and south direction. We speculate that the diffuse gas from the outer disk was removed in the past and it has already mixed with the hot ambient medium downstream. As a consequence, we are now witnessing only the last episode of stripping of the densest clumps of gas, which trace the location of the older secondary tails. This is also a plausible explanation for why the primary H tail is narrow compared to the optical disk (Sun et al., 2010). Originally, there may have been a single tail, fed by material stripped at all galactocentric radii, differently than what we see today. A qualitative picture for how an inside-out stripping affects the morphology of the tail can be seen, for instance, in the right panels of figure 1 in Quilis et al. (2000).
The analysis of the gas and stellar kinematics offers additional insight into how ram-pressure stripping occurs in ESO137001 and how this galaxy moves as it approaches the center of the cluster. The H map shows that ESO137001 is moving towards the center the Norma cluster on a projected orbit with position angle of . The gas radial velocity, as traced by H (Figure 3), reveals no evident gradient along the primary tail, implying that the motion occurs in the plane of the sky. Conversely, a clear velocity gradient is seen in the direction parallel to the galaxy major axis, perpendicular to the tail. This velocity pattern was already observed by Sun et al. (2010) who studied selected HII regions with Gemini/GMOS spectroscopy. The unprecedented quality of the MUSE datacube, however, dramatically improves the fidelity with which the gas kinematics of ESO137001 is traced, also within the diffuse component. Our observations confirm that ESO137001 is approaching the cluster center on a nearly-radial orbit, with no significant tangential velocity component. The stripped gas retains a remarkable degree of coherence in velocity to kpc downstream, which is originally imprinted by the rotation curve of the stellar disk. The map of the stellar kinematics (Figure 5) shows a clear rotational signature in the plane of the sky, with peak to peak velocity of in projection out to radii of kpc. These values can be compared to the rotational velocity of , which Jachym et al. (2014) infer from the band luminosity. Radial velocities in the range are visible in the stripped gas primarily in the southern secondary tail, which in our picture originates from material that detached from the outermost part of the disk of ESO137001, at radii kpc where stars rotate at comparable velocity (see inset in Figure 3 and cf. the rotational velocity estimates by Jachym et al., 2014). A hint of the same effect, but with reversed sign, is visible in the northern part of the primary tail where the stripped gas is blue-shifted compared to systemic velocity, in agreement with the velocity field of the stellar disk.
The infall velocity is unknown from direct observations, but we can combine several pieces of evidence to conclude that ESO137001 is fast moving towards the center of the cluster. Given the cluster velocity dispersion, which Woudt et al. (2008) measured as , one could derive an approximate estimate for the orbital velocity of ESO137001 as . However, the study of Jachym et al. (2014) suggests that a much higher velocity is needed for an orbit that crosses the cluster virial radius. Detailed hydrodynamic calculations are required to link the infall velocity to the disturbances seen in ESO137001, but here we simply note that such a high velocity is qualitatively in line with cases of extreme ram pressure. For ESO137001, gas is ablated even from the most bound regions of the galaxy potential well, implying high ram pressure. Indeed, Jachym et al. (2014) estimates that during its interaction with the dense ICM, with electron densities of (Sun et al., 2010), ESO137001 can suffer from ram pressure up to a peak of for their assumed velocity.
As noted, a coherent radial velocity is visible on scales of at least kpc from the galaxy center along the tail. Besides, the H emitting gas exhibits a modest degree of turbulent motion on similar scales, as seen from the velocity dispersion map (Figure 4). The bulk of the gas has a velocity dispersion , in qualitative agreement with the narrow CO line profiles shown by Jachym et al. (2014). A lower velocity dispersion () is seen in the bright H knots which are offset from the primary tail, as expected for a colder medium which hosts sites of ongoing star formation. Beyond kpc from the galaxy position, a higher degree of velocity dispersion can be seen, with typical values above and peaks exceeding . We need to be more cautious in interpreting kinematics within Field B, due to the lower signal-to-noise of our observations. Nevertheless, a progressively higher velocity dispersion moving far from the ESO137001 disk along the tail was also noted by Jachym et al. (2014) who found larger FWHM and more complex line profiles in their CO observations at larger distances from the disk. Moreover, Gaussian fits to coarsely binned data with higher show larger velocity widths in the outer tail, consistently with the measurements presented in Figure 4. For an infall velocity , gas lying at kpc from the ESO137001 disk has been stripped no less than Myr ago, assuming instantaneous acceleration of the removed material to the ICM velocity. Thus, our observations suggest that substantial turbulence due to fluid instabilities or residual rotational velocity in the stripped gas grows on timescales of at least Myr. However, both results of numerical simulations (e.g. Roediger & Brüggen, 2008; Tonnesen & Bryan, 2012) and observations (Yoshida et al., 2012; Kenney et al., 2014) reveal that the stripped gas is not accelerated to orbital velocity instantaneously, and that the denser medium does not typically reach the infall velocity. Based on these results, the inferred timescale should be regarded as a conservative lower limit to the growth of instabilities in the tail. It is also interesting to note that this laminar flow persists despite the shear between the ambient ICM and the H emitting, perhaps due to the presence of magnetic fields (Ruszkowski et al., 2014; Tonnesen & Stone, 2014).
Finally, we can appeal to the observed coherence to argue that the relative velocity between the gas tail and the galaxy likely exceeds the galaxy circular velocity . Our argument starts by noting that the tail is confined by the ambient ICM. If that were not the case, in the absence of a restoring centripetal force, material ablated from the disk at a radius where the disk circular velocity is would leave on a tangential orbit, causing the tail to flare. Here, is the disk inclination angle and is the observed line of sight velocity. Unsurprisingly, this is not what we observe, as the gas in the tail is confined by the ambient ICM pressure.
In presence of a confining medium, a second velocity component perpendicular to the galaxy orbital motion contributes to the shear between the tail and the ICM. However, we noted how the tail retains a line-of-sight velocity similar to the disk rotation, which suggests that the tail cannot be spinning at higher velocity compared to the velocity of the gas in the tail relative to the galaxy. In a simple geometry, a parcel of gas that leaves the disk with velocity rotates by an angle by the time it has been displaced to a distance with velocity . Thus, the lack of substantial turbulence leads us to conclude that the angle is likely small, which is to say that and there are no significant instabilities due to the disk rotation that grow substantially at the interface between the warm gas in the tail and the hot ICM. Given that in the outer disk, and that most likely , we also conclude that , i.e. the galaxy is fast moving in the plane of the sky.
Clearly, this quite simple discussion should be verified with detailed hydrodynamic simulations designed to reproduce the properties of ESO137001, and that model the interaction of the warm/hot components, the effect of hydrodynamic and thermal instabilities, and the role of magnetic fields. All these quantities are in fact encoded in the phenomenology revealed by our MUSE observations.
5 Summary and future work
In this paper we have presented MUSE science verification observations of the central disk and gaseous tail of ESO137001, a spiral galaxy infalling at high velocity on a nearly-radial orbit towards the center of the massive Norma cluster at . During its encounter with the ICM, ESO137001 experiences extreme ram-pressure stripping, which gives rise to an extended tail that has been detected at multiple wavelengths, from the X-ray to the radio. The new capabilities of MUSE, with its large field of view, extended wavelength coverage, and high throughput, have allowed us to map the H emitting gas inside ESO137001 and its tail to surface brightness limits of erg s-1 cm-2 arcsec-2, and to reconstruct the stellar kinematics traced by the \textCa ii triplet.
These new data offer an unprecedented view of ESO137001 and its tail, which is traced in H emission to beyond 30 kpc. These observations allow us to conclude that the ISM of this galaxy suffered and it is still suffering from ram-pressure stripping at different galactocentric radii: the less bound material has been completely stripped from the outer disk, giving rise to clumpy and irregular tails, while the galaxy center still contains part of the original ISM which feeds the primary H tail, aligned with the X-ray emission. The stripped gas retains the original rotation velocity of the stellar disk, but exhibits a remarkable degree of coherence in velocity space for kpc downstream. Beyond kpc from the galaxy disk along the tail, a greater degree of turbulence is seen, with peak velocity dispersion . These pieces of evidence are indicative that the galaxy is fast moving in the plane of sky, with infall velocity greater than the rotational velocity. For an infall velocity of , indicated by the orbital study of Jachym et al. (2014), material at kpc has been stripped no less than Myr ago, suggesting that the transition from laminar to turbulent flow occurs on comparable, or most likely, longer timescales. Finally, the ordered stellar rotation combined with regular isophotes in the disk rules out gravitational interactions as the main process responsible for the stripping.
This work offers only a first glimpse of the rich MUSE datacube, in which we detect multiple transitions including [OIII], [OI], [NII], [SII], H in emission, as well as absorption lines within the stellar disk, most notably \textCa ii and H. All these transitions will allow us to better constrain the physical properties of the disk and tail of ESO137001, including the properties of the bow shock and the interaction between the stripped warm ISM and the hot X-ray emitting plasma. Furthermore, a detailed comparison of these observations with results of numerical simulations will be crucial to establish the hydrodynamic and thermal properties of the gas which is subject to ram-pressure stripping, including the role of instabilities and magnetic fields. These studies will be presented in future papers of this series.
Our work demonstrates the terrific potential that MUSE and future large field-of-view IFUs on 8-10m class telescopes have in studying ram-pressure stripping, building on earlier IFU studies (e.g. Merluzzi et al., 2013). By targeting galaxies like ESO137001 in which ram pressure is near to its maximum, these observations will provide key information on how gas is ablated from all galactocentric radii, how the diffuse and dense ISM components interact and mix with the ambient ICM, and on what timescales star formation responds to this gas removal. Once applied to more typical cluster galaxies, results from these detailed analyses will offer a comprehensive view of how ram pressure affects the build-up of the observed red sequence in rich clusters. In turn, this will help to disentangle the role of environment from the role of internal processes in shaping the color bimodality seen in the densest regions of the Universe.
Acknowledgments
It is a pleasure to thank Mark Swinbank for his advice on how to handle MUSE data, together with Emanuele Farina, David Wilman, and Elke Roediger for comments on this manuscript. We thank David J. Wilman and Joris Gerssen for the development of the KUBEVIZ code, and Eric Slezak for his contribution to the MUSE science verification programme. We thank the referee, Jeffrey Kenney, for insightful comments on this manuscript. This work is based on observations made with ESO telescopes at the La Silla Paranal Observatory under programme ID 60.A-9349(A). M. Fumagalli acknowledges support by the Science and Technology Facilities Council [grant number ST/L00075X/1]. M Fossati acknowledges the support of the Deutsche Forschungsgemeinschaft via Project ID 387/1-1. For access to the data used in this paper and the IDL code to process the MUSE datacubes, please contact the authors.
References
- (1)
- Arrigoni Battaia et al. (2012) Arrigoni Battaia, F., Gavazzi, G., Fumagalli, M., et al. 2012, A&A, 543, A112
- Bacon et al. (2010) Bacon, R., Accardo, M., Adjali, L., et al. 2010, Proc. SPIE, 7735, 9
- Baldry et al. (2004) Baldry, I. K., Glazebrook, K., Brinkmann, J., et al. 2004, ApJ, 600, 681
- Balogh et al. (2004) Balogh, M., Eke, V., Miller, C., et al. 2004, MNRAS, 348, 1355
- Bekki & Couch (2003) Bekki, K., & Couch, W. J. 2003, ApJ, 596, L13
- Bell et al. (2004) Bell, E. F., Wolf, C., Meisenheimer, K., et al. 2004, ApJ, 608, 752
- Boselli & Gavazzi (2006) Boselli, A., & Gavazzi, G. 2006, PASP, 118, 517
- Boselli et al. (2008) Boselli, A., Boissier, S., Cortese, L., & Gavazzi, G. 2008, ApJ, 674, 742
- Boselli et al. (2014) Boselli, A., Cortese, L., Boquien, M., et al. 2014, A&A, 564, A67
- Bower et al. (1992) Bower, R. G., Lucey, J. R., & Ellis, R. S. 1992, MNRAS, 254, 601
- Brammer et al. (2009) Brammer, G. B., Whitaker, K. E., van Dokkum, P. G., et al. 2009, ApJ, 706, L173
- Cappellari & Emsellem (2004) Cappellari, M., & Emsellem, E. 2004, PASP, 116, 138
- Cappellari & Copin (2003) Cappellari, M., & Copin, Y. 2003, MNRAS, 342, 345
- Cenarro et al. (2001) Cenarro, A. J., Cardiel, N., Gorgas, J., et al. 2001, MNRAS, 326, 959
- Chung et al. (2009) Chung, A., van Gorkom, J. H., Kenney, J. D. P., Crowl, H., & Vollmer, B. 2009, AJ, 138, 1741
- Chung et al. (2007) Chung, A., van Gorkom, J. H., Kenney, J. D. P., & Vollmer, B. 2007, ApJ, 659, L115
- Cortese et al. (2006) Cortese, L., Gavazzi, G., Boselli, A., et al. 2006, A&A, 453, 847
- Dressler et al. (2013) Dressler, A., Oemler, A., Jr., Poggianti, B. M., et al. 2013, ApJ, 770, 62
- Ebeling et al. (2014) Ebeling, H., Stephenson, L. N., & Edge, A. C. 2014, ApJ, 781, L40
- Fossati et al. (2012) Fossati, M., Gavazzi, G., Boselli, A., & Fumagalli, M. 2012, A&A, 544, A128
- Fumagalli & Gavazzi (2008) Fumagalli, M., & Gavazzi, G. 2008, A&A, 490, 571
- Fumagalli et al. (2009) Fumagalli, M., Krumholz, M. R., Prochaska, J. X., Gavazzi, G., & Boselli, A. 2009, ApJ, 697, 1811
- Fumagalli et al. (2011) Fumagalli, M., Gavazzi, G., Scaramella, R., & Franzetti, P. 2011, A&A, 528, A46
- Gavazzi et al. (2010) Gavazzi, G., Fumagalli, M., Cucciati, O., & Boselli, A. 2010, A&A, 517, A73
- Gavazzi et al. (2002) Gavazzi, G., Bonfanti, C., Sanvito, G., Boselli, A., & Scodeggio, M. 2002, ApJ, 576, 135
- Gavazzi et al. (2001) Gavazzi, G., Boselli, A., Mayer, L., et al. 2001, ApJ, 563, L23
- Gavazzi & Jaffe (1985) Gavazzi, G., & Jaffe, W. 1985, ApJ, 294, L89
- Giovanelli & Haynes (1985) Giovanelli, R., & Haynes, M. P. 1985, ApJ, 292, 404
- Gunn & Gott (1972) Gunn, J. E., & Gott, J. R., III 1972, ApJ, 176, 1
- Haynes et al. (1984) Haynes, M. P., Giovanelli, R., & Chincarini, G. L. 1984, ARA&A, 22, 445
- Hashimoto et al. (1998) Hashimoto, Y., Oemler, A., Jr., Lin, H., & Tucker, D. L. 1998, ApJ, 499, 589
- Henden et al. (2012) Henden, A. A., Levine, S. E., Terrell, D., Smith, T. C., & Welch, D. 2012, Journal of the American Association of Variable Star Observers (JAAVSO), 40, 430
- Hester et al. (2010) Hester, J. A., Seibert, M., Neill, J. D., et al. 2010, ApJ, 716, L14
- Hinshaw et al. (2013) Hinshaw, G., Larson, D., Komatsu, E., et al. 2013, ApJS, 208, 19
- Jachym et al. (2014) Jachym, P., Combes, F., Cortese, L., Sun, M., & Kenney, J. D. P. 2014, arXiv:1403.2328
- Kauffmann et al. (2004) Kauffmann, G., White, S. D. M., Heckman, T. M., et al. 2004, MNRAS, 353, 713
- Kenney et al. (2014) Kenney, J. D. P., Geha, M., Jáchym, P., et al. 2014, ApJ, 780, 119
- Kenney et al. (2008) Kenney, J. D. P., Tal, T., Crowl, H. H., Feldmeier, J., & Jacoby, G. H. 2008, ApJ, 687, L69
- Kronberger et al. (2008) Kronberger, T., Kapferer, W., Ferrari, C., Unterguggenberger, S., & Schindler, S. 2008, A&A, 481, 337
- Larson et al. (1980) Larson, R. B., Tinsley, B. M., & Caldwell, C. N. 1980, ApJ, 237, 692
- Lewis et al. (2002) Lewis, I., Balogh, M., De Propris, R., et al. 2002, MNRAS, 334, 673
- Nishino et al. (2012) Nishino, S., Fukazawa, Y., & Hayashi, K. 2012, PASJ, 64, 16
- Nulsen (1982) Nulsen, P. E. J. 1982, MNRAS, 198, 1007
- Merluzzi et al. (2013) Merluzzi, P., Busarello, G., Dopita, M. A., et al. 2013, MNRAS, 429, 1747
- Moore et al. (1996) Moore, B., Katz, N., Lake, G., Dressler, A., & Oemler, A. 1996, Nature, 379, 613
- Quilis et al. (2000) Quilis, V., Moore, B., & Bower, R. 2000, Science, 288, 1617
- Roediger et al. (2014) Roediger, E., Brüggen, M., Owers, M. S., Ebeling, H., & Sun, M. 2014, arXiv:1405.1033
- Roediger & Brüggen (2008) Roediger, E., & Brüggen, M. 2008, MNRAS, 388, 465
- Ruszkowski et al. (2014) Ruszkowski, M., Brüggen, M., Lee, D., & Shin, M.-S. 2014, ApJ, 784, 75
- Schulz & Struck (2001) Schulz, S., & Struck, C. 2001, MNRAS, 328, 185
- Sivanandam et al. (2010) Sivanandam, S., Rieke, M. J., & Rieke, G. H. 2010, ApJ, 717, 147
- Smith et al. (2010) Smith, R. J., Lucey, J. R., Hammer, D., et al. 2010, MNRAS, 408, 1417
- Smith et al. (2012a) Smith, R. J., Lucey, J. R., Price, J., Hudson, M. J., & Phillipps, S. 2012, MNRAS, 419, 3167
- Smith et al. (2012b) Smith, R., Fellhauer, M., & Assmann, P. 2012, MNRAS, 420, 1990
- Strateva et al. (2001) Strateva, I., Ivezić, Ž., Knapp, G. R., et al. 2001, AJ, 122, 1861
- Sun et al. (2010) Sun, M., Donahue, M., Roediger, E., et al. 2010, ApJ, 708, 946
- Sun et al. (2006) Sun, M., Jones, C., Forman, W., et al. 2006, ApJ, 637, L81
- Sun et al. (2007) Sun, M., Donahue, M., & Voit, G. M. 2007, ApJ, 671, 190
- Toloba et al. (2011) Toloba, E., Boselli, A., Cenarro, A. J., et al. 2011, A&A, 526, A114
- Tonnesen & Bryan (2010) Tonnesen, S., & Bryan, G. L. 2010, ApJ, 709, 1203
- Tonnesen & Bryan (2012) Tonnesen, S., & Bryan, G. L. 2012, MNRAS, 422, 1609
- Tonnesen & Stone (2014) Tonnesen, S., & Stone, J. 2014, arXiv:1408.4521
- Vollmer et al. (2001a) Vollmer, B., Cayatte, V., Balkowski, C., & Duschl, W. J. 2001, ApJ, 561, 708
- Vollmer et al. (2004) Vollmer, B., Balkowski, C., Cayatte, V., van Driel, W., & Huchtmeier, W. 2004, A&A, 419, 35
- Vollmer et al. (2008) Vollmer, B., Braine, J., Pappalardo, C., & Hily-Blant, P. 2008, A&A, 491, 455
- Weiner et al. (2005) Weiner, B. J., Phillips, A. C., Faber, S. M., et al. 2005, ApJ, 620, 595
- Woudt et al. (2008) Woudt, P. A., Kraan-Korteweg, R. C., Lucey, J., Fairall, A. P., & Moore, S. A. W. 2008, MNRAS, 383, 445
- Yagi et al. (2010) Yagi, M., Yoshida, M., Komiyama, Y., et al. 2010, AJ, 140, 1814
- Yoshida et al. (2002) Yoshida, M., Yagi, M., Okamura, S., et al. 2002, ApJ, 567, 118
- Yoshida et al. (2012) Yoshida, M., Yagi, M., Komiyama, Y., et al. 2012, ApJ, 749, 43