Deep Chandra Observations of HCG 16 — I. Active Nuclei, Star formation and Galactic Winds
Abstract
We present new, deep Chandra X-ray and Giant Metrewave Radio Telescope 610 MHz observations of the spiral-galaxy-rich compact group HCG 16, which we use to examine nuclear activity, star formation and the high luminosity X-ray binary populations in the major galaxies. We confirm the presence of obscured active nuclei in NGC 833 and NGC 835, and identify a previously unrecognized nuclear source in NGC 838. All three nuclei are variable on timescales of months to years, and for NGC 833 and NGC 835 this is most likely caused by changes in accretion rate. The deep Chandra observations allow us to detect for the first time an Fe-K emission line in the spectrum of the Seyfert 2 nucleus of NGC 835. We find that NGC 838 and NGC 839 are both starburst-dominated systems, with only weak nuclear activity, in agreement with previous optical studies. We estimate the star formation rates in the two galaxies from their X-ray and radio emission, and compare these results with estimates from the infra-red and ultra-violet bands to confirm that star formation in both galaxies is probably declining after galaxy-wide starbursts were triggered 400-500 Myr ago. We examine the physical properties of their galactic superwinds, and find that both have temperatures of 0.8 keV. We also examine the X-ray and radio properties of NGC 848, the fifth largest galaxy in the group, and show that it is dominated by emission from its starburst.
Subject headings:
galaxies: groups: individual (HCG 16) — galaxies: individual (NGC 833, NGC 835, NGC 838, NGC 839, NGC 848) — galaxies: active — galaxies: starburst — X-rays: galaxies1. Introduction
Compact groups of galaxies provide an excellent natural laboratory for the study of galaxy interactions and evolution. The group environment is conducive to such interactions, with low velocity dispersions (500), small galaxy separations, and galaxy densities comparable to those seen in galaxy clusters. The repeated tidal interactions between member galaxies in compact groups are likely to play a role in a variety of processes involved in galaxy evolution, including gas stripping, the triggering or quenching of star formation and galactic winds, and the feeding and growth of the central supermassive black holes. As most galaxies in the local universe reside in groups (Eke et al., 2004) and it is thought that many galaxies in clusters have been processed through group environments in the past (Cappellari et al., 2011; Mahajan et al., 2012), it is clearly important to understand the role of the group environment in driving galaxy evolution .
The gas content and galaxy population of groups appears to be linked, with spiral-rich groups typically containing large reservoirs of and other cold gas, while elliptical dominated groups often have extended halos of hot, X-ray emitting gas, with neutral hydrogen restricted to spiral galaxies in the group outskirts (Kilborn et al., 2009). Examination of X-ray faint, spiral-rich compact groups has led to the suggestion of an evolutionary sequence, with galaxy interactions stripping the from spiral galaxies to form intergalactic clouds and filaments or even a diffuse cold IGM (Verdes-Montenegro et al., 2001; Johnson et al., 2007; Konstantopoulos et al., 2010). The redistribution of the component is accompanied by the transformation of some member galaxies from late to early-type, and in some cases by star formation. HCG 16, also known as Arp 318, is one of the best studied examples of a compact group in the late stages of this evolutionary sequence.
HCG 16 was originally identified (Hickson, 1982) as a compact group of four spiral galaxies, NGC 833 (HCG 16B), NGC 835 (A), NGC 838 (C) and NGC 839 (D). Figure 1 includes a Digitized Sky Survey image showing the relative positions of the group members. Later observations increased the number of members to seven, including one large spiral galaxy, NGC 848, of comparable luminosity to the original four (Ribeiro et al., 1998). A search in the NASA/IPAC Extragalactic Database (NED111The NASA/IPAC Extragalactic Database (NED) is operated by the Jet Propulsion Laboratory, California Institute of Technology, under contract with the National Aeronautics and Space Administration.) finds three additional galaxies within 30′ and in the velocity range 3800-4100, suggesting a more dispersed halo of dwarf galaxies surrounding the core. All five major galaxies host AGN and/or starbursts (e.g., Martínez et al., 2010; de Carvalho & Coziol, 1999), and an ongoing or recent interaction between NGC 833 and NGC 835 has warped their galaxy disks and produced a dusty tidal arm extending east from NGC 835 toward NGC 838 (Konstantopoulos et al., 2013). Both Mulchaey et al. (2003) and Osmond & Ponman (2004) find spiral fractions for the group 1 (=0.86, and =0.83 respectively), but in both cases this primarily reflects the classification of NGC 839 as an S0, which seems misleading given its current high rate of star formation. We consider all five major galaxies in the group to be late-type.
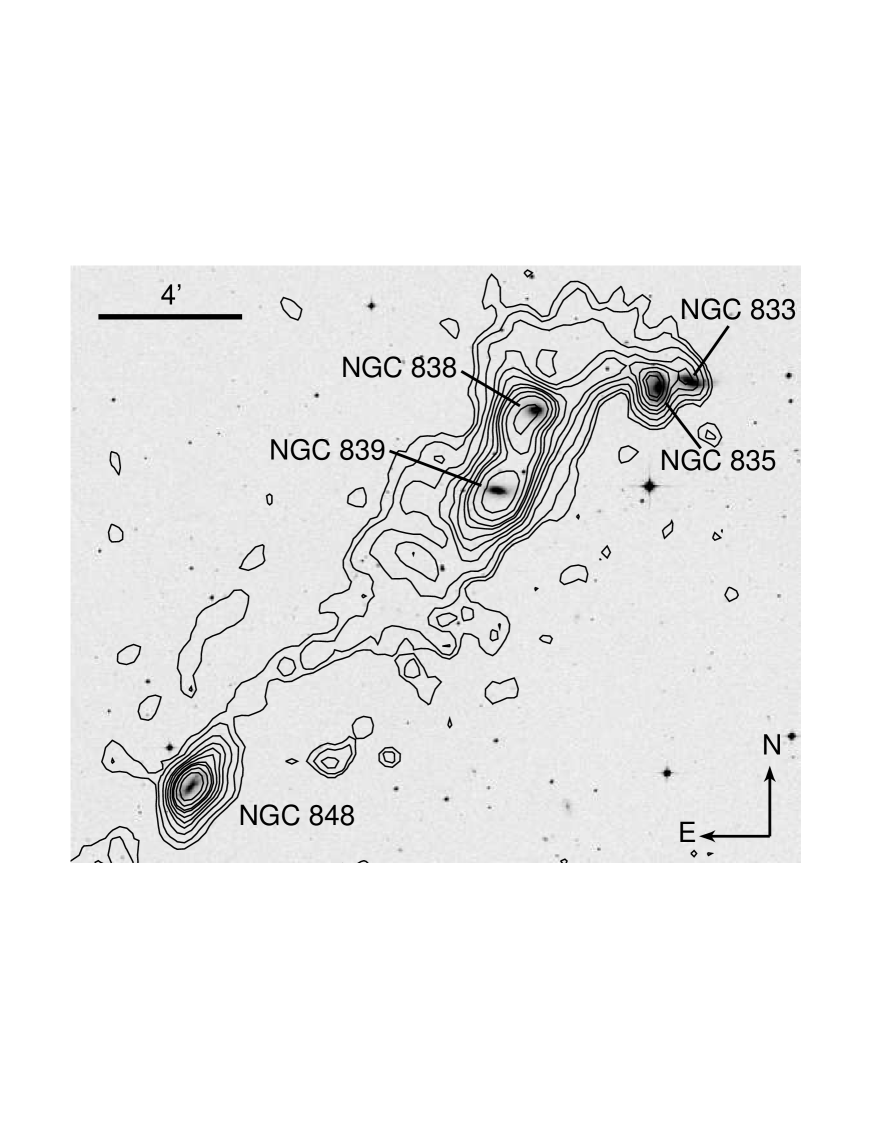
Neutral hydrogen mapping of the group (see Figure 1) revealed a 20′ long complex filament of cold gas surrounding the four original members of the group and linking them to NGC 848 (Verdes-Montenegro et al., 2001), almost certainly as the result of tidal interactions between group members. The total mass of in the group is 2.631010, and Verdes-Montenegro et al. estimate that the group is 30% -deficient. The four original member galaxies are 50-80% deficient, while NGC 848 is only 7% deficient. This suggests that the majority of the intergalactic originated in the four main galaxies, perhaps being transported out into the IGM by interactions among them, and then drawn into its current morphology by a close passage of NGC 848. Borthakur et al. (2010) show that the velocity distribution covers the range 3650-4100, confirming its association with the major member galaxies.
HCG 16 was first detected in X-rays using the Einstein observatory (Bahcall et al., 1984). More detailed studies with ROSAT were able to separate emission from the galaxies and diffuse inter-galactic gas (Ponman et al., 1996; Dos Santos & Mamon, 1999) with the brightest emission around and between the four main galaxies. First light data from XMM-Newton were used to examine the four main galaxies, providing evidence of a combination of star formation and AGN emission from NGC 833, NGC 835 and NGC 839, and classifying NGC 838 as a pure starburst (Turner et al., 2001, hereafter TRP01). A short (12.5 ks) Chandra observation in cycle 1 was unable to improve on the characterization of the galaxy emission (González-Martín et al., 2006) but did provide evidence of a bridge of diffuse emission linking NGC 833 and NGC 835 (Jeltema et al., 2008, see also the unpublished image previously produced from this data by Mamon & Lima Neto222 http://dx.doi.org/10.6084/m9.figshare.971366).
Optical spectroscopic studies of the starburst galaxies NGC 838 and NGC 839 have provided detailed characterization of these two galaxies and their outflowing galactic winds. In NGC 839 the wind has formed a biconical polar outflow with velocity 250, while the galaxy is dominated by a rapidly rotating 400 Myr old stellar component (Rich et al., 2010). The winds appear to be shock excited, and Rich et al. argue that emission probably arises from these shocks rather than from an AGN. NGC 838 appears to have undergone a galaxy-wide starburst episode 500 Myr ago, although rapid star formation is now found only in the galaxy core (Vogt et al., 2013). The asymmetric photoionized winds have inflated bubbles north and south of the galaxy, above and below the galactic disk, with sizes of 5 kpc and 7 kpc (18′′ and 25′′) for the north and south bubbles respectively, and likely ages of 5-50 Myr. Highly redshifted gas emission in the outer part of the larger southern bubble indicates that it is probably leaking material.
In this paper we use new, deep Chandra observations to examine the major galaxies of HCG 16, with the goal of studying their point source populations, star formation and nuclear activity. A study of the diffuse emission in the group, and its relation to the major galaxies is presented in O’Sullivan et al. (2014, hereafter paper II). We adopt a Galactic hydrogen column density of =2.561020 for the four original group member galaxies and the surrounding diffuse emission (taken from the Leiden/Argentine/Bonn survey, Kalberla et al., 2005). For NGC 848 we adopt a hydrogen column of =2.751020. All fluxes and luminosities are corrected for Galactic absorption. We adopt a redshift of =0.0132 for the group (Hickson et al., 1992). A redshift-independent distance measurement is available for one of the five major galaxies, a Tully-Fisher distance of 56.5 Mpc for NGC 848 (Theureau et al., 2007). This is consistent, within errors, with redshift-based estimates for all five of the galaxies, correcting for infall toward the Virgo cluster, great attractor and Shapley Supercluster, for a cosmology with =70. We therefore adopt this distance estimate for the group as a whole, which gives an angular scale of 1′′=273 pc.
2. Observations and Data Analysis
2.1. Chandra
| ObsID | P.I. | Observation date | mode | Frame time | subarray | Roll angle | Cleaned exposure |
|---|---|---|---|---|---|---|---|
| (s) | (∘) | (s) | |||||
| 923 (catalog ADS/Sa.CXO#obs/923) | Mamon | 2000 Nov 16 | F | 3.2 | N | 325.98 | 12565 |
| 10394 (catalog ADS/Sa.CXO#obs/10394) | Alexander | 2008 Nov 23 | VF | 1.5 | 1/2 | 319.47 | 13824 |
| 15181 (catalog ADS/Sa.CXO#obs/15181) | Vrtilek | 2013 Jul 16 | VF | 3.1 | N | 111.35 | 49457 |
| 15666 (catalog ADS/Sa.CXO#obs/15666) | Vrtilek | 2013 Jul 18 | VF | 3.1 | N | 111.35 | 29714 |
| 15667 (catalog ADS/Sa.CXO#obs/15667) | Vrtilek | 2013 Jul 21 | VF | 3.1 | N | 111.35 | 58335 |
HCG 16 has been observed five times by the Chandra ACIS instrument, briefly in cycles 1 and 10, and most recently in cycle 14 for a total of 137.5 ks. Table 1 summarises the observational setup of the five exposures. A summary of the Chandra mission and instrumentation can be found in Weisskopf et al. (2002). In all five observations the S3 CCD was placed at the focus of the telescope. ObsID 10394 was performed using a 1/2 subarray, with a short (1.5 s) frame time, and with only the ACIS-S3 CCD switched on. The three observations in cycle 14 were performed with the same roll angle. The four original group members are located on the S3 CCD in four of the five observations, but ObsID 10394 covers only NGC 835 and NGC 838. NGC 848 is only visible on the S1 CCD of ObsID 923.
We have reduced the data from all five pointings using CIAO 4.6.1 (Fruscione et al., 2006) and CALDB 4.5.9 following techniques similar to those described in O’Sullivan et al. (2007) and the Chandra analysis threads333http://asc.harvard.edu/ciao/threads/index.html. The level 1 event files were reprocessed, bad pixels and events with ASCA grades 1, 5 and 7 were removed, and the cosmic ray afterglow correction was applied. Very Faint mode cleaning was applied to all observations except ObsID 923. The data were corrected to the appropriate gain map, the standard time-dependent gain and charge-transfer inefficiency (CTI) corrections were made, and background light curves were produced. None of the observations suffered from significant background flaring. A comparison of 0.5-0.7 keV and 2.5-5 keV light curves shows no significant difference between the two bands, indicating that the observations are not affected by solar wind charge exchange emission. In general all five observations were combined for imaging analysis, but spectra were extracted separately and fitted simultaneously.
Point source identification was performed using the ciao task wavdetect, with a detection threshold of 10-6, chosen to ensure that the task detects 1 false source in the S3 field of view, working from a 0.3-7.0 keV image and exposure map from the five observations combined. We defined source apertures based on the position of each source as reported by wavdetect. In the case of confused or extended sources we adjusted these centroids based on the peak of the emission in the 2-7 keV band. Ellipticities and position angles from wavdetect were retained, but the axes of each source region were reduced to approximately the 90% encircled energy radius, with a minimum radius of 1′′. For sources outside the bodies of the galaxies we used the regions reported by wavdetect, which satisfied the 90% encircled energy limit. The resulting regions were used to examine source properties, and to exclude them from spectral fits to the diffuse emission.
Spectra were extracted from each dataset using the specextract task. When examining diffuse emission, background spectra were drawn from blank-sky event lists, scaled to match the data in the 9.5-12.0 keV band. For point sources, local background spectra were used, typically from an elliptical annulus with radius 1.5-3 times that of the source extraction region. Where the source was partially surrounded by diffuse emission (as in NGC 838), background regions were chosen to include a representative fraction of that diffuse emission. Spectral fitting was performed in XSPEC 12.8.1. Abundances were measured relative to the abundance ratios of Grevesse & Sauval (1998). 1 uncertainties for one interesting parameter are reported for all fitted values.
2.2. Very Large Array and Giant Metrewave Radio Telescope
| Observatory | project | Observation date | Frequency | Bandwidth | Integration time | HPBW | Pos. Angle | rms |
|---|---|---|---|---|---|---|---|---|
| (MHz) | (MHz) | (hr) | (′′′′) | (∘) | (Jy beam-1) | |||
| VLA | AW500 | 1999 Jan 13-14 | 1402 | 6.3 | 5 | 25.018.1 | -6.64 | 200 |
| GMRT | 17_026 | 2009 Nov 21 | 610 | 32 | 6 | 5.65.4 | -3.0 | 60 |
We analysed 1.4 GHz data retrieved from the Very Large Array (VLA) public archive. The observations were performed in C array, in spectral line mode with 64 channels centred at 1402 MHz for a total on-source exposure of 5 hrs. Further details of the observation are shown in Table 2. We used the NRAO Astronomical Image Processing System (aips) package for the data reduction and analysis. Data calibration and imaging were carried out following the standard procedure (Fourier transform, clean and restore). Phase-only self-calibration was applied to remove residual phase variations and improve the quality of the image. The final image has an angular resolution of 2518.1′′ and an rms noise level (1) of 0.2 mJy beam-1.
We also observed the group with the Giant Metrewave Radio Telescope (GMRT) in dual-frequency 610/235 MHz mode (project 17026, P.I. E. O’Sullivan). The observations were again analysed using aips, with phase self-calibration, following the methods described in Giacintucci et al. (2011). The 235 MHz data suffer from calibration problems, and we therefore excluded them from further analysis. The 610 MHz data are essentially free of radio frequency interference (RFI), but are dynamic range limited owing to a powerful nearby source whose side lobes affect the region of the group. This problem becomes more severe in lower resolutions, and we therefore use only the full resolution (5.65.4′′) image which has an rms noise level (1) of 0.06 mJy beam-1. Further details of the 610 MHz observation are shown in Table 2.
3. Point Sources
Given its distance, we only expect to be able to detect relatively bright point sources in HCG 16. We use the Chandra Portable Interacting Multi-Mission Simulator (PIMMS; Mukai, 1993) to estimate the detection limit of the combined 2013 observations, requiring a minimum of 10 counts (0.5-7 keV) for detection and adopting a powerlaw model with =1.7 and Galactic absorption, and find a limit of 2.11038 (5.510-16). This is only about a factor of five below our adopted threshold for ultra–luminous X–ray point sources (ULXs), 1039 (e.g., Swartz et al., 2004). Since these are star forming galaxies, we expect most sources in the galaxies (excluding AGN) to be high mass X-ray binaries (HMXBs), formed from massive, short-lived stars.
Of the 30 point sources identified in the ACIS-S3 field of view, 18 fall within the ellipses of the four major galaxies, or in the tidal structures around NGC 833 and NGC 835. Table 3 summarises the locations of these 18 sources, the regions used to measure their fluxes, and the number of net counts in each source in a co-added image of all five observations. As expected, many of the sources in the starburst galaxy NGC 838 are clustered in the galaxy core, where star formation is ongoing. The other three galaxies contain only 1-4 sources each, and there is no clear correlation between source position and galaxy structure. We initially extracted spectra for each source, and estimated their background subtracted count rates using the dmextract task. The three sources with the highest fluxes (700 net 0.5-7 keV counts) are associated with the nuclei of NGC 833, NGC 835 and NGC 839 (HCG 16B, A, and D). Detailed fits to these sources and their surrounding diffuse emission will be described in § 4. A further four sources had a sufficient number of counts in individual exposures to allow fitting of simple absorbed powerlaw and absorbed APEC thermal models, to help determine their origin. These fits are described later in § 3.1.
The remaining eleven sources were too faint for individual spectral fitting. In order to estimate luminosities from their count rates we required a conversion factor, including corrections for Galactic absorption and for the fraction of flux scattered outside the extraction region by the Chandra point spread function (PSF). As the responses calculated for each source during spectral extraction include a correction for PSF scattering, this conversion factor can be found by folding a standard source spectral model through each set of responses and determining the expected flux for a fixed count rate. Extragalactic X-ray binaries are commonly modelled using spectrally hard models such as a =1.7 powerlaw (e.g., Smith et al., 2012). To test the suitability of such a model we co-added the spectra and responses of the eleven faint sources using the combine_spectra task to create three stacked spectra, one each for ObsID 923, 10394, and the 2013 observations (15181, 15666 and 15667). These spectra were then simultaneously fitted using an absorbed powerlaw model with hydrogen column fixed at the Galactic value. The best fit has =1.690.14, in agreement with expectations, and reduced =1.245 for 22 degrees of freedom. We therefore adopt the =1.7 powerlaw to calculate the counts-to-flux conversion factors for each source in each observation. The resulting fluxes are listed in Table 4. Where sources are detected at less than 3 significance, we calculate an upper limit based on the integer number of counts required to produce a 3 detection, taking into account the scaled local background.
We also estimate the mean flux in the three 2013 observations combined; individual sources can be detected in a stacked image yet be undetected in each individual observation, and combining the three most recent observations allows us to estimate a flux without trying to combine counts from the earlier observations which have very different conversion factors. Three of the sources show evidence of variability between observations at 3 significance. Figure 2 shows the 0.5-7 keV fluxes for these sources in each observation. We note that when classifying sources as potential ULXs, we estimate a factor of 1.075 increase in flux between the 0.5-7 keV and 0.5-8 keV bands, so sources with 9.321038 are bright enough to be ULXs if they are located within HCG 16.
| Source | R.A. | Dec. | Radiia | p.a.a | net countsb | Notes |
|---|---|---|---|---|---|---|
| (J2000) | (J2000) | (′′) | (∘) | (cnt. s-1) | ||
| NGC 839 | ||||||
| 1 | 20942.754 | -10∘11′02.40′′ | 2.09,1.65 | 24.7 | 735.329.4 | nucleus |
| NGC 838 | ||||||
| 2 | 20937.062 | -10∘08′55.91′′ | 2.19,1.00 | 50.3 | 27.85.5 | |
| 3 | 20938.531 | -10∘08′48.26′′ | 1.45,1.30 | 139.9 | 274.024.3 | ULX or nuclear source |
| 4 | 20937.984 | -10∘08′48.83′′ | 1.61,1.00 | 49.2 | 93.311.0 | ULX |
| 5 | 20938.128 | -10∘08′45.71′′ | 1.19,1.14 | 155.5 | 24.412.5 | ULX, 1.44′′ from CXO J020938.1-100847 |
| 6 | 20938.449 | -10∘08′44.87′′ | 1.27,1.20 | 151.3 | 101.419.0 | probably thermal, 1.75′′ from SN 2005H |
| 7 | 20939.237 | -10∘08′44.41′′ | 1.57,1.31 | 15.4 | 36.27.4 | |
| 8 | 20938.340 | -10∘08′34.93′′ | 1.32,1.10 | 25.0 | 21.05.7 | |
| 9 | 20940.591 | -10∘08′26.72′′ | 1.12,1.00 | 24.8 | 15.54.4 | |
| 11 | 20938.118 | -10∘08′19.64′′ | 1.26,1.05 | 140.4 | 34.36.1 | possible background AGN in SDSS J020938.10-100819.4 |
| 17 | 20937.962 | -10∘08′40.53′′ | 1.72,1.20 | 147.4 | 58.89.6 | possibly thermal, CXO J020937.9-100840 |
| NGC 833 / NGC 835 complex | ||||||
| 10 | 20922.900 | -10∘08′24.93′′ | 1.45,1.45 | 174.6 | 116.611.1 | ULX in tidal zone, CXO J020922.8-100824 |
| 12 | 20924.613 | -10∘08′09.50′′ | 1.61,1.70 | 82.3 | 2361.350.7 | NGC 835 nucleus |
| 13 | 20921.099 | -10∘08′03.15′′ | 1.42,1.13 | 154.8 | 33.46.9 | ULX |
| 14 | 20920.861 | -10∘07′59.41′′ | 1.53,1.34 | 86.7 | 718.427.7 | NGC 833 nucleus |
| 15 | 20920.427 | -10∘07′48.08′′ | 1.64,1.20 | 37.0 | 17.94.5 | |
| 16 | 20927.578 | -10∘07′46.72′′ | 1.39,1.51 | 166.1 | 421.120.8 | possible background AGN, CXO J020927.6-100746 |
| in SDSS J020927.57-100746.2 | ||||||
| 18 | 20920.773 | -10∘07′46.18′′ | 2.44,1.00 | 178.1 | 11.53.9 | |
Note. — a Radii and position angles of elliptical regions used to extract spectra and numbers of counts. b Counts in 0.5-7 keV band, summed over all observations with source in field of view.
| Source | L (1038) | Variable? | |||||
|---|---|---|---|---|---|---|---|
| 923 | 10394 | 15181 | 15666 | 15667 | 15XXXa | ||
| 1 | 236.1325.20 | - | 316.8323.22 | 286.2329.56 | 303.8818.86 | 311.0513.40 | N |
| 2 | 33.12 | - | 8.10 | 17.42 | 13.523.55 | 8.281.76 | - |
| 3 | 75.05 | 134.6420.81 | 79.7611.97 | 48.6412.93 | 53.119.67 | 61.576.57 | 3 |
| 4 | 44.12 | 24.71 | 23.945.55 | 20.89 | 34.785.85 | 27.143.47 | N |
| 5 | 58.25 | 70.62 | 33.76 | 4.43 | 29.87 | 10.916.18 | - |
| 6 | 73.49 | 47.13 | 23.03 | 28.68 | 20.85 | 22.484.92 | - |
| 7 | 48.51 | 24.75 | 10.12 | 15.39 | 9.01 | 5.411.65 | - |
| 8 | 54.16 | 48.78 | 9.78 | 14.90 | 8.25 | 5.691.54 | - |
| 9 | 78.22 | 22.61 | 10.47 | 17.42 | 9.74 | 4.701.47 | - |
| 10 | 69.97 | - | 27.114.53 | 28.155.91 | 30.484.43 | 28.772.80 | N |
| 11 | 48.01 | 23.76 | 7.98 | 16.50 | 6.76 | 7.711.60 | - |
| 12 | 139.4837.98 | 95.7724.07 | 628.7522.00 | 601.3427.64 | 567.7219.27 | 597.1012.85 | 16 |
| 13 | 139.53 | - | 10.12 | 16.845.29 | 9.342.87 | 9.721.95 | N |
| 14 | 302.2969.55 | - | 158.3611.11 | 203.0916.13 | 196.4411.36 | 184.167.16 | N |
| 15 | 99.99 | - | 7.75 | 12.91 | 6.61 | 4.811.23 | - |
| 16 | 101.7630.23 | 54.6313.57 | 113.519.09 | 58.918.40 | 108.128.07 | 99.295.06 | 3 |
| 17 | 42.13 | 29.22 | 17.564.50 | 19.56 | 11.783.64 | 14.282.58 | N |
| 18 | 90.41 | - | 8.67 | 15.13 | 7.10 | 0.540.26 | - |
Note. — Upper limits are shown for sources detected at 3 significance in a particular observation. a: Column 7 shows the mean luminosity in the 2013 observations 15181, 15666 and 15667 co-added.

3.1. Notes on individual point sources
For sources 3, 6, 10 and 16 we are able to fit simple absorbed thermal plasma or powerlaw models. Spectra from datasets 923 and 10394 were not included in cases where they contain only a handful of counts for each source. The results of these fits are shown in Table 5.
| Source | Thermal model | Powerlaw model | |||||
|---|---|---|---|---|---|---|---|
| kT | Abund. | red. /d.o.fa | red. /d.o.fa | ||||
| (keV) | () | (1038) | (1038) | ||||
| 3 | 30.98 | 0.3b | 90.37 | 1.859/17 | 0.860.23 | 105.88 | 1.688/17 |
| 6 | 1.44 | 0.3b | 15.39 | 1.63/4 | 2.85 | 20.66 | 2.05/4 |
| 10 | 3.48 | 0.3b | 31.93 | 0.532/6 | 2.000.30 | 34.60 | 0.60/6 |
| 16 | 4.27 | 0.3b | 97.55 | 0.595/13 | 1.80 | 104.31 | 0.581/13 |
Note. — aThe reduced of the fit over its degrees of freedom. b Parameter fixed during fitting.
Sources 3 and 6 are located close together in the core of NGC 838. Source 6 is best fitted by a thermal plasma model with temperature 1.4 keV, somewhat hotter than the surrounding diffuse thermal emission, but not unphysically so. It has a relatively steep spectral index when fitted with a powerlaw. Given that NGC 838 hosts an extended starburst wind with a good deal of clumpiness in its X–ray structure, it seems likely that this source is in fact a cloud of hot gas.
By contrast, in source 3 the thermal model has an unconstrained high temperature while the powerlaw model has an index =0.860.23. ULXs are typically observed to have spectral indices of (Swartz et al., 2004), with only a very small fraction having indices as flat as source 3. The source is variable at 3 significance, and is located 1′′ from the optical centroid of the galaxy. The source luminosity is =[9.04]1039, and it therefore seems likely that this is the previously undetected active nucleus of NGC 838.
Source 16 is located in the tidal arm extending east from NGC 835. However, the X–ray centroid matches the position of SDSS J020927.57-100746.2, a faint (=21.8) galaxy with no measured redshift but which is probably unassociated with the group. The source was detected in previous Chandra observations (CXO J020927.6-100746, Evans et al., 2010). The spectrum is noisy, and cannot distinguish between a 4 keV thermal plasma or a 1.8 powerlaw. We conclude that this source is probably a background AGN unrelated to HCG 16.
Source 10 is located in the tidally disturbed structure on the southern edge of NGC 835 and NGC 833 and is bright and stable enough to have been previously detected as source CXO J020922.8-100824 (Evans et al., 2010). The spectra are not sufficient to distinguish between a thermal or powerlaw origin for the emission, but it seems plausible that the source is either a ULX in the tidal zone, or a background AGN.
Of the fainter sources, three (4, 5 and 13) are bright enough to be ULXs if they are truly point sources located in HCG 16. Source 5 corresponds to another peak in diffuse emission east of the core of NGC 838, and thus may be a gas clump like source 6. Source 4 is at the western edge of the diffuse emission of NGC 838 and is clearly visible in the 2-7 keV band, suggesting that it is a spectrally hard source. Source 13 is located just southwest of the core of NGC 833, close to the position of some unclassified optical sources visible in HST WFPC2 -band imaging. Source 11 is located 0.5′′ from SDSS J020938.10-100819.4 a disk galaxy north of NGC 838 with no measured spectroscopic redshift, and a photometric redshift of 0.2-0.25.
Based on the cumulative luminosity function of background sources measured by the Chandra Multiwavelength Project (ChaMP, Kim et al., 2007) we are able to estimate the number of background AGN we would expect to find within the ellipses and tidal interaction regions of the four major galaxies. The ellipses enclose an area of 3.05 square arcminutes, with the tidal regions adding 10% to this value. Based on the sensitivity limit of the stacked 2013 observations, we would expect to see 2.4 background AGN within the area of the galaxies in the 0.5-8 keV band. Our true sensitivity is probably somewhat better than this, since we include the two earlier observations when detecting sources, but the number of expected sources will also be somewhat lower since we use a narrower energy band (0.5-7 keV) than the ChaMP team. However, since both effects will be relatively small, we still expect to find 2-3 background sources in our regions of interest. This agrees well with our findings that sources 7 and 11 are probably associated with background galaxies.
4. Galaxy and AGN emission
To examine the radio emission from each galaxy, we extracted total flux densities in each band from regions defined based on the 3 detection contours. These 610 MHz and 1.4 GHz flux densities are listed in Table 6. From these fluxes we calculate a spectral index for each galaxy, defined as , being the flux density at frequency . We also calculated the radio power at each frequency, where the power is defined as =4D2(1+), where D is the distance and the redshift of the group. The 610 MHz data have sufficient spatial resolution to allow us to separate core and diffuse components of the radio emission for NGC 835 and NGC 838, and to suggest that some of the extended emission in NGC 848 may be associated with a background galaxy. We therefore report separate 610 MHz flux densities for the different components of these galaxies.
| Galaxy | ||||||
|---|---|---|---|---|---|---|
| (mJy) | (mJy) | (1021 W Hz-1) | (1021 W Hz-1) | |||
| NGC 833 | total | 6.00.3 | 4.10.2 | 0.50.1 | 2.30.1 | 1.60.1 |
| NGC 835 | total | 90.94.6 | 47.62.4 | 0.80.1 | 34.61.8 | 18.10.9 |
| core | 75.13.8 | - | - | - | - | |
| extended | 15.80.8 | - | - | - | - | |
| NGC 838 | total | 175.28.8 | 93.14.7 | 0.80.1 | 66.73.4 | 35.51.8 |
| core | 151.77.6 | - | - | - | - | |
| extended | 23.51.2 | - | - | - | - | |
| NGC 839 | total | 56.32.8 | 37.51.9 | 0.50.1 | 21.41.1 | 14.20.7 |
| NGC 848 | total | 18.60.9 | 10.90.5 | 0.60.1 | 7.10.3 | 4.10.2 |
| no extended | 12.00.6 | - | - | - | - |
Moving on to the X-ray properties of the major galaxies, we initially extracted spectra from relatively large regions around each of them. Point sources within these regions, except those corresponding to the nuclear sources in NGC 833, NGC 835 and NGC 839, were not excluded, so as to allow an accurate measurement of the total hard X-ray flux from the stellar populations of the galaxies. With the exception of NGC 848, where the shallow off-axis observation contains only a small number of counts, we determined the size of the extraction regions by examining the cumulative growth in the number of counts with radius from the centre of each galaxy, and selected regions which contain 95% of the background subtracted flux. In the case of NGC 833 and 835 there is a clear region of diffuse emission between the two galaxies, and in the eastern tidal arm extending from NGC 835. We therefore used 15′′ radius circles to extract spectra of the AGN and galaxy cores, and a larger polygonal region to examine the diffuse component.
The galaxy spectra were fitted with models consisting of APEC thermal plasma and powerlaw components, folded through an absorber whose column was fixed at the Galactic value. In the three galaxies with bright nuclear sources, a model of the galaxy emission with the AGN region (as defined in Table 3) removed was initially fitted. The AGN region was then reintroduced, and the galaxy model allowed to vary only in overall normalization, to account for the increased emission volume. Additional components were then added to model any AGN. Previous studies suggest that all three galaxies host partially absorbed AGN, so these were modelled using a powerlaw observed through a partial-covering absorber at the redshift of the galaxy. Although the partial covering fraction was allowed to fit in each case, we found that the best fit value was always 1.0. This suggests that all three AGN are in fact fully covered by their absorbers, and any unabsorbed powerlaw component probably arises from the X–ray binary population in the host galaxy. We outline the results of the fits to each galaxy below and best-fitting model parameters are shown in Table 7.
| Component | Parameter | NGC 833 | NGC 835 | NGC 838 | NGC 839 | NGC 848 | ||
|---|---|---|---|---|---|---|---|---|
| Model | AP+PL+abs.PL | AP+PL+abs.PL | AP+PL | AP+AP | AP+PL+abs.PL | AP+abs.PL | PL | |
| Galaxy emission | ||||||||
| Soft | kTa | 0.47 | 0.610.03 | 0.800.02 | 0.780.02 | 0.880.05 | 0.79 | - |
| Thermal | Zb | 0.47 | 0.22 | 0.16 | 0.16 | 0.3f | 0.3f | - |
| L | 41.25 | 200.91 | 415.56 | 420.15 | 92.8111.84 | 106.56 | - | |
| Hard | d | 0.0f | 0.0f | 0.0f | 0.0f | 0.0f | 0.47 | 0.0f |
| 1.65f | 1.65f | 1.84 | kTa=4.27 | 1.46 | 1.67 | 1.65 | ||
| L | 79.83 | 76.01 | 409.83 | 376.99 | 207.7817.57 | 477.44 | 212.36 | |
| red. /d.o.fe | 1.54/23 | 1.10/48 | 1.12/233 | 1.10/233 | 0.98/73 | 0.99/109 | 0.59/5 | |
| Nuclear emission | ||||||||
| AGN | d | 22.42 | 23.36 | - | - | 0.92 | - | - |
| 0.46 | 0.67 | - | - | 1.85 | - | - | ||
| L | 1519.4 | 6924.8 | - | - | 274.62 | - | - | |
| Fe K | Energya | - | 6.410.05 | - | - | - | - | - |
| width | - | 0.100.05 | - | - | - | - | - | |
| L | - | 116.11 | - | - | - | - | - | |
| red. /d.o.fe | 0.85/56 | 1.09/174 | - | - | 1.04/110 | - | - | |
Note. — Model indicates major model component, APEC thermal plasma (AP), powerlaw (PL) and powerlaw with intrinsic absorption (abs.PL). a Temperatures and energies are in units of keV. b Abundance relative to the solar value. c 0.5-7 keV luminositieses are given in units of 1038. d Intrinsic absorption in units of 1022. e The reduced of the fit over its degrees of freedom. f Parameters fixed during fitting.
4.1. NGC 833 / HCG 16B
NGC 833 is a disturbed Sb galaxy, with an asymmetric velocity distribution and misalignment between the gas and stellar rotation axes (Mendes de Oliveira et al., 1998), indicating that it is interacting with NGC 835. The galaxy has a LINER nucleus (Véron-Cetty & Véron, 2006) but there is no optical evidence of ongoing star formation, and the galaxy is relatively poor in ionized and molecular gas compared to its companions (Mendes de Oliveira et al., 1998). It is also the least luminous of the four major galaxies in the infrared and ultraviolet bands. Using the XMM first light observation, Turner et al. (2001) find that the galaxy spectrum is best modelled using a combination of a soft (0.470.12 keV) thermal model and two powerlaw components with =1.80.5, one of which is strongly absorbed below 3 keV.
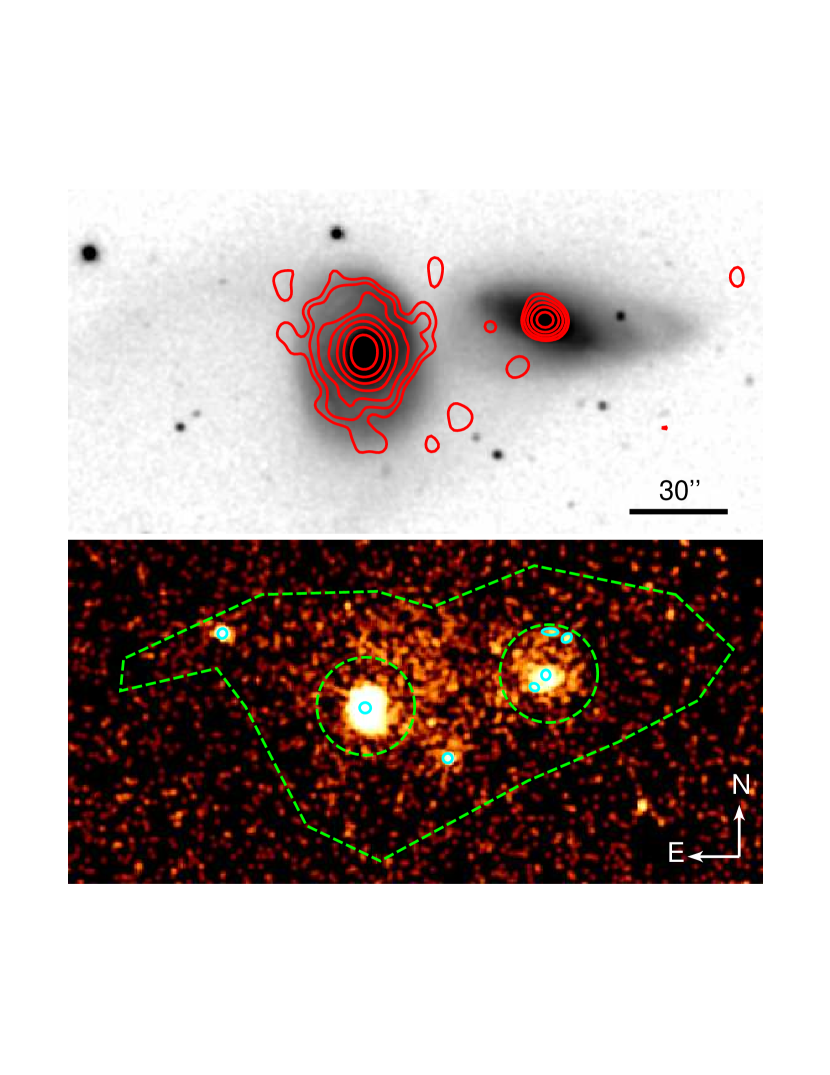
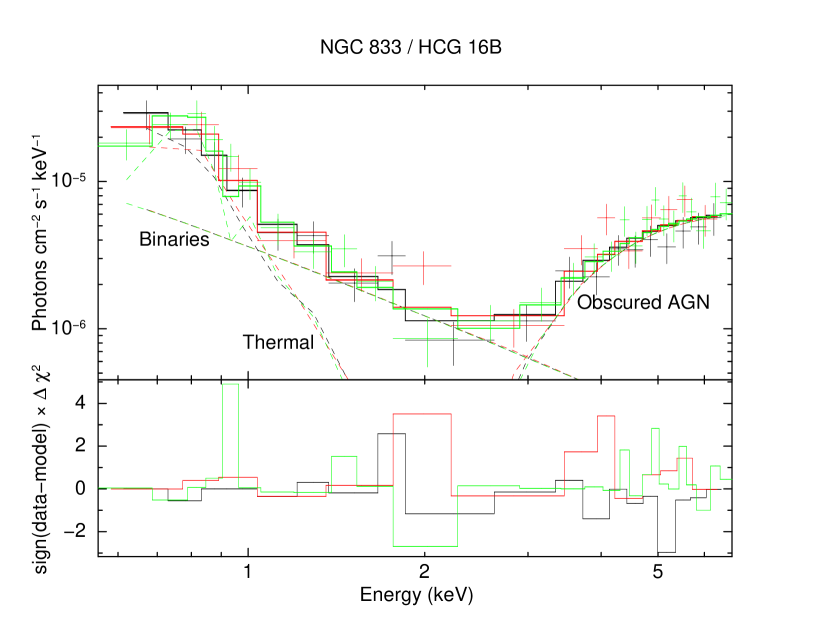
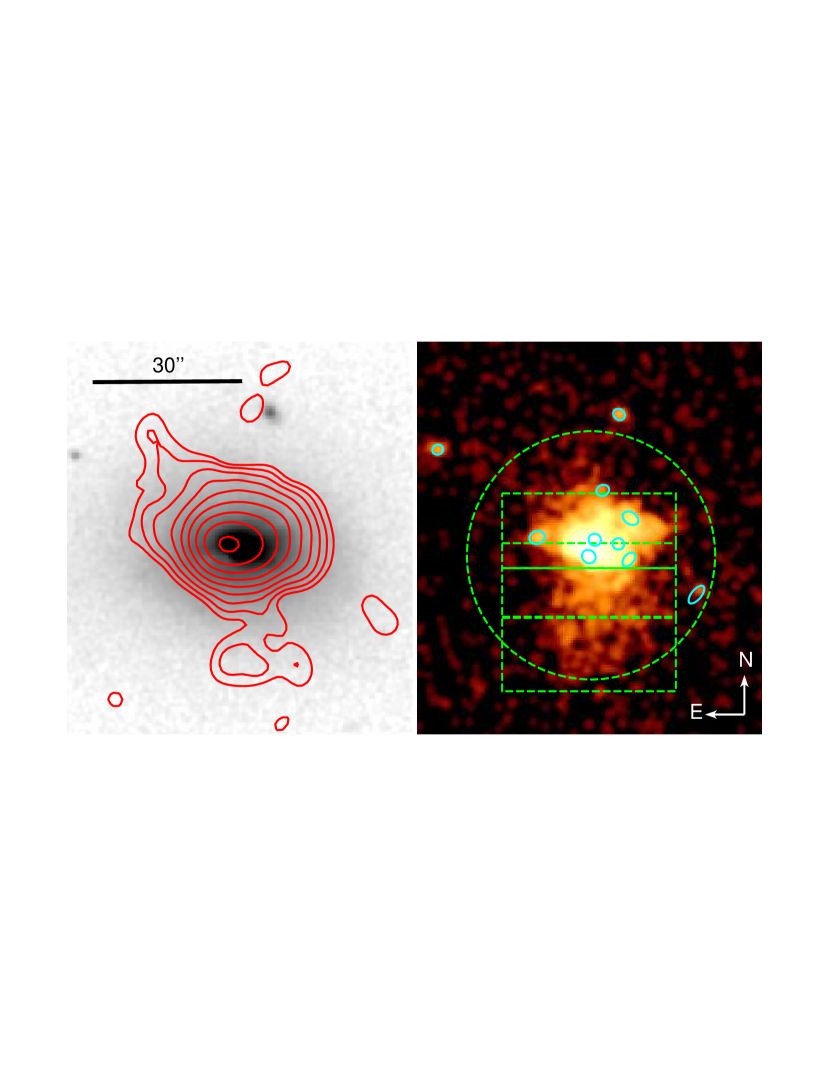
The GMRT 610 MHz image shows only an unresolved source at the position of NGC 833, presumably associated with the AGN. We model the X-ray spectrum of the central 15′′-radius region of the galaxy with the thermal plus powerlaw plus absorbed powerlaw model described above. The spectral extraction region, and those of point sources in the galaxy, is shown in Figure 3. Our best fit to spectra from ObsIDs 15181, 15666 and 15667 is shown in Figure 4 and its parameters are listed in Table 7. The temperature of the thermal component agrees with that found by TRP01, and we find a roughly half solar abundance. Our absorbed AGN model has a hydrogen column identical within errors with that found by TRP01, and a flatter powerlaw index consistent with TRP01 at the 2 level.
NGC 833 is also in the field of view of ObsID 923. The observation is too short to constrain our chosen model. However, comparing our best fitting model to the spectrum we find that the soft emission is reasonably well described by the thermal component, but that the hard emission is stronger than the model predicts. To test whether this arises from a change in the AGN intrinsic luminosity or in the absorbing column, we allow either the powerlaw normalization or the column density to vary while holding all other parameters fixed at their best fit values. An increase in normalization provides a significantly better fit than an increase in absorbing column (reduced =1.457 compared to 2.772 for 10 degrees of freedom), leading us to conclude that in 2000 November the AGN luminosity was a factor 3 greater than in 2013 July.
4.2. NGC 835 / HCG 16A
The other galaxy in the interacting pair, NGC 835, is a Seyfert 2 (Véron-Cetty & Véron, 2006) with an apparent tidal tail and clumpy ring of UV-bright knots at the edge of its disk, suggestive of star formation (TRP01). As with NGC 833, TRP01 modelled the X-ray emission from the galaxy with a combination of thermal and absorbed powerlaw components, finding that the temperature of the thermal component fell from 0.5 keV in the galaxy core to 0.3 keV in the star forming ring. The GMRT 610 MHz data reveal a central point source surrounded by diffuse emission from the galaxy disk, probably arising from star formation.
We extract spectra from a 15′′-radius region (inside the ring) and fit the same model we used for NGC 833. The spectral extraction region is shown in Figure 3. Fitting the 2013 observations simultaneously, we find a satisfactory solution, with an apparent 6.4 keV Fe K line visible in the longest exposures, ObsIDs 15181 and 15667. We therefore add a redshifted Gaussian component to the model and allow its energy, flux and line width to fit. The best fitting parameters are shown in Table 7 and the best fitting model in Figure 5.
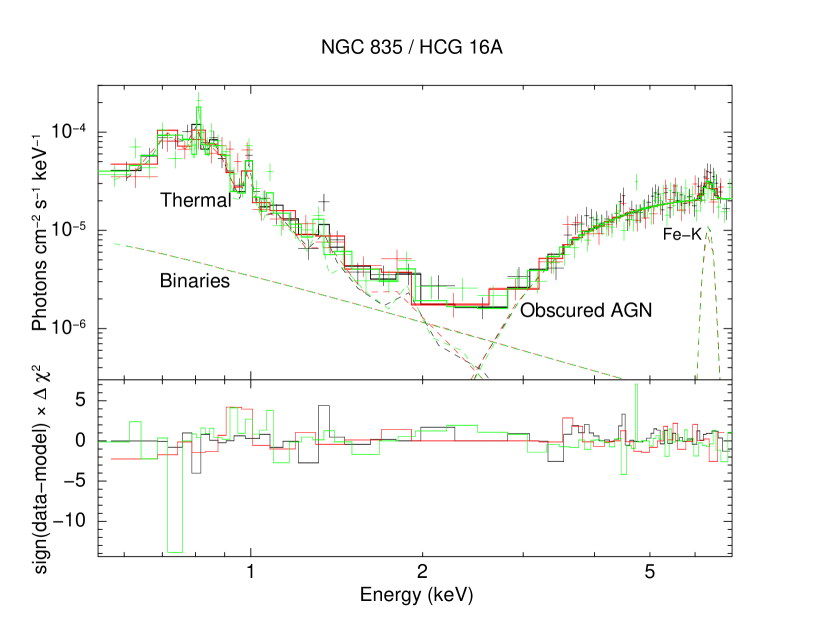
Our best fitting thermal component has a temperature higher than, but consistent at the 2 level with, that found by TRP01. We find an an abundance 0.25 lower than that in NGC 833, but consistent within the uncertainties. The AGN component has a significantly lower absorbing column than that found from XMM by TRP01 (23.41022 compared to 46151022) and a flatter powerlaw index (0.67 compared to 2.250.23). However, we note that our model differs from that of TRP01; their model contains no component to account for the X-ray binary population, but does include an unabsorbed AGN component whose powerlaw index is partially constrained by soft emission.
As with NGC 833, we find that our best fitting thermal component provides a reasonable description of the spectra extracted from ObsIDs 923 and 10394 below 2 keV, but that the hard 2-7 keV band flux in these earlier observations is significantly less than expected. We again allow either the AGN powerlaw normalization or absorbing column to fit, to test the likely cause of the reduced hard fluxes. In both cases a reduced normalization produces the better fit; reduced =1.374 compared to 1.559 for 13 degrees of freedom in ObsID 923 and reduced =2.098 compared to 2.559 for 12 degrees of freedom in ObsID 10394. The best fitting normalisations are 21% and 18% of the value found for the 2013 observations, respectively. However, the poor quality of these fits indicates that these simple adjustments to the model are insufficient, and the overall shape of the spectrum may have changed. Unfortunately these earlier observations lack the depth to constrain the model further. We conclude that the Seyfert nucleus of NGC 835 is variable in the X-ray band on timescales of months to years, probably in large part owing to changes in intrinsic luminosity.
4.3. Diffuse emission between NGC 833 and NGC 835
We extract spectra of the diffuse emission around and between NGC 833 and NGC 835 using a polygon region chosen to follow the stellar envelope, excluding point sources and the 15′′ radius galaxy regions described above (see Figure 3. The region includes the tidal arm and star–forming ring of NGC 835, and the outer tidally-disturbed parts of NGC 833. All five observations cover this region, though only partially in the case of ObsID 10394. The spectra are adequately modelled by a thermal plasma model with Galactic absorption (reduced =1.06 for 108 degrees of freedom). The thermal component has temperature kT=0.48 keV, abundance 0.09 and a 0.5-7 keV luminosity of (1.080.05)1040. Neither a two-temperature thermal model or a thermal plus powerlaw model provide a better fit, and both have unconstrained parameters, suggesting that the diffuse emission is at least primarily thermal and relatively soft.
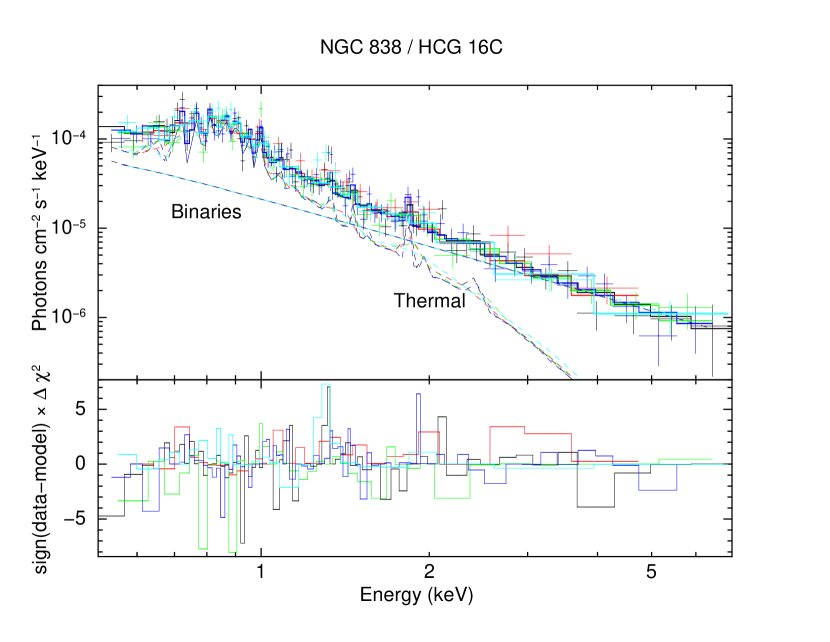
4.4. NGC 838 / HCG 16C
NGC 838 is a Luminous Infrared Galaxy (LIRG) having an infrared luminosity 1011, and is the most IR and UV luminous of the four major galaxies. Mendes de Oliveira et al. (1998) note a number of optical features indicating disturbance and possibly a recent merger, including kinematic warping and multiple kinematic components in the ionized gas which are misaligned with the stellar major axis. Vogt et al. (2013) argue that the galaxy underwent a period of global star formation 500 Myr ago, with star formation continuing in the galaxy core. This activity is driving an asymmetric bipolar wind, visible in ionized gas, which is probably only a few Myr old in its current phase (Vogt et al., 2013). TRP01, using XMM, identified diffuse X-ray emission in the galaxy, and found that it could be modelled as two-temperature thermal emission with kT=0.590.04 keV and 3.20.8 keV.
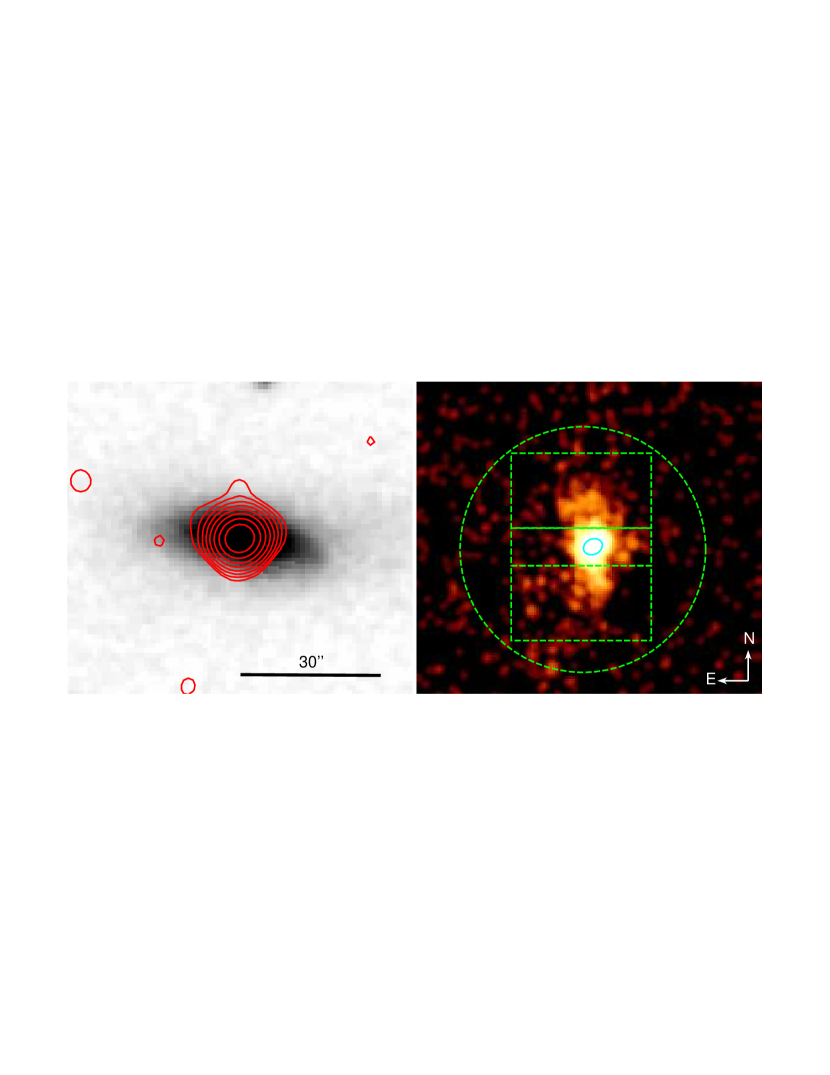
The Chandra image (Figure 6) shows that the diffuse emission extends along a roughly north-south axis to 15′′ north of the galaxy centroid and 25′′ southward. The northern emission appears brighter. Vogt et al. (2013) suggest that the northern side of the galaxy disk is facing us with the central starburst obscured by a dust lane, and that while the outflowing starburst wind has inflated bubbles on both sides of the disk, the northern bubble is better confined by the surrounding neutral gas and therefore more compact. The Chandra X-ray images are consistent with this picture, and we also see 610 MHz emission extending 30′′ north and south of the galactic disk. In the south this is clearly correlated with the X-ray (and H) emission, but on the north side of the galaxy the radio source extends furthest to the northeast and is less clearly correlated with the X-ray emission. The connection between the starburst winds and the surrounding IGM is discussed in paper II.
Extracting spectra from a 25′′ radius circular region, we find that all five ObsIDs can be adequately modelled by either a two-temperature thermal plasma, or a low-temperature thermal model plus a powerlaw. As expected, there is no indication of significant luminosity variation with time. Best-fitting parameters for both models are listed in Table 7 and APEC plus powerlaw model fit to all five spectra is shown in Figure 7. We find a temperature for the soft component 0.2 keV hotter than the TRP01 estimate (4.5 significant), and a low abundance, Z0.16. While we might expect a high metallicity in a galactic wind driven by supernovae, it will be diluted by entrainment and mixing with less enriched cold gas. Our measurements may be biased low by the multiphase nature the wind, since a single-temperature model will typically underestimate the abundance of multi-temperature gas around 1 keV (the “Fe bias”, Buote & Fabian, 1998; Buote, 2000). As suggested by TRP01, the spectrally hard component probably arises from young high-mass X-ray binaries formed in the star formation episodes, while the soft component is primarily the hot gas of the starburst wind.
To examine the temperature structure of the wind we divided the emission into strips with widths of 5, 10, and 15′′ (chosen to include a few hundred counts) and extracted spectra from all five observations. A 5′′ width strip was placed at the optical centroid of the galaxy, and includes the majority of the hard (2-7 keV) emission. Figure 6 shows these regions. We fitted each region with an APEC or (in the central region) APEC+powerlaw model, either allowing abundance to fit freely or fixing it at 0.3. The results of these fits for the thermal component are shown in Table 8. Although the models are under-constrained in some cases (reduced ), the fits suggest that the wind has a fairly consistent temperature of 0.7-0.8 keV, falling to 0.3 keV (a 4.4 significant decline) in the outer part of the more extended southern outflow.
| Region | Abundance free | Abundance=0.3 | |||
|---|---|---|---|---|---|
| kT | Abund. | red. /dof | kT | red. /d.o.f. | |
| (keV) | () | (keV) | |||
| Central | 0.92 | 0.14 | 1.28/101 | 0.92 | 1.26/102 |
| North 1 | 0.790.02 | 0.080.01 | 1.34/92 | 0.810.02 | 2.41/93 |
| South 1 | 0.74 | 0.060.03 | 0.67/23 | 0.810.04 | 1.47/24 |
| South 2 | 0.30 | 0.03 | 0.57/9 | 0.75 | 1.36/10 |
The APEC thermal plasma model assumes collisional ionisation equilibrium, which may not hold in a complex, rapidly expanding galaxy wind (e.g., Breitschwerdt, 2003). We therefore test the impact of using a non-equilibrium ionisation (NEI) model instead of APEC in our fits. In general the NEI model produces similar temperatures, abundances and fit statistics. Where significant differences are found (e.g., in the North 1 bin where the best fit NEI temperature is 0.700.02 keV) the NEI model produces a poorer fit to the data (reduced =1.479). We therefore conclude that, while the wind gas is likely to be out of collisional equilibrium in some regions, our results are unlikely to be significantly effected. Deeper observations would be required to probe the equilibrium state of the wind.
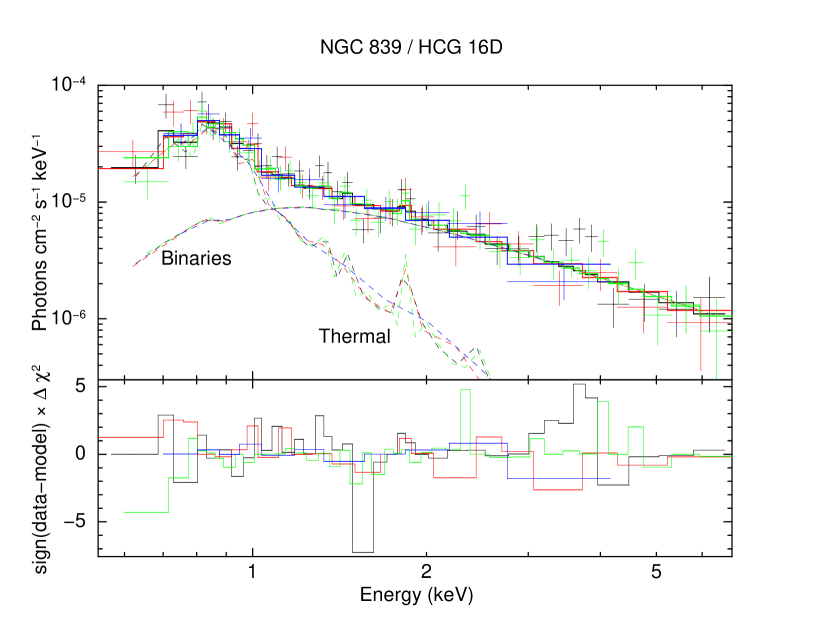
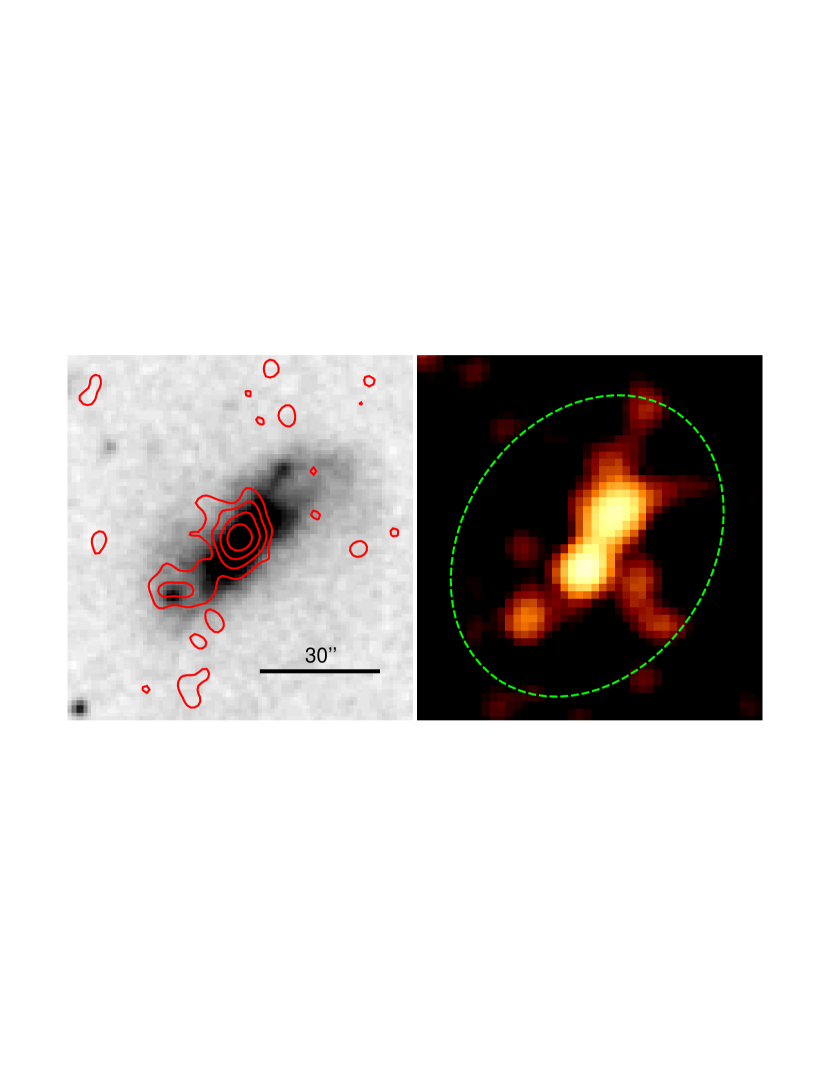
4.5. NGC 839 / HCG 16D
NGC 839 is the second LIRG in HCG 16, and has also been classified as a LINER-2 (de Carvalho & Coziol, 1999), though deep optical integral field spectroscopy suggests that the LINER emission arises from shock excitation in an outflowing starburst wind (Rich et al., 2010). This wind is visible as a biconical polar outflow in H emission, and stellar population modelling shows that the galaxy contains a sizable population of A stars, indicating a starburst age of 400 Myr. TRP01 show that the XMM spectrum is best fit by a model including a fairly heavily absorbed powerlaw, and conclude that an active nucleus is present. Our GMRT 610 MHz observation detects only an unresolved source coincident with the galaxy centroid.
The galaxy is outside the field of view of ObsID 10394, but we extract spectra from the other four observations, using the regions shown in Figure 8. We initially extract a spectrum excluding the central point source, and find that this is well fitted by an APEC plus powerlaw model, representing the thermal emission from the galactic wind, and the X-ray binary population. Applying this model to the spectra for the whole galaxy, we find that the emission from the central point source is best modelled by a second, intrinsically absorbed powerlaw.
However, we find that the emission from the galaxy as a whole (including the central point source) can also be well modelled using an APEC component and a single intrinsically-absorbed powerlaw. This model fit is shown in Figure 9. The fact that the hard component of the spectra can be modelled by a single absorbed powerlaw component suggests the possibility that it could be dominated by emission from an AGN, or that the X-ray binary population dominates and the AGN emission is negligible. In either case, the model requires a significant absorption column within the galaxy. Parameters for both fits are listed in Table 7. The abundance of the thermal component is poorly constrained and is therefore fixed at 0.3 in both fits.
Our best fitting temperature is somewhat higher than that found by TRP01 (0.880.05 or 0.79 compared to 0.630.10). The powerlaw index is consistent with the value found by TRP01 (1.85 or 1.67 compared to 2.10.8) but we find a much lower absorbing column, [0.92] or [0.47]1022 compared to their best fitting value of [4520]1022. We will discuss the origin of the powerlaw emission, and the question of whether NGC 839 hosts an AGN, in Section 6.5
As with NGC 838, there is enough diffuse emission from the wind regions north and south of the galaxy core to allow (crude) spectral fitting. We divide the galaxy into three regions (8 and 16′′ wide strips), fitting the core with the model described above, and the wind regions with an absorbed APEC thermal plasma model. The wind emission is too faint to constrain abundance and we therefore fix it at 0.3. The parameters of the thermal components of the fits are listed in Table 9.
| Region | kT | red. /d.o.f. |
|---|---|---|
| (keV) | ||
| Central | 0.92 | 0.922/74 |
| North | 1.24 | 1.652/8 |
| South | 0.94 | 0.701/7 |
| North+South | 0.990.07 | 1.183/17 |
Note. — Abundance fixed at 0.3 in all fits.
4.6. NGC 848
NGC 848 lies 15′ from the group core, 11.5′ southeast of NGC 839, but is linked to the four main galaxies by the filament (Verdes-Montenegro et al., 2001). It is a peculiar barred spiral galaxy hosting a starburst (Contini et al., 1998), and is only visible on the ACIS-S1 CCD of observation 923. There is a clear detection of emission from the galaxy, apparently extended along the galactic bar (see Figure 10) though the large off-axis angle means that individual sources cannot be resolved.
We extract a spectrum from the S1 data using an elliptical source region corresponding to the optical contour of the galaxy, and a background spectrum from an annulus centred on the galaxy with radii 1.75′ and 3.5′. The effective exposure is short enough that even a simple absorbed powerlaw model is under-constrained, with reduced =0.586 for 5 degrees of freedom. The best fitting parameters of this model are listed in Table 7. The powerlaw index, =1.65, is consistent with emission from X-ray binaries, but is also consistent with emission from a LINER or Seyfert nucleus (e.g., Gu & Cao, 2009). However, comparison with the optical and radio images shows that the galaxy core is located between the two most luminous clumps of X-ray emission, indicating that any X-ray emission from an AGN is weak compared to the emission associated with star formation and the X-ray binary population. The spectral model gives luminosity =2.121040 at our adopted distance for the group. An APEC thermal model provides a fit of similar quality, but the temperature is unphysical (kT=5.1 keV), suggesting there is relatively little hot gas in the galaxy. Fixing the temperature to kT=0.5 keV and the abundance to Z=0.3, we can place a 3 upper limit on the flux from any thermal component of 1.3810-14 (5.271039), fainter than the thermal emission from any of the other major group members except NGC 833. The GMRT 610 MHz image shows a marginally extended central source, with an extension to the southeast that appears to correspond to an unidentified optical source. This may be a foreground star or background AGN.
5. Stellar Population Modelling
The Sloan Digital Sky Survey partially covers HCG 16, and optical spectra of the cores of NGC 833 and NGC 838 are available as part of Data Release 10 (SDSS-DR10, Ahn et al., 2014). We analysed these spectra and estimated the ages, metallicities, and mass of the stellar populations using the spectral fitting code STARLIGHT (Cid Fernandes et al., 2005). STARLIGHT fits the observed spectrum with a combination of simple stellar population (SSP) models covering a range of ages and metallicities. The code returns the contribution, as a fraction of total stellar mass, from each basis SSP. Before running the code, the observed spectra are corrected for foreground extinction and de-redshifted, and the models are degraded to match the wavelength-dependent resolution of the spectrum of each galaxy, as described in La Barbera et al. (2010).
In order to check the model-dependency of the stellar population properties we used two sets of SSP models. One of them is based on the Medium resolution INT Library of Empirical Spectra (MILES, Sánchez-Blázquez et al., 2006), using the updated version 9.1 (Falcón-Barroso et al., 2011) of the code presented in Vazdekis et al. (2010). We selected models computed with Kroupa (2001) universal initial mass function (IMF) and isochrones by Girardi et al. (2000). We also used Bruzual & Charlot (2003, BC03) models, calculated with Padova 1994 evolutionary tracks (Girardi et al., 1996) and with Chabrier (2003) IMF. The basis grids cover ages in the range Gyr for MILES models and Gyr for BC03 models, with constant steps of 0.2. We selected SSPs with metallicities [M/H] =.
For NGC 833, we adopted the Cardelli et al. (1989) extinction law (). NGC 838 contains several dust lanes, and we adopted the Calzetti et al. (2000) law (), which is more suitable for starburst galaxies. We also allowed stellar populations younger than Gyr to have an extra extinction in relation to the older populations. The stellar masses – computed within the fiber aperture – are corrected to the full extent of the galaxy by computing the difference between fiber and model magnitudes in the band. However, we note that this correction is only approximate, since the stellar population in the fiber aperture is probably not representative of the galaxy as a whole.
In NGC 833, we find that the galaxy is dominated by an old stellar population (mass-weighted age 10 Gyr for MILES and 13.5 Gyr for BC03), with a young component making up 0.01% of the stellar mass. The age of the young component is dependent on the models used, with star formation beginning 300 Myr ago for MILES and 50 Myr ago for BC03. However, in both cases the star formation rates are small (1-3) and continue to the lower age limit of the basis grid. The fits suggest a total stellar mass for the galaxy of 1-41011 (in rough agreement with luminosity based estimates, see Section 6.2), and metallicity [M/Fe]=0.02-0.22.
For NGC 838, the properties of the stellar population are much more sensitive to the choices made in the spectral fitting. Depending on the models and extinction law adopted, the mass-weighted age varies from 5 to 11 Gyr, metallicity varies across the range [M/Fe]=-1.2 to [M/Fe=+0.3, and stellar masses derived with BC03 models are a factor 10 greater than those derived from MILES models. The MILES fits find that 30-50% of the stars in the fiber aperture were formed in a burst starting 300 Myr ago, with SFR 15-50. The BC03 fits suggest a much smaller young component (2% by mass) formed in a burst starting 50 Myr ago and continuing to the present, with SFR 50-80, and an extended star-formation history for the old stellar component, continuing as late as 2 Gyr ago.
Figure 11 shows the results of two fits to the NGC 838 spectrum using the MILES and BC03 models, compared with fits to the same spectrum from the Versatile Spectral Analysis database (VESPA, Tojeiro et al., 2009). VESPA fits use either the BC03 models or the models of Maraston (2005), and for the young population these produce similar results to our BC03 fits. However, they differ in finding little evidence of an extended period of formation for the old population.
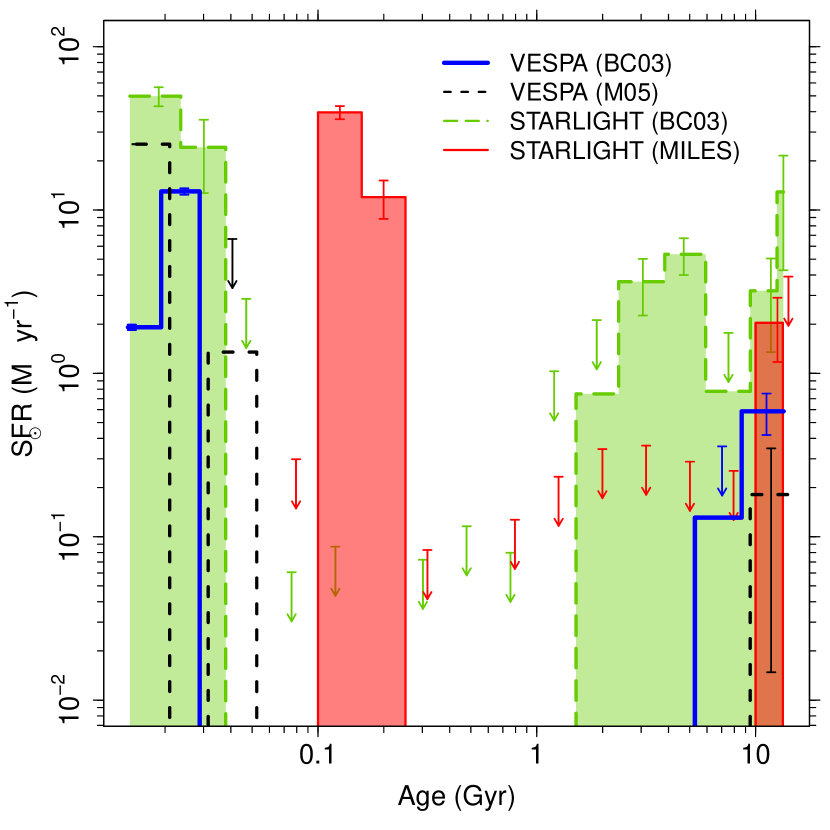
To test the reliability of the STARLIGHT fits, we simulated spectra based on the BC03 and MILES modelling results. For each of the the two best-fitting model, 100 spectra were simulated and noise was added to acheive a signal-to-noise ratio of 60, matching that of the observed spectrum. Each simulated spectrum was then fitted using the STARLIGHT code, and the results of the fits used to estimate the 1 uncertainty on the SFR in each age bin, shown as errorbars in Figure 11. Where the 1 uncertainty was consistent with zero, show the 1 upper limit on SFR. These uncertainties indicate that the general picture of the star formation history presented by each set of fits is fairly robust, and that even quite low SFRs (0.1) are unlikely in the 300 Myr-1 Gyr age range.
We must also consider previous observations of NGC 838, which show that the stellar population in the galaxy core is probably not representative of the galaxy as a whole. While Vogt et al. (2013) did not fit SSP models to their integral field spectra of NGC 838, they did examine those spectra for simple age indicators. Examining spectra from the core and disk they found that both regions have similar absorption features typical of a young, A-type stellar population with an age 500 Myr post-starburst, but that the core has a much stronger blue continuum, indicative of an O/B-type stellar population consistent with very recent/ongoing star formation. They conclude that the galaxy underwent a galaxy-wide star formation episode starting 500 Myr ago, but that star formation rates have declined with time and activity is now restricted to the core. Our BC03 fits (and the VESPA results) agree with Vogt et al. in finding ongoing star formation in the core, and suggest that it began 50 Myr ago. Our MILES fit suggests that star formation began in the core as early as 300 Myr ago, but does not find it to be ongoing. However, since the SDSS spectrum only samples the core, we cannot compare our age estimates with the overall burst age estimated by Vogt et al. based on spectra from the disk of the galaxy. We therefore adopt their burst age of 500 Myr, with the caveat that star formation probably began more recently in the galaxy core. High-resolution optical spectra from elsewhere in NGC 838 would be required to more accurately measure the burst age.
6. Discussion
6.1. Point Sources
Tzanavaris et al. (2014) have used ObsID 923 to examine the point source population in and around the four original group members. Eight of their sources are located within our adopted regions, including the cores of NGC 833, NGC 835 and NGC 839, and several sources in NGC 838. In general our results agree well with theirs for the brighter sources, though our ability to model the spectra of the absorbed AGN naturally produces more accurate powerlaw spectral indices. We find somewhat lower luminosities for the faintest sources, and fail to detect their source 46, probably owing to the different flux extraction methods and background regions used.
6.2. Gas content of the galaxies
Table 10 shows our estimates of the density and mass of the gas in the four main galaxies. We estimate the electron number density of the hot gas () from the spectral fits described in section 4. The core region of NGC 833 is reasonably well described by a spherical -model with =4.1 kpc and =0.51, and we estimate the gas mass from this model and the normalisation of the APEC model. The core of NGC 835 is not well described by a single -model (or even two), so to reduce the bias arising from assuming a constant mean density in a volume where density actually varies, we break it into two spectral regions, a central cylinder of length 3.1 kpc and radius 0.97 kpc aligned north-south, and the remaining 15′′ (4.1 kpc) radius sphere. For the diffuse emission in the disks of the two galaxies we approximate the volume as a rectangular slab with projected area equal to that of the polygon region used for spectral extraction, 1344 kpc and depth 10 kpc. The third row of Table 10 shows results summed over all three regions in the NGC 833/835 complex. The gas density outside the galaxy cores is 1.5810-3.
| Galaxy | log | log | / | / | |||||
|---|---|---|---|---|---|---|---|---|---|
| () | () | (109) | (10-2) | (108) | (1010) | (1010) | (10-3) | (10-3) | |
| NGC 833 | 11.06 | 10.99 | 0.79 | 0.80 | 0.61 | 7.46 | 4.83 | 0.62 | 11.21 |
| NGC 835 | 11.27 | 11.28 | 1.17 | 2.151.29 | 0.640.36 | 12.10 | 9.62 | 1.03 | 10.70 |
| NGC 833+NGC 835 | 11.48 | 11.45 | 1.96 | - | 3.57 | 19.56 | 14.45 | 1.83 | 13.19 |
| NGC 838 | 10.95 | 11.17 | 3.02 | 2.27 | 2.57 | 5.79 | 7.40 | 4.43 | 56.60 |
| NGC 839 | 10.92 | 11.03 | 4.47 | 1.86 | 0.410.15 | 5.41 | 5.36 | 0.76 | 83.38 |
| NGC 848 | 10.67 | - | 0.77 | - | - | 3.04 | - | - | 25.33 |
In NGC 838 the diffuse emission is primarily located in the inner part of the galaxy or in the southern wind region. We approximate these two volumes as an oblate ellipsoid with radii 18.7′′ and 10.1′′ (5.1 and 2.76 kpc) and a conical section of a spherical shell with opening angle 43∘ and radii 25.5′′ and 47′′ (7.0 and 12.8 kpc). While the conical geometry of the wind in NGC 839 is obvious in H (Rich et al., 2010) in the X-ray it is less clear, and most of the wind and galaxy disk emission can be enclosed in a 1530′′ box, suggesting a cylindrical geometry.
Estimating the stellar mass of the major galaxies from their -band and 3.6m luminosities (adopting stellar mass-to-light ratios from Eskew et al., 2012; McGaugh & Schombert, 2014) we find that, within the immediate boundaries of the galaxies, the typical hot-gas-to-stellar mass ratio is 10-3, with the starburst superwind galaxy NGC 838 having the highest ratio. However NGC 835 contains the largest quantity of hot gas (2.57108), perhaps unsurprising since it has the highest stellar mass of the four. There is an order of magnitude more cold than hot gas in the galaxies, giving total gas-to-stellar mass ratios 1% for all five galaxies.
We can estimate approximate isobaric cooling times for the hot gas in the galaxies, and find values of 1.4 Gyr and 1.8 Gyr for NGC 839 and NGC 838 respectively. This suggests that little of the gas in these galaxy winds is likely to have cooled out of the X-ray regime. However, if cooling via mixing with colder entrained gas dominates over radiative cooling, the true cooling times will be shorter.
We estimate outflow rates for the two superwind galaxies based on the geometries adopted above and an assumed outflow velocity. The only direct measurement of outflow velocity comes from line splitting in the optical spectra of NGC 839 which, accounting for the inclination of the galaxy and opening angle of the conical H wind structure, suggests a wind velocity 250 (Rich et al., 2010). This suggests an outflow of 2.5 of hot gas in NGC 839. Vogt et al. (2013) suggest, based on the size of the wind-blown bubbles in NGC 838, that these structures are 5-50 Myr old with an outflow velocity of 130-1300. If we assume a wind velocity similar to that in NGC 839, the bubbles would be 27 Myr old. The outflow rate of hot gas is then 17.
As star formation seems to have peaked in the two galaxies 400-500 Myr ago, and declined since then, these rates are likely underestimates of the average outflow over that period. However, if we assume outflows at these rates over this timescale, we find that the two galaxies may have ejected 9.5109 of hot gas. This value exceeds the mass of the galaxies (and the hot gas mass in the surrounding region, see paper II), suggesting either that the outflow rates are overestimated, or that gas infall is replenishing the galaxies. The outflow velocity measured in NGC 839 (250, Rich et al., 2010) is greater than the escape velocity of the galaxy (200, based on the stellar and gaseous rotation velocities, Mendes de Oliveira et al., 1998) but only by 20%, suggesting that not all of the wind material will escape. The two galaxies are also embedded in the filament, which is likely to impede outflows and may be responsible for containing the bubbles seen in NGC 838. This may increase the fraction of outflowing gas which falls back into the galaxy and is cooled and recycled. However, as we argue in paper II, the morphology of the winds and of the surrounding diffuse emission suggests that at least part of their outflows do escape and contribute to the intra-group medium.
6.3. Star Formation Rates
The star formation rates (SFRs) in the group member galaxies can be estimated both from our X-ray and radio data, and from measurements in the infra-red (IR) and ultra-violet (UV). The hard component of X-ray emission in star forming galaxies arises primarily from high mass X-ray binaries, formed from massive stars with short lifespans. It is therefore closely linked to recent star formation, but not the current rate, since some time is required for one member of each binary to evolve into a compact object. Fragos et al. (2013) suggest that the HMXB population is related to star formation over the previous 2-100 Myr, but there is significant scatter in the relationship. UV and IR measurements probe star formation via the most massive, shortest-lived stars, and so may give a more accurate estimate of the current star formation rate.
We use the :SFR relation of Mineo et al. (2012) to estimate star formation rates from the 0.5-8 keV luminosity of the X-ray binary population of each galaxy, as determined from the powerlaw component of the galaxy emission from the best fitting models described in section 4, and including contributions from individual point sources described in section 3. We exclude the probable background sources (numbers 11 and 16), and the nuclear sources (3, 12 and 14). Since individual ULXs may contribute a significant fraction of the hard X-ray luminosity of an entire galaxy we calculate two star formation rates for those galaxies containing ULX candidates, one including the ULX contribution to luminosity, one with ULXs excluded. These estimates are shown in Table 11. In NGC 838 and NGC 839 the estimates are complicated by the question of whether the galaxies host AGN. The evidence suggests that source 3 in NGC 838 is probably an AGN, but if it were a ULX it would increase the total SFR estimate for the galaxy to 16.68. As we will argue in Section 6.5, NGC 839 probably does not host an AGN, and we base our SFR estimate on the AP+abs.PL model. If we instead assume an AGN is present and use the luminosity of the unabsorbed powerlaw in the AP+PL+abs.PL model to estimate SFR, we obtain a value of 8.740.74.
To estimate star formation rates from the radio luminosity, we use the :SFR relation of Bell (2003). The GMRT 610 MHz data has sufficient resolution for us to see that the AGN dominates the radio emission in NGC 833 and for us to separate the central point source from the extended star-formation emission in NGC 835. In NGC 838, the 610 MHz image shows diffuse emission coincident with the wind bubbles north and south of the galaxy, and we subtract this flux, which seems likely to be associated with past rather than recent star formation. Where necessary we convert 610 MHz to 1.4 GHz fluxes using either the observed spectral index (0.5-0.8 in NGC 838, NGC 839 and NGC 848) or a canonical value of 0.5 (for NGC 835). The resulting SFR estimates are shown in Table 11. As expected, NGC 838 and NGC 839 have the highest SFRs (12.05 and 20.09 respectively), NGC 848 has a moderately enhanced rate of 8.76, while NGC 833 and NGC 835 have rates of 3(all including ULXs).
| Estimator | SFR () | ||||
|---|---|---|---|---|---|
| NGC 833 | NGC 835 | NGC 838 | NGC 839 | NGC 848 | |
| X-ray (incl. ULXs) | 3.30 | 3.14 | 12.05 | 20.09 | 8.76 |
| X-ray (excl. ULXs) | 2.90 | 1.71 | 10.51 | - | - |
| Radio | - | 2.490.30 | 16.871.03 | 7.900.40 | 2.040.21 |
| SSP | 1-3 | - | 15-80 | - | - |
| 24ma | 0.07 | 1.74 | 7.24 | 9.55 | - |
| UV/IRb | 5.370.62 | 0.330.03 | 14.381.83 | 17.062.31 | - |
Note. — a: from Brassington et al. (2014, submitted).
b: from Tzanavaris et al. (2010).
For comparison, we draw on two studies in the IR and UV: Tzanavaris et al. (2010), who estimate SFRs using a combination of Spitzer 24m and Swift -band luminosities, and Brassington et al. (2014, submitted), who use only Spitzer data, but use an updated :SFR relation which is more accurate at the high luminosities seen in starburst galaxies. Neither study includes NGC 848. We also include estimates of the recent star formation rates from the SSP models described in Section 5.
Although it is clear that the different estimators identify NGC 838 and NGC 839 as the most actively star forming systems in HCG 16, there is a significant degree of divergence among the actual SFR values. The SSP estimate for NGC 833 is in general agreement with the other estimators, though somewhat higher than the Brassington et al. value. The lower end of the range of SFRs estimated from the SSP modelling of NGC 838 is in agreement with the other estimates (though again higher than the Brassington et al. result) but the upper limit greatly exceeds any of the other estimates. Neither our BC03 or MILES model fits agree with the other SFR estimates in detail; BC03 predicts current SFRs a factor 4.5 higher than the other estimators, while the MILES models suggest that star formation ended 100 Myr ago. The best agreement is seen between the Tzanavaris et al. estimates for NGC 838 and NGC 839, and our X-ray estimates. However, the Tzanavaris rates are a factor 2 higher than those found by Brassington et al., which should be more accurate. Removing the contribution of ULXs brings our X-ray estimates into line with the Brassington et al. estimates for NGC 835 and NGC 838. In NGC 839 our radio estimate is closest to the Brassington et al. estimate, while in NGC 838 it is closer to the Tzanavaris estimate. Brassington et al. find that both NGC 833 and NGC 835 have quite low star formation rates, 0.07 and 1.74 respectively. The star forming ring in NGC 835 is probably the main cause of the difference between the two galaxies. If the Brassington et al. estimates are correct, our X-ray estimates (and except in the case of NGC 838, radio estimates) generally overpredict the current SFR (particularly when ULXs are included) suggesting that all four original compact group member galaxies were significantly more active in forming stars over the past 108 yr than they are now. This would agree with the results of optical studies of NGC 838 and NGC 839 (Vogt et al., 2013; Rich et al., 2010).
6.4. Comparison with other star forming galaxies
There is an extensive literature on star forming and starburst galaxies and their winds, and comparison of NGC 838 and NGC 839 with population studies offers the possibility of better understanding their physical state and relationship to their environment. The sample of Li & Wang (2013) provides a good basis for comparison. It consists of 53 nearby, highly inclined disk galaxies selected to be star formation dominated with little or no AGN contribution, all of which were observed with Chandra.
We follow Li & Wang in estimating three further parameters: 1) the total supernova mechanical energy injection rate, . This includes type Ia supernovae, with a rate estimated based on the stellar mass (Mannucci et al., 2005) as well as core collapse supernovae with a rate based on the SFR (Heckman et al., 1990), and assumes 1051 erg per supernova; 2) the X-ray radiation efficiency, , defined as the 0.5-2 keV gas luminosity divided by ; 3) the surface rate of core collapse (CC) supernovae, , defined as the number of supernovae divided by the area of the galactic disk, determined from its . We find values of =1.71042 and =2.4% for NGC 838, and =2.41042 and =0.4% for NGC 839. The difference in X-ray radiation efficiency is interesting, and is clearly caused by the larger mass of hot gas retained by NGC 838. Li & Wang show that NGC 838 has a high , at the upper end of the range seen in star-forming or starburst systems, and is among the most X-ray luminous systems with comparable supernova energy injection rates. NGC 839 is apparently a more typical starburst.
The surface rate of CC supernovae provides information on the ability of star formation to launch a wind out of the galactic disk. Strickland et al. (2004) showed that there is a critical value of =25 SN Myr-1 kpc-2 above which superbubble blowout becomes possible. As expected, both our galaxies fall well above this limit, with 150 SN Myr-1 kpc-2. However, comparing these values with the : relation established by Li & Wang, we again find that NGC 838 is an outlier, with an efficiency well above that expected for its surface rate of CC supernovae. NGC 839 falls on the best-fitting relation. Both NGC 838 and NGC 839 have relatively high gas temperatures for their X-ray luminosity and star formation rate, at the outer edge of the scatter in these properties across the galaxy population.
The morphology of the two galactic winds may provide an indication of the cause of the difference in radiative efficiency between the two. In NGC 838, the wind appears to be largely confined by the surrounding IGM, forming two large (possibly leaking) bubbles. Conversely, the wind in NGC 839 is conical and apparently unconfined. It seems plausible that because of this confinement, NGC 838 has retained more gas and maintained a higher X-ray luminosity. NGC 839 has a higher star formation rate, but a lower hot gas content, suggesting that its wind has been able to escape the galaxy, mixing with the surrounding IGM and cooling. This difference has implications for the future development of the two galaxies, with NGC 838 potentially building up an enhanced metallicity and stellar fraction compared to NGC 839. It is unclear why the NGC 838 wind is confined when NGC 839 is not. Their specific star formation rates only differ by a factor 1.4-1.8 (depending on the band used to estimate stellar mass). Both galaxies lie in the densest part of the filament, and of the hot IGM (see paper II), and observationally this seems the most likely factor in determining the difference in their properties.
6.5. Does NGC 839 / HCG 16D host an active nucleus?
While early optical spectroscopic studies of NGC 839 found evidence of a LINER or Seyfert nucleus (de Carvalho & Coziol, 1999), more recent integral-field spectroscopy shows that the LINER-like line ratios are found in an extended region and are more likely to arise from shock-excitation of gas in the outflowing galactic superwind (Rich et al., 2010). However, TRP01 classify the galaxy as hosting an absorbed AGN, based on a spectral fit to the first light XMM EPIC-MOS spectra which is dominated by an absorbed powerlaw component at energies above 2 keV. Our deep Chandra observations offer an opportunity to resolve this apparent conflict.
We find that the Chandra spectra for the galaxy as a whole can be described either by a thermal model with a single intrinsically absorbed powerlaw, or by a combination of a thermal component, an unabsorbed powerlaw representing the X-ray binary population, and an intrinsically absorbed powerlaw representing an AGN. The two component model is a marginally better fit than the three component model, but both are good fits to the data (reduced =0.991 or 1.039). The powerlaw indices in both models are consistent with either AGN or X-ray binaries. Since we are viewing HCG 839 almost edge-on (=67∘), emission from the central regions of the galaxy is likely to be absorbed by dust and gas in the disk, so the intrinsic absorption seen in the two component model could be consistent with either an AGN or X-ray binaries. As discussed in Section 6.3, we can estimate the star formation rate in the galaxy over the past 100 Myr based on the luminosity of the HMXB population. The two component model implies SFR=20.09, while the three component model suggests SFR=8.740.74. The lower rate is more consistent with the estimated rate of Brassington et al., based on the Spitzer 24m flux. The higher rate is closer to the estimated rate of Tzanavaris et al., and since NGC 839 appears to have hosted more extensive star formation in the past few 108 yr, with star formation rates declining to their current level, a high X-ray star formation rate estimate might be expected, owing to a larger population of high-mass X-ray binaries.
Imaging the galaxy in the 2-7 keV band reveals a 52.5′′ ellipsoidal distribution aligned with the galaxy disk, with no clear central point source. To model this hard band emission, we made a 2-7 keV image from the combined 2013 observations, covering a 1′ region centred on the galaxy. We convolved all models with an appropriate exposure map and PSF. The image is well fitted using a constant background and an elliptical model to represent the source emission. Best fitting parameters were =2.34′′, =1.09 and ellipticity=0.470.04. If we add a point source to represent an AGN and allow its position to vary freely, the fit rejects the extra component, moving it out of the image. If the position is fixed at the centre of the model, it provides 12.2 per cent of the 2-7 keV flux; even with a fixed position, the point source contribution is consistent with zero at the 2 level.
In summary, the X-ray data alone do not conclusively rule out an AGN in NGC 839, but suggest that the AGN contribution is probably weak if it is present. Combined with the probability that the optical LINER emission arises from shocks in the galactic superwind, this suggests that the majority of spectrally hard X-ray emission in NGC 839 arises from its X-ray binary population.
6.6. Galaxy interactions as the trigger for nuclear activity and star formation
The presence of the diffuse filament, combined with the deficiency estimates, demonstrates that tidal interactions have transported gas out of the four original group members. Based on the morphology, it seems plausible that a series of encounters produced a cloud of surrounding those four galaxies, which was then drawn out and elongated into a filament by the passage of NGC 848 through the group core. The motion of NGC 833/NGC 835 may also have helped extend the filament to the northwest.
NGC 848 must have passed close to the other galaxies to have produced the observed filament, and this raises the question of whether tidal forces associated with its passage might be responsible for some of the activity we observe. The estimated ages of the starbursts in NGC 838 (Vogt et al., 2013, 500 Myr) and NGC 839 (Rich et al., 2010, 400 Myr) suggest the possibility that these two starbursts were triggered in sequence, as NGC 848 passed by from northwest to southeast. In such a scenario, the star formation in NGC 848 could also have been triggered by these encounters.
It is less clear whether NGC 848 could have triggered star formation in NGC 833 and NGC 835. The ongoing interaction between NGC 833 and NGC 835 is probably sufficient to explain their nuclear activity. If we estimate a velocity in the plane of the sky for NGC 848 based on the star formation timescales, we find that we would expect it to have passed NGC 833 600 Myr ago. A starburst of the magnitude seen in NGC 838 or NGC 839, but 100 Myr older, should be clearly detected in the SDSS spectrum of NGC 833, and ought to be obvious from optical colours in NGC 835. However, NGC 833 and NGC 835 are both 80% deficient and are located in a lower density region of the filament than NGC 838 and NGC 839. If both galaxies lost most of their cold gas before the interaction, it is possible that any triggered star formation was weak, short-lived, and largely limited to NGC 835. Alternatively, NGC 848 may not have passed close enough to them to trigger a starburst.
7. Conclusions
HCG 16 forms an excellent natural laboratory in which to study the effects of star formation and nuclear activity driven by the tidal interactions which are common in compact groups. Combining deep, high spatial-resolution Chandra X-ray observations with VLA and GMRT radio data, we have examined the five major galaxy members with the goal of determining the nature of their present activity and its connection to the group environment. Our results can be summarised as follows:
-
1.
We identify eighteen point-like X-ray sources in and around the four original group member galaxies. Three of these are previously known sources associated with galactic nuclei, and one is probably a clump of gas in the starburst superwind of NGC 838. Two sources are located along the line of sight to background galaxies, consistent with our expectation of finding 2-3 background sources in the area of interest. The remaining twelve sources all appear to be associated with the group member galaxies, and five have luminosities 1039, making them candidate ultra-luminous X-ray sources (ULXs). One of the brightest point sources is found to be variable at 3 significance, is best described by a powerlaw spectral model with flat photon index (=0.860.23), and is located 1′′ from the optical centroid of NGC 838 (HCG 16C). We therefore suggest that this source may be a previously unidentified active nucleus.
-
2.
We examine the X-ray spectra of NGC 833 and NGC 835 (HCG 16B and A) and confirm the previous finding that they host obscured AGN. SSP modelling of the SDSS spectrum of NGC 833 shows that little or no recent star formation has occurred in the galaxy. We use the excellent spatial resolution of Chandra to separate nuclear and galactic emission, and find that powerlaw emission previously thought to be scattered from the nuclei is more likely to arise from the X-ray binary populations of the two galaxies. The AGN components of both galaxies are found to be variable on timescales of months to years (between Chandra observations), and we find evidence that this variability is best modelled as a change in the intrinsic luminosity of the AGN, and therefore probably of the accretion rate, rather than as a change in the optical depth of the absorber. We identify an Fe-K emission line in NGC 835 with energy 6.410.05 keV and width 10050 eV.
-
3.
We find that NGC 838 and NGC 839 (HCG 16C and D) are probably both starburst-dominated systems, with minimal nuclear activity. Whereas previous X-ray studies have found evidence of an obscured AGN in NGC 839, in conflict with optical spectroscopy suggesting that LINER emission is produced by shocks in the galactic superwind, we find that the spectrally hard X-ray emission component is likely produced by the X-ray binary population of the galaxy and absorbed by gas and dust in the galactic disk. Both galaxies have mean temperatures 0.8 keV, and in NGC 838 we are able to constrain the abundance to 0.16. However, this is likely biased low owing to mass loading of the wind with cold gas, and the wide range of temperatures in the hot phase of the wind. We examine the X-ray temperature structures of the winds and estimate the mass of hot gas involved and the rates of outflow. We also estimate the star formation rates of the galaxies from both X-ray and radio luminosities, and compare these to infra-red and ultra-violet estimates, finding that the X-ray rates probably better represent the SFRs in the recent past. The NGC 838 wind appears to be confined by the surrounding filament and/or IGM, retaining more of its gas than has NGC 839. This has the potential to affect the development of the galaxy, with NGC 838 likely to have a higher metallicity and stellar fraction than NGC 839 in future.
-
4.
We examine the X-ray and radio properties of NGC 848, the fifth largest galaxy in the group, using data from Chandra cycle 1, in which the galaxy falls 15′ off-axis. We find that the X-ray emission follows the optical bar and is best modelled by a simple powerlaw, suggesting that this starburst galaxy is dominated by emission from its X-ray binary population. The radio emission is more centrally concentrated, and may arise either from star formation or an AGN.
References
- Ahn et al. (2014) Ahn, C. P., Alexandroff, R., Allende Prieto, C., Anders, F., Anderson, S. F., Anderton, T., Andrews, B. H., Aubourg, É., Bailey, S., Bastien, F. A., & et al. 2014, ApJS, 211, 17
- Bahcall et al. (1984) Bahcall, N. A., Harris, D. E., & Rood, H. J. 1984, ApJ, 284, L29
- Bell (2003) Bell, E. F. 2003, ApJ, 586, 794
- Borthakur et al. (2010) Borthakur, S., Yun, M. S., & Verdes-Montenegro, L. 2010, ApJ, 710, 385
- Breitschwerdt (2003) Breitschwerdt, D. 2003, in Revista Mexicana de Astronomia y Astrofisica, vol. 27, Vol. 15, Revista Mexicana de Astronomia y Astrofisica Conference Series, ed. J. Arthur & W. J. Henney, 311
- Bruzual & Charlot (2003) Bruzual, G., & Charlot, S. 2003, MNRAS, 344, 1000
- Buote & Fabian (1998) Buote, D., & Fabian, A. 1998, MNRAS, 296, 977
- Buote (2000) Buote, D. A. 2000, MNRAS, 311, 176
- Calzetti et al. (2000) Calzetti, D., Armus, L., Bohlin, R. C., Kinney, A. L., Koornneef, J., & Storchi-Bergmann, T. 2000, ApJ, 533, 682
- Cappellari et al. (2011) Cappellari, M., Emsellem, E., Krajnović, D., McDermid, R. M., Serra, P., Alatalo, K., Blitz, L., Bois, M., Bournaud, F., Bureau, M., Davies, R. L., Davis, T. A., de Zeeuw, P. T., Khochfar, S., Kuntschner, H., Lablanche, P.-Y., Morganti, R., Naab, T., Oosterloo, T., Sarzi, M., Scott, N., Weijmans, A.-M., & Young, L. M. 2011, MNRAS, 416, 1680
- Cardelli et al. (1989) Cardelli, J. A., Clayton, G. C., & Mathis, J. S. 1989, ApJ, 345, 245
- Chabrier (2003) Chabrier, G. 2003, ApJ, 586, L133
- Cid Fernandes et al. (2005) Cid Fernandes, R., Mateus, A., Sodré, L., Stasińska, G., & Gomes, J. M. 2005, MNRAS, 358, 363
- Contini et al. (1998) Contini, T., Considere, S., & Davoust, E. 1998, A&AS, 130, 285
- de Carvalho & Coziol (1999) de Carvalho, R. R., & Coziol, R. 1999, AJ, 117, 1657
- Dos Santos & Mamon (1999) Dos Santos, S., & Mamon, G. A. 1999, A&A, 352, 1
- Eke et al. (2004) Eke, V. R., Frenk, C. S., Baugh, C. M., Cole, S., Norberg, P., Peacock, J. A., Baldry, I. K., Bland-Hawthorn, J., Bridges, T., Cannon, R., Colless, M., Collins, C., Couch, W., Dalton, G., de Propris, R., Driver, S. P., Efstathiou, G., Ellis, R. S., Glazebrook, K., Jackson, C. A., Lahav, O., Lewis, I., Lumsden, S., Maddox, S. J., Madgwick, D., Peterson, B. A., Sutherland, W., & Taylor, K. 2004, MNRAS, 355, 769
- Eskew et al. (2012) Eskew, M., Zaritsky, D., & Meidt, S. 2012, AJ, 143, 139
- Evans et al. (2010) Evans, I. N., Primini, F. A., Glotfelty, K. J., Anderson, C. S., Bonaventura, N. R., Chen, J. C., Davis, J. E., Doe, S. M., Evans, J. D., Fabbiano, G., Galle, E. C., Gibbs, II, D. G., Grier, J. D., Hain, R. M., Hall, D. M., Harbo, P. N., (Helen He, X., Houck, J. C., Karovska, M., Kashyap, V. L., Lauer, J., McCollough, M. L., McDowell, J. C., Miller, J. B., Mitschang, A. W., Morgan, D. L., Mossman, A. E., Nichols, J. S., Nowak, M. A., Plummer, D. A., Refsdal, B. L., Rots, A. H., Siemiginowska, A., Sundheim, B. A., Tibbetts, M. S., Van Stone, D. W., Winkelman, S. L., & Zografou, P. 2010, ApJS, 189, 37
- Falcón-Barroso et al. (2011) Falcón-Barroso, J., Sánchez-Blázquez, P., Vazdekis, A., Ricciardelli, E., Cardiel, N., Cenarro, A. J., Gorgas, J., & Peletier, R. F. 2011, A&A, 532, A95
- Fragos et al. (2013) Fragos, T., Lehmer, B., Tremmel, M., Tzanavaris, P., Basu-Zych, A., Belczynski, K., Hornschemeier, A., Jenkins, L., Kalogera, V., Ptak, A., & Zezas, A. 2013, ApJ, 764, 41
- Fruscione et al. (2006) Fruscione, A., McDowell, J. C., Allen, G. E., Brickhouse, N. S., Burke, D. J., Davis, J. E., Durham, N., Elvis, M., Galle, E. C., Harris, D. E., Huenemoerder, D. P., Houck, J. C., & et al. 2006, in Observatory Operations: Strategies, Processes, and Systems. Edited by Silva, David R.; Doxsey, Rodger E.. Proceedings of the SPIE, Volume 6270, pp. 62701V (2006). (Bellingham, WA, USA: International Society for Optical Enginerring)
- Giacintucci et al. (2011) Giacintucci, S., O’Sullivan, E., Vrtilek, J. M., David, L. P., Raychaudhury, S., Venturi, T., Athreya, R. M., Clarke, T. E., Murgia, M., Mazzotta, P., Gitti, M., Ponman, T., Ishwara-Chandra, C. H., jones, C., & Forman, W. R. 2011, ApJ, 732, 95
- Girardi et al. (2000) Girardi, L., Bressan, A., Bertelli, G., & Chiosi, C. 2000, A&AS, 141, 371
- Girardi et al. (1996) Girardi, L., Bressan, A., Chiosi, C., Bertelli, G., & Nasi, E. 1996, A&AS, 117, 113
- González-Martín et al. (2006) González-Martín, O., Masegosa, J., Márquez, I., Guerrero, M. A., & Dultzin-Hacyan, D. 2006, A&A, 460, 45
- Grevesse & Sauval (1998) Grevesse, N., & Sauval, A. J. 1998, Space Sci. Rev., 85, 161
- Gu & Cao (2009) Gu, M., & Cao, X. 2009, MNRAS, 399, 349
- Heckman et al. (1990) Heckman, T. M., Armus, L., & Miley, G. K. 1990, ApJS, 74, 833
- Hickson (1982) Hickson, P. 1982, ApJ, 255, 382
- Hickson et al. (1992) Hickson, P., Mendes de Oliveira, C., Huchra, J. P., & Palumbo, G. G. 1992, ApJ, 399, 353
- Jeltema et al. (2008) Jeltema, T. E., Binder, B., & Mulchaey, J. S. 2008, ApJ, 679, 1162
- Johnson et al. (2007) Johnson, K. E., Hibbard, J. E., Gallagher, S. C., Charlton, J. C., Hornschemeier, A. E., Jarrett, T. H., & Reines, A. E. 2007, AJ, 134, 1522
- Kalberla et al. (2005) Kalberla, P. M. W., Burton, W. B., Hartmann, D., Arnal, E. M., Bajaja, E., Morras, R., & Pöppel, W. G. L. 2005, A&A, 440, 775
- Kilborn et al. (2009) Kilborn, V. A., Forbes, D. A., Barnes, D. G., Koribalski, B. S., Brough, S., & Kern, K. 2009, MNRAS, 400, 1962
- Kim et al. (2007) Kim, M., Wilkes, B. J., Kim, D.-W., Green, P. J., Barkhouse, W. A., Lee, M. G., Silverman, J. D., & Tananbaum, H. D. 2007, ApJ, 659, 29
- Konstantopoulos et al. (2010) Konstantopoulos, I. S., Gallagher, S. C., Fedotov, K., Durrell, P. R., Heiderman, A., Elmegreen, D. M., Charlton, J. C., Hibbard, J. E., Tzanavaris, P., Chandar, R., Johnson, K. E., Maybhate, A., Zabludoff, A. E., Gronwall, C., Szathmary, D., Hornschemeier, A. E., English, J., Whitmore, B., Mendes de Oliveira, C., & Mulchaey, J. S. 2010, ApJ, 723, 197
- Konstantopoulos et al. (2013) Konstantopoulos, I. S., Maybhate, A., Charlton, J. C., Fedotov, K., Durrell, P. R., Mulchaey, J. S., English, J., Desjardins, T. D., Gallagher, S. C., Walker, L. M., Johnson, K. E., Tzanavaris, P., & Gronwall, C. 2013, ApJ, 770, 114
- Kroupa (2001) Kroupa, P. 2001, MNRAS, 322, 231
- La Barbera et al. (2010) La Barbera, F., de Carvalho, R. R., de La Rosa, I. G., & Lopes, P. A. A. 2010, MNRAS, 408, 1335
- Li & Wang (2013) Li, J.-T., & Wang, Q. D. 2013, MNRAS, 435, 3071
- Mahajan et al. (2012) Mahajan, S., Raychaudhury, S., & Pimbblet, K. A. 2012, MNRAS, 427, 1252
- Mannucci et al. (2005) Mannucci, F., Della Valle, M., Panagia, N., Cappellaro, E., Cresci, G., Maiolino, R., Petrosian, A., & Turatto, M. 2005, A&A, 433, 807
- Maraston (2005) Maraston, C. 2005, MNRAS, 362, 799
- Martínez et al. (2010) Martínez, M. A., Del Olmo, A., Coziol, R., & Perea, J. 2010, AJ, 139, 1199
- McGaugh & Schombert (2014) McGaugh, S., & Schombert, J. 2014, arXiv:1407.1839
- Mendes de Oliveira et al. (1998) Mendes de Oliveira, C., Plana, H., Amram, P., Bolte, M., & Boulesteix, J. 1998, ApJ, 507, 691
- Mineo et al. (2012) Mineo, S., Gilfanov, M., & Sunyaev, R. 2012, MNRAS, 419, 2095
- Mukai (1993) Mukai, K. 1993, Legacy, vol. 3, p.21-31, 3, 21
- Mulchaey et al. (2003) Mulchaey, J. S., Davis, D. S., Mushotzky, R. F., & Burstein, D. 2003, ApJS, 145, 39
- Osmond & Ponman (2004) Osmond, J. P. F., & Ponman, T. J. 2004, MNRAS, 350, 1511
- O’Sullivan et al. (2007) O’Sullivan, E., Vrtilek, J. M., Harris, D. E., & Ponman, T. J. 2007, ApJ, 658, 299
- O’Sullivan et al. (2014) O’Sullivan, E., Zezas, A., Vrtilek, J. M., Giacintucci, S., David, L. P., Mamon, G. A., Ponman, T. J., & Raychaudhury, S. 2014, ApJ, 793, 74, paper II
- Ponman et al. (1996) Ponman, T. J., Bourner, P. D. J., Ebeling, H., & Bohringer, H. 1996, MNRAS, 283, 690
- Ribeiro et al. (1998) Ribeiro, A. L. B., de Carvalho, R. R., Capelato, H. V., & Zepf, S. E. 1998, ApJ, 497, 72
- Rich et al. (2010) Rich, J. A., Dopita, M. A., Kewley, L. J., & Rupke, D. S. N. 2010, ApJ, 721, 505
- Sánchez-Blázquez et al. (2006) Sánchez-Blázquez, P., Peletier, R. F., Jiménez-Vicente, J., Cardiel, N., Cenarro, A. J., Falcón-Barroso, J., Gorgas, J., Selam, S., & Vazdekis, A. 2006, MNRAS, 371, 703
- Smith et al. (2012) Smith, B. J., Swartz, D. A., Miller, O., Burleson, J. A., Nowak, M. A., & Struck, C. 2012, AJ, 143, 144
- Strickland et al. (2004) Strickland, D. K., Heckman, T. M., Colbert, E. J. M., Hoopes, C. G., & Weaver, K. A. 2004, ApJ, 606, 829
- Swartz et al. (2004) Swartz, D. A., Ghosh, K. K., Tennant, A. F., & Wu, K. 2004, ApJS, 154, 519
- Theureau et al. (2007) Theureau, G., Hanski, M. O., Coudreau, N., Hallet, N., & Martin, J.-M. 2007, A&A, 465, 71
- Tojeiro et al. (2009) Tojeiro, R., Wilkins, S., Heavens, A. F., Panter, B., & Jimenez, R. 2009, ApJS, 185, 1
- Turner et al. (2001) Turner, M. J. L., Reeves, J. N., Ponman, T. J., Arnaud, M., Barbera, M., Bennie, P. J., Boer, M., Briel, U., Butler, I., Clavel, J., Dhez, P., Cordova, F., Dos Santos, S., Ferrando, P., Ghizzardi, S., Goodall, C. V., Griffiths, R. G., Hochedez, J. F., Holland, A. D., Jansen, F., Kendziorra, E., Lagostina, A., Laine, R., La Palombara, N., Lortholary, M., Mason, K. O., Molendi, S., Pigot, C., Priedhorsky, W., Reppin, C., Rothenflug, R., Salvetat, P., Sauvageot, J., Schmitt, D., Sembay, S., Short, A., Strüder, L., Trifoglio, M., Trümper, J., Vercellone, S., Vigroux, L., Villa, G., & Ward, M. 2001, A&A, 365, L110, TRP01
- Tzanavaris et al. (2014) Tzanavaris, P., Gallagher, S. C., Hornschemeier, A. E., Fedotov, K., Eracleous, M., Brandt, W. N., Desjardins, T. D., Charlton, J. C., & Gronwall, C. 2014, ApJS, 212, 9
- Tzanavaris et al. (2010) Tzanavaris, P., Hornschemeier, A. E., Gallagher, S. C., Johnson, K. E., Gronwall, C., Immler, S., Reines, A. E., Hoversten, E., & Charlton, J. C. 2010, ApJ, 716, 556
- Vazdekis et al. (2010) Vazdekis, A., Sánchez-Blázquez, P., Falcón-Barroso, J., Cenarro, A. J., Beasley, M. A., Cardiel, N., Gorgas, J., & Peletier, R. F. 2010, MNRAS, 404, 1639
- Verdes-Montenegro et al. (2001) Verdes-Montenegro, L., Yun, M. S., Williams, B. A., Huchtmeier, W. K., Del Olmo, A., & Perea, J. 2001, A&A, 377, 812
- Véron-Cetty & Véron (2006) Véron-Cetty, M., & Véron, P. 2006, A&A, 455, 773
- Vogt et al. (2013) Vogt, F. P. A., Dopita, M. A., & Kewley, L. J. 2013, ApJ, 768, 151
- Weisskopf et al. (2002) Weisskopf, M. C., Brinkman, B., Canizares, C., Garmire, G., Murray, S., & Van Speybroeck, L. P. 2002, PASP, 114, 1