copyrightbox
Can’t you hear me knocking:
Identification of user actions on Android apps
via traffic analysis
Abstract
While smartphone usage become more and more pervasive, people start also asking to which extent such devices can be maliciously exploited as “tracking devices”. The concern is not only related to an adversary taking physical or remote control of the device (e.g., via a malicious app), but also to what a passive adversary (without the above capabilities) can observe from the device communications. Work in this latter direction aimed, for example, at inferring the apps a user has installed on his device, or identifying the presence of a specific user within a network.
In this paper, we move a step forward: we investigate to which extent it is feasible to identify the specific actions that a user is doing on his mobile device, by simply eavesdropping the device’s network traffic. In particular, we aim at identifying actions like browsing someone’s profile on a social network, posting a message on a friend’s wall, or sending an email. We design a system that achieves this goal starting from encrypted TCP/IP packets: it works through identification of network flows and application of machine learning techniques. We did a complete implementation of this system and run a thorough set of experiments, which show that it can achieve accuracy and precision higher than 95%, for most of the considered actions.
1 Introduction
Smartphones become widely used and pervasive devices. People continuously carry those devices with them and use them more and more for daily communication activities, including not only voice calls and SMS but also emails and social network interaction. In the last years, several concerns have been raised about the capabilities of those portable devices to invade the privacy of the users and actually becoming “tracking devices”. In particular, one aspect is concerned with the possibility of continuously localize an individual [4, 38]. Another relevant aspect is related to the fact that malicious apps can go even a step further in tracing and spying on someone life. For example, a malicious app that has access to the microphone and networking capabilities, could in principle continuously eavesdrop the audio and send it over the Internet to an adversary [35].
Even when the adversary has no actual control of the phone (either physical control or remote via malicious apps) other attacks in the same directions are possible to violate the privacy of the communications. If the network traffic is not encrypted, the task of the eavesdropper is simple, since he can analyze the payload and read the content of each packet. However, many mobile apps use the Secure Sockets Layer (SSL), and its successor Transport Layer Security (TLS), as a building block for encrypted communications. In a typical SSL/TLS usage scenario, a server is configured with a certificate containing a public key as well as a matching private key. As part of the handshake between an SSL/TLS client and server, the server proves it has the private key by signing its certificate with public-key cryptography. Unfortunately there is often a gap between theory and practice, e.g., leveraging the SSL vulnerabilities of smartphone apps [18, 20] one might run an SSL man-in-the-middle attack to compromise the confidentiality of communications.
We believe that while people become more familiar with mobile technologies and their related privacy threats (also thanks to the attention raised by the media, e.g., see the recent attention on NSA for supposedly eavesdropping foreign governments leader such as Angela Merkel [38]), users start adopting some good practices that better adapt to their privacy feeling and understanding. For examples, solutions to identify and isolate malware running on smartphones [34, 46, 40] as well as to protect against attacks coming from the network [12, 5] might significantly reduce current threats to user privacy.
Unfortunately, we believe that even adopting such good practices would not close the door to malicious adversaries willing to trace people. In fact, the wireless and pervasive nature of mobile devices would still leave many practical options for adversarial tracing. In particular, even when such solutions are in place, the adversary can still infer a significant amount of information from the properly encrypted traffic. For example, work leveraging analysis of encrypted traffic already highlighted the possibility of understanding the apps a user has installed on his device [39], or identify the presence of a specific user within a network [41].
This work focuses on understanding whether the user profiling made through analyzing encrypted traffic can be pushed up to understand exactly what actions the user is doing on his phone: as concrete examples, we aim at identifying actions such as the user sending an email, receiving an email, browsing someone profile in a social network, rather than publishing a post or a tweet. The underlying issue we leverage in our work is that SSL and TLS protect the content of a packet, while they do not prevent the detection of networks packets patterns that instead may reveal some information about the user behavior.
An adversary may use our approach in several practical ways to threaten the privacy of the user. In the following, we report some possible attacks:
-
•
A censorship government may try to identify a dissident who spreads anti-government propaganda using an anonymous social network account. Comparing the time of the public posts with the time of the actions (inferred with our method), the government can guess the identity of that anonymous dissident.
-
•
By tracing the actions performed by two users, and taking into account the communication latency, an adversary may guess (even if with some probability of error) whether there is a communication between them. Multiple observations could reduce the probability of errors.
-
•
An adversary can build a behavioral profile of a target victim based on the habits of the latter one (e.g., wake up time, work time). For example, this could be used to improve user fingerprinting methods, to infer the presence of a particular user in a network [41], even when he accesses the network with different type of devices.
Contributions
In this paper, we propose a framework to infer which particular actions the user executed on some app installed on his mobile-phone, by only looking at the network traffic that the phone generates. In particular, we assume the traffic is encrypted and the adversary eavesdrops (without modifying them) the messages exchanged between the user’s device and the web services that he uses.
Our framework analyzes the network communications and leverages information available in TCP/IP packets (like IP addresses and ports), together with other information like the size, direction (incoming/outgoing), and timing. By using an approach based on machine learning, each app that is of interest is analyzed independently. To set up our system, for each app we first pre-process a dataset of network packets labeled with the user actions that originated them, we cluster them in flow typologies that represent recurrent network flows, and finally we analyze them in order to create a training set that will be used to feed a classifier. The trained classifier will be then able to classify new traffic traces that have never been seen before. We fully implemented our system, and we run a thorough set of experiments to evaluate our solution considering three very popular apps: Facebook, Gmail, and Twitter. The results shows that it can achieve accuracy and precision higher than 95%, for most of the considered actions done by the user with those apps.
Organization
The remainder of the paper is organized as follows. In Section 2, we revise the state of the art around our research topic. In Section 3, we introduce some background knowledge, used in our work, on machine learning and data mining tools. In Section 4, we present our framework, describing it in all its components. We present the evaluation of our solution for identifying user actions in Section 5, while in Section 6 we discuss about possible countermeasures against the attack. Finally, in Section 7 we draw some conclusions.
2 Related Work
Our main claim in this paper is that network traffic analysis and machine learning can be used to infer private information about the user, i.e., the actions that he executes with his mobile phone, even thought the traffic is encrypted. To position our contribution with respect to the state of the art, in this section we survey the works that belong to two main research areas that focus on similar issues: privacy attacks via traffic analysis (not necessarily focusing on mobile devices) and traffic analysis of mobile devices (not necessarily focusing on privacy).
Privacy attacks via traffic analysis
In the literature, several works proposed to track user activities on the web by analyzing unencrypted HTTP requests and responses [6, 36, 7]. With this analysis it was possible to understand user actions inferring interests and habits. However, in recent years, websites and social networks started to use SSL/TLS encryption protocol, both for web and mobile services. This means that communications between endpoints are encrypted and this type of analysis cannot be performed anymore.
Different works surveyed possible attacks that can be performed using traffic analysis assuming a very strong adversary (e.g., a national security agency) which is able to observe all communication links [33, 8]. In [26], Liberatore et al. evaluated the effectiveness of two traffic analysis techniques based on naive Bayes and on Jaccard’s coefficient for identifying encrypted HTTP streams. Such an attack was outperformed by [23], where the authors presented a method that applies common text mining techniques to the normalized frequency distribution of observable IP packet sizes, obtaining a classifier that correctly identifies up to 97% of requests. The technique was further refined in [31], where the authors presented a support vector machine classifier that was able to correctly identify web pages, even when the victim used both encryption and anonymization networks such as Tor [15]. Finally, Cai et al. [10] presented a web pages fingerprinting attack and proved its effectiveness despite traffic analysis countermeasures, such as Tor randomized pipelining [32] or HTTPOS [28].
Unfortunately, none of the aforementioned works was designed for (or could easily be extended) to mobile devices. In fact, all of them focus on web pages identification in desktop environment (in particular, in desktop browsers), where the generated HTTP traffic strictly depends on how web pages are designed. Conversely, mobile users mostly access the contents through the apps installed on their devices [21]. These apps communicate with a service provider (e.g., Facebook) through a set of APIs. An example of such differences between desktop web browsers and mobile apps is the validation of SSL certificates [20, 12].
Traffic analysis has been applied not only to HTTP but also to other protocols. For example, Song et al. [37] prove that SSH is not secure. In particular, they show that even very simple statistical techniques suffice to reveal sensitive information such as login passwords. More importantly, the authors show that by using more advanced statistical techniques on timing information collected from the network, the eavesdropper can also learn significant information about what users type in SSH sessions. SSH is not the only protocol that has been target of such attacks. Another example is Voice Over IP (VoIP). In particular, in [44], the authors show how the length of encrypted VoIP packets can be used to identify spoken phrases of a variable bit rate encoded call. Their work indicates that a profile Hidden Markov Model trained using speaker- and phrase-independent data can detect the presence of some phrases within encrypted VoIP calls with recall and precision exceeding 90%.
In [11], the authors show that despite encryption, also web applications suffer from side-channel leakages. The system model considered is different from our. In particular, their focus is on web applications. On the contrary, we focus on mobile applications. More importantly, the authors leverage three fundamental features of web applications: stateful communication; low entropy input; significant traffic distinction. We believe that in most mobile applications two of these features (stateful communication, low entropy input) are not very useful to characterize user actions. In contrast to this work, we adopt a solution that only needs information about packet sizes and their order.
Traffic analysis of mobile devices
Focusing on mobile devices, traffic analysis has been successfully used to detect information leaks [17], to profile users by their set of installed apps [39], and to produce the fingerprint of an app from its unencrypted HTTP traffic [13]. Traffic analysis has also been used to understand network traffic characteristics, with particular attention on energy saving [19]. Stober et al. [39] shown that it is possible to identify the set of apps installed on an Android device, by eavesdropping the 3G/UMTS traffic that those apps generate. Similarly, Tongaonkar et al. [13] introduced an automatic app profiler that creates the network fingerprint of an Android app relying on packet payload inspection, in order to re-identify its HTTP traffic. In [47], Zhou et al. present a work that take in consideration the traffic produced a user action performed with Twitter app. Unfortunately, the authors focused on a single user action (i.e., send a tweet) without distinguish that action from the other ones a user could perform.
None of the works mentioned in this section aim at inferring and distinguish user actions performed by the user with his mobile apps, which is the goal of our paper.
3 Machine Learning and Data Mining Background
In this section, we briefly recall several machine learning and data mining concepts that we use in our paper, while we point the reader to appropriate references for a complete introduction on those topics.
3.1 Dynamic Time Warping
Dynamic Time Warping (DTW) [30] is a useful method to find alignments between two time-dependent sequences (also referred as time series) which may vary in time or speed. This method is also used to measure the distance or similarity between time series.
Let us consider two sequences that represent two discrete signals: of length ; and of length . DTW uses a local distance measure to calculate a cost matrix , s.t., each cell reports the distance between and . The goal is to find an alignment between and having minimal overall distance. Intuitively, such an optimal alignment runs along a “valley” of low cost cells within the cost matrix . More formally, a warping path is defined as a sequence with , satisfying the following three conditions:
-
1.
Boundary condition: and ;
-
2.
Monotonicity condition: and ;
-
3.
Step size condition: for .
The total cost of a warping path is calculated as the sum of all the local distances of its elements. An optimal warping path is a warping path having minimal total cost among all possible working paths. The total cost of an optimal warping path is also used as a distance measure between two sequences and . In this paper, we will indicate the cost of an optimal warping path with .
3.2 Hierarchical Clustering
Hierarchical clustering is a cluster analysis method which seeks to build a hierarchy of clusters. This clustering method has the distinct advantage that any valid measure of distance can be used. In fact, the observations themselves are not required: all that is used is a matrix of distances.
In the following we will use a type of hierarchical clustering that is called agglomerative: each observation starts in its own cluster, and pairs of clusters are merged as one moves up the hierarchy. In order to decide which clusters should be combined, a metric (a measure of distance between pairs of observations) and a linkage criterion are required. Since we will clusterize time-dependent sequences, we will use the total cost of an optimal warping path as distance metric. As for the linkage criterion, that determines the distance between sets of observations as a function of the pairwise distances between observations, we will use the average distance, that is defined as:
where is a distance function, and and are two clusters of and elements, respectively. More details about Hierarchical clustering can be found in [22].
3.3 Supervised Learning
Supervised machine learning algorithms learns from labeled instances or examples, which are collected in the past and represent past experiences in some real-world applications. They produce an inferred model, which can be then used for mapping or classifying new instances. An optimal scenario will allow for the algorithm to correctly determine the class labels for unseen instances.
In this paper, we will use an ensemble classifier that is called Random Forest [9]. The main principle behind ensemble methods is that a group of “weak learners” can be combined together to form a “strong learner”. Random forest leverages a standard machine learning technique called “decision tree”, which, in ensemble terms, corresponds to the weak learner. In practice, it combines together the results of several decision trees trained with different portions of the training dataset and different subsets of features. More details about the Random Forest classifier can be found in [9].
4 Our Framework
In this section we describe our framework. In particular, Section 4.1 introduces the pre-processing steps that allow us to model the network traffic. Section 4.2 describes the methodology used to build training and test dataset, and the procedure used to classify user actions.
4.1 Network Traffic Pre-Processing
Mobile apps generally rely on SSL/TLS to securely communicate with peers. These protocols are built on the top of the TCP/IP suite. The TCP layer receives encrypted data from the above layer, it divides data into chunks if the packets exceeds a give size. Then, for each chunk it adds a TCP header creating a TCP segment. Each TCP segment is encapsulated into an Internet Protocol (IP) datagram, and exchanged with peers. Since TCP packets do not include a session identifier, both endpoints identify a TCP session using the client’s IP address and the port number.
A fundamental entity considered in this paper is the traffic flow: with this term we indicate a time ordered sequence of TCP packets exchanged between two peers during a single TCP session. We model each network flow as a set of time series: (i) a time series is obtained by considering the bytes transported by incoming packets only; (ii) another one is obtained by considering bytes transported by outgoing packets only; (iii) a third one is obtained by combining (ordered by time) bytes transported by both incoming and outgoing packets. Additional time series may be obtained for example by considering other parameters such as the time-gap between different packets. However, we will only use the first three types mentioned above. The use of time series allows to represent network flows making them independent from the properties of the connection. Table 1 reports an example of time series generated from three network flows, while Figure 1 graphically represents these flows through a cumulative chart. The lower side of the chart represents incoming traffic, while the upper side represents outgoing traffic. This is only one of the possible representations, and it shows that the “shapes” of these three network flows are quite different. Intuitively, our classification approach aims to identify the “shape” of unseen flows.
| Flow ID | Time series type | Time series |
|---|---|---|
| Flow 1 | Incoming | [1514, 1514, 315, 113, 477] |
| Outgoing | [282, 188, 514, 96, 1514, 179, 603, 98, 801, 98] | |
| Complete | [282, -1514, -1514, -315, 188, -113, 514, 96, 1514, 179, 603, 98, 801, 98, -477] | |
| Flow 2 | Incoming | [1514, 1514, 1266, 582, 113, 661] |
| Outgoing | [282, 188, 692, 423] | |
| Complete | [282, -1514, -1514, -1266, -582, 188, -113, 692, 423, -661] | |
| Flow 3 | Incoming | [1245, 1514, 107, 465, 172, 111] |
| Outgoing | [926, 655, 136, 913, 1514, 1514, 863] | |
| Complete | [926, 655, 136, -1245, 913, 1514, 1514, 863, -1514, -107, -465, -172, -111] |

Before generating for each flow the corresponding set of time series, a few pre-processing steps have to be performed. In particular: 1) we apply a domain filtering to select only flows belonging to the analyzed app; 2) we filter the remaining flows, in order to delete packets that may degrade the precision of our approach (i.e., we filter out ACK and retransmitted packets); 3) we limit the length of the generated time-series. In the following, we will detail these three pre-processing steps.
Domain filtering
The network traffic generated by an application is generally directed toward a back-end infrastructure, that may be identified with a single server, or a set of servers that may be even behind a load balance. Since we analyze each app independently, we need to make sure that traffic generated from apps other than the considered one (or traffic generated by the OS) do not interfere with the analysis. Different methods can be used in order to identify the app that generated each network flows. The destination IP address is a trivial discriminating parameter. However, in case of a load balanced back-end, we should know all the individual IP addresses that can be involved in the communication. The same happens when the back-end is composed by several components such as different web services, databases, etc. To overcome this problem we use another strategy: we take into consideration for further analysis only the flows which destination IP addresses owners have been clearly identified as related to the considered app. In the implementation of our framework, we leverage the WHOIS protocol for this purpose, but we want to highlight that this is only one of the possible way. Business and other context information may be used in order to perform the domain filtering. We also take into consideration the traffic related to third parties services (such as Akamai or Amazon) that are indeed used by several applications [42].
Packets filtering
Due to network congestion, traffic load balancing, or other unpredictable network behavior, IP packets can be lost, duplicated, or delivered out of order. TCP detects these problems, hence requesting retransmission of lost data, and reordering out-of-order data. It comes out that several TCP packets that do not carry data, may hinder the analysis process. In the data exchange phase, for example, the receiver sends a packet with the ACK flag set to notify the correct reception of a chunk of data. These ACK packets are transmitted in asynchronous mode so they are affected by many factors related to round trip time of the connection link. The order of the received packets may hinder the evaluation of the similarity between two network flows. For this reason, we filter out all packets retransmissions, as well as packets marked with the ACK flag. Note that the metric that we will use in order to measure similarity between flows (see Section 4.2) will mitigate the consequences of a missing packet. We filter out also other packets that do not bring any additional information helpful in characterize flows. In particular, we filter out the three way handshake executed to open a TCP connection, and the packets exchanged to close it.
Timeout and packets interval
Two different techniques are used to limit the length of the generated time series: a timeout mechanism and the specification of a packets interval. The timeout mechanism is used to terminate the flows that did not receive any new packet since seconds. Indeed, it has been proved experimentally that 95% of all packets arrive at most seconds after their predecessors [39]. The packets interval specifies the first and the last packet to be considered. For example, considering a flow composed by packets, and the interval with and , the corresponding time series will be composed by values that report the bytes of the to the packet. This simple mechanism allows us to focus on particular portions of the flow. The first part, for example, is often the more significant. In the experimental part, we report the results for different configurations of packets intervals, showing that the best configuration is app dependent.
4.2 Classification of User Action
Since we use a supervised learning approach, it is necessary to create a labeled dataset that describes the user actions that we want to classify. In order to build this dataset, we simulate a series of user actions, and for each one we identify the flows generated after the execution of the action itself. For each app that we analyze we focus on actions that are significant for that particular app.
In most cases, a single user action generates a set of different flows (i.e., not just a single one). Furthermore, different user actions may generate different sets of flows. Our classification method is based on the detection of the sets of flows that are distinctive of a particular user action. In order to elicit these distinctive sets of flows, we build clusters of flows by using the agglomerative clustering approach described in Section 3.2. Flows that are similar one to each other will be grouped together in the same cluster, while not similar flows will be assigned to in different clusters. The average distance is used as linkage criterion, while the computation of the distance between two flows combines the distances of the corresponding time series. Supposing that each flow is decomposed into a set of time series , the distance between and is defined as:
where is a weight assigned to the particular time series. Weights can be assigned in such a way to give more importance to some type of time series with respect to others. For example, it is possible to give more weight to the time series that represent incoming packets, and less weight to those that represent outgoing packets.
In order to reduce the computational burden of the subsequent classification, a leader is elected for each cluster. Leaders will be the representative flows of their clusters. Given a cluster containing the flows , the leader is elected by selecting the flow that has minimum overall distance from the other members of the cluster, that is:
Clustering is executed over the set of flows that will be used to build the training dataset. The cluster leaders will be used to build both the training and the test datasets. The user actions will be the instances of the datasets, while the class of each instance is a label representing the action. We will have one integer feature for each cluster identified through the agglomerative clustering. The value of each feature is determined by analyzing the flows related to an action. Each flow captured after the execution of an action will be assigned to the cluster that minimizes the distance between and the leader of the cluster. The feature will therefore indicate the number of flows that have been assigned to the cluster after the execution of that action. For example, for the action send mail, the feature will be equal to if there are flows labeled with send mail assigned to the cluster .
Finally, we execute the classification with Random Forest algorithm. The main idea behind the overall approach is that different actions will “trigger” different sets of clusters. The classification algorithm will therefore learn which are these sets, and will be able to correctly determine the class labels for unseen instances.
5 Experimental Results
In order to assess the performance of our proposal, we considered three widespread apps: Gmail, Facebook and Twitter. We select these apps because of their high popularity [1]. Indeed, Gmail is the world’s largest email service [27], and its Android app has over one billion downloads. On the other hand, Facebook and Twitter are not only the most popular Online Social Networks [3], but they also had a leading role in the Arab spring [43] and the Istanbul’s Taksim Gezi Park protests [24] (when Turkish government blocked Twitter). We believe that the results we obtain in our analysis also hold for other apps that provide similar functionalities (e.g., Yahoo mail, WhatsApp or LinkedIn), while a thorough evaluation of this claim is left as future work. To collect the network traffic related to different user actions, we set up a monitored environment. In this section we present the elements that compose this environment (Section 5.1), the methodology used to collect the data (Section 5.2), and the results of the evaluation (Section 5.3).
5.1 Hardware and Network Configuration
For the evaluation of our solution, we used a Galaxy Nexus (GT-I9250) smartphone, running the Android 4.1.2 (Jelly bean) operative system. We enabled the “Android Debug” option in order to allow the usage of the ADB (Android Debug Bridge) interface via USB cable. We used a Wi-Fi access point (U.S. Robotics USR808054) to provide wireless connectivity to the mobile phone. Finally, we used a server (Intel Pentium Processor dual core E5400 2.7GHz with 4 GB DDR2 RAM) with two network cards running Ubuntu Server 11.04 LTS to route the traffic from the access point to the Internet, and vice versa.
To eavesdrop network packets flowing through the server, we used Wireshark software. From a Wireshark capture file, we created a comma separated file (csv), where each row describes a packet captured from the access point’s interface. For every packet we reported source and destination IP addresses, ports, size in bytes and time in seconds from Unix epoch (i.e., 00:00:00 UTC, 01 January 1970), protocol type and TCP/IP flags. Since the payload is not relevant to our analysis, it has been omitted. This data have been then used to generate the time series as explained in Section 4.1.
5.2 Dataset Collection and Analysis
For our study we considered three apps installed from the official Android market: Gmail v4.7.2 , Facebook v3.8, and Twitter v4.1.10. For each app, we created 10 accounts that have been considered in two different categories of users: “active” and “passive” users. “Active” users simulated the behavior of users that actively use the app by sending posts, email, tweets, surfing the various menus, etc. “Passive” users simulated the behavior of users that passively use the app, just by receiving messages or posts. The accounts of both passive and active users have been configured in such a way to have several friends/followers within the group. We avoided to configure the accounts with actual friends or followers, in order to avoid interference due to notifications of external users activities that were not under our control.
To reach a particular target, a user may have to perform several actions in a precise order. An action could be simple (e.g., a tap on a button, a swipe, or a selection of edit box), or complex (e.g., type a text, which is a sequence of keyboard inputs). For example, a user has to perform three actions in a precise sequence to post a message on his Facebook wall. He has to be sure that the Facebook app shows the “user’s wall”, then he has to tap on the “write a post” button (1), fill the edit box with some text (2), and finally tap on the “post” button (3). It is important to highlight that we do not use static text to fill in text boxes, but the text is randomly selected from a large set of sentences. A script submits the sequence of actions to the mobile phone through the ADB commands, and it captures the network traffic that is generated. The script records also the execution time of each action. By using the recorded execution time of each action, it is then possible to label the flows extracted from the network traffic with the user action that produced it. For each app, we choose a set of actions that are more sensitive than others from user privacy point of view (e.g., send an email or a message, for the reasons we report in Section 1). The list of these actions is reported in Table 2. We underline that we do not ignore other user actions, but we label them as other. In such a way we have several benefits [29]: we obtain a greater representation of data in terms of variety and variance of examples; we reduce the chances of overfitting; we improve the performance of the classifier on relevant user actions.
We collected and labeled the traffic generated by 220 sequences of actions for each app, where a sequence is composed by 50 types of actions (for a total of examples of actions for Gmail, for Twitter, and for Facebook). The user action examples in the dataset was divided in a training set and a test set. We use the training set to train the classifier, while we use the test set to evaluate its accuracy. We underline that to build the test set we used accounts that have not been used to create the training set. By using different accounts to generate the training and the test set, it is possible to assure that the results of the classification do not depend on the specific accounts that have been analyzed.
| Action | Description |
|---|---|
| send message | send a direct message to a friend |
| post user status | post a status on the user’s wall |
| open user profile | select user profile page from menu |
| open message | select a conversation on messages page |
| status button | select “write a post” on user’s wall |
| post on wall | post a message on a friend’s wall |
| open facebook | open the Facebook app |
| Gmail | |
| Action | Description |
| send mail | send a new mail |
| reply button | tap on the reply button |
| open chats | select chats page from menu |
| send reply | send a reply to a received mail |
| Action | Description |
| refresh home | Refresh the home page |
| open contacts | select contacts on menu |
| tweet/message | publish tweet or send message |
| open messages | select direct messages page |
| open twitter | open the Twitter app |
| open tweets | select tweets page |
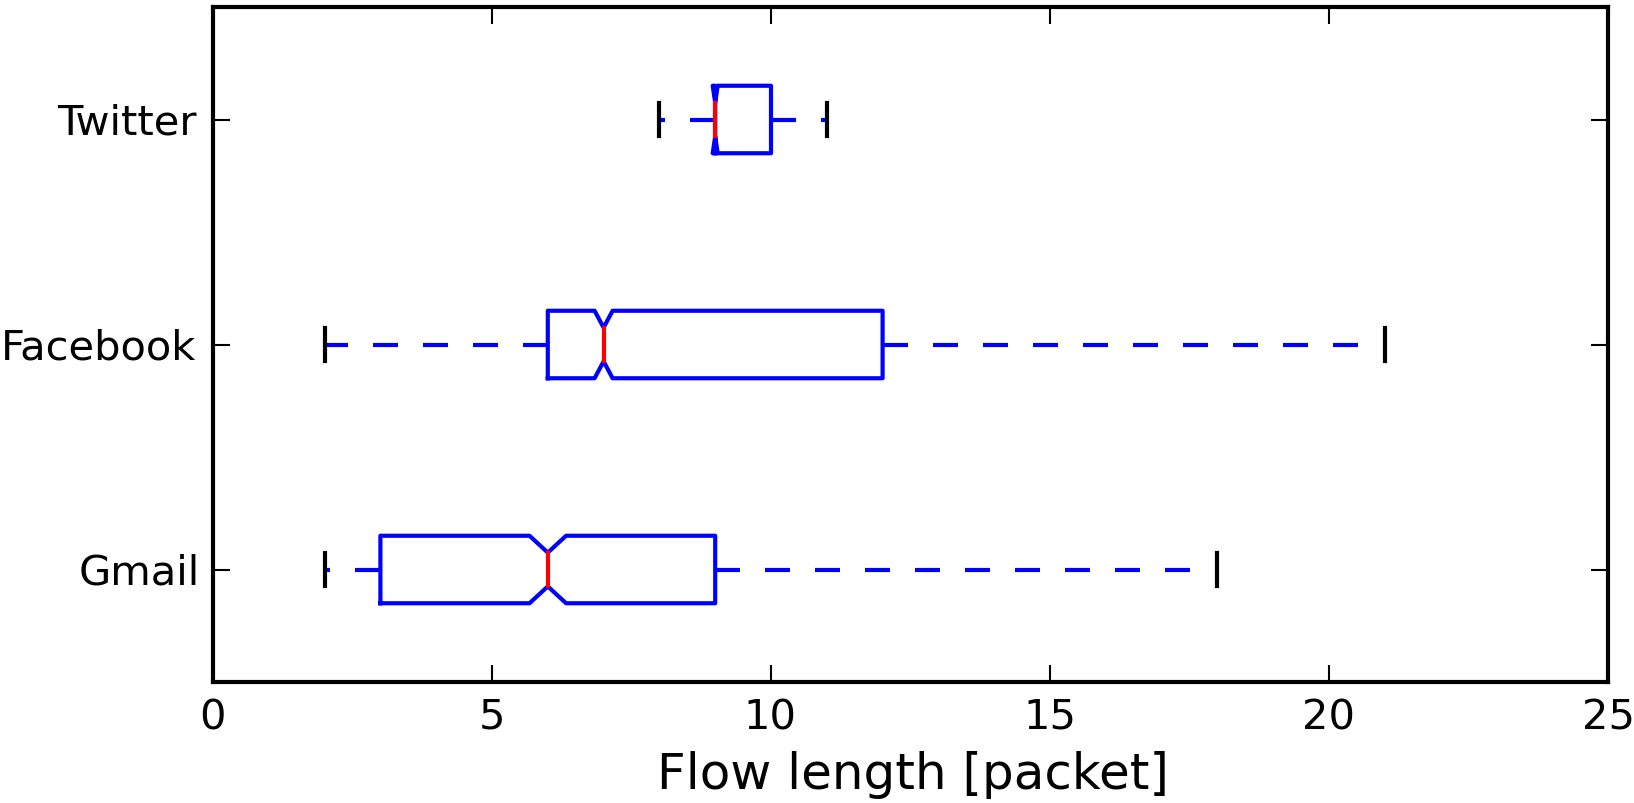
As explained in Section 4.1, each network flow is modeled as a set of time series. Table 3 reports the weights and the intervals for several configurations (“Conf." in the table) used to limit the length of the time series generated by each app. We used different weights configurations, and we selected the packets intervals by analyzing the statistical length of the flows. Figure 2 reports the statistical distribution of the length of the flows app by app. The first quartile, the median and the third quartile are highlighted by using a notched box plot. In particular, the median value and the third quartile have been used as thresholds to limit the maximum length of the generated time series. For the Twitter app, in some cases we set the interval in such a way to focus only on the last three or four packets. Indeed, we noticed that the first part of the time series was identical for each flow.
| Apps | Sets | Weights | In | Out | Complete |
|---|---|---|---|---|---|
| Gmail | Conf. 1 | 0.80 | [1,4] | [1,2] | [1,6] |
| 0.20 | [1,6] | [1,3] | [1,9] | ||
| Conf. 2 | 0.66 | [1,4] | [1,2] | [1,6] | |
| 0.33 | [1,6] | [1,3] | [1,9] | ||
| Conf. 3 | 0.33 | [1,4] | [1,2] | [1,6] | |
| 0.66 | [1,6] | [1,3] | [1,9] | ||
| Conf. 1 | 0.66 | [1,3] | [1,5] | [1,7] | |
| 0.33 | [1,6] | [1,7] | [1,12] | ||
| Conf. 2 | 0.33 | [1,3] | [1,5] | [1,7] | |
| 0.66 | [1,6] | [1,7] | [1,12] | ||
| Conf. 3 | 0.20 | [1,3] | [1,5] | [1,7] | |
| 0.80 | [1,6] | [1,7] | [1,12] | ||
| Conf. 1 | 0.95 | - | - | [7,10] | |
| 0.05 | - | - | [1,10] | ||
| Conf. 2 | 0.95 | - | - | [8,11] | |
| 0.05 | - | - | [1,11] | ||
| Conf. 3 | 0.95 | - | - | [8,10] | |
| 0.05 | - | - | [1,10] |
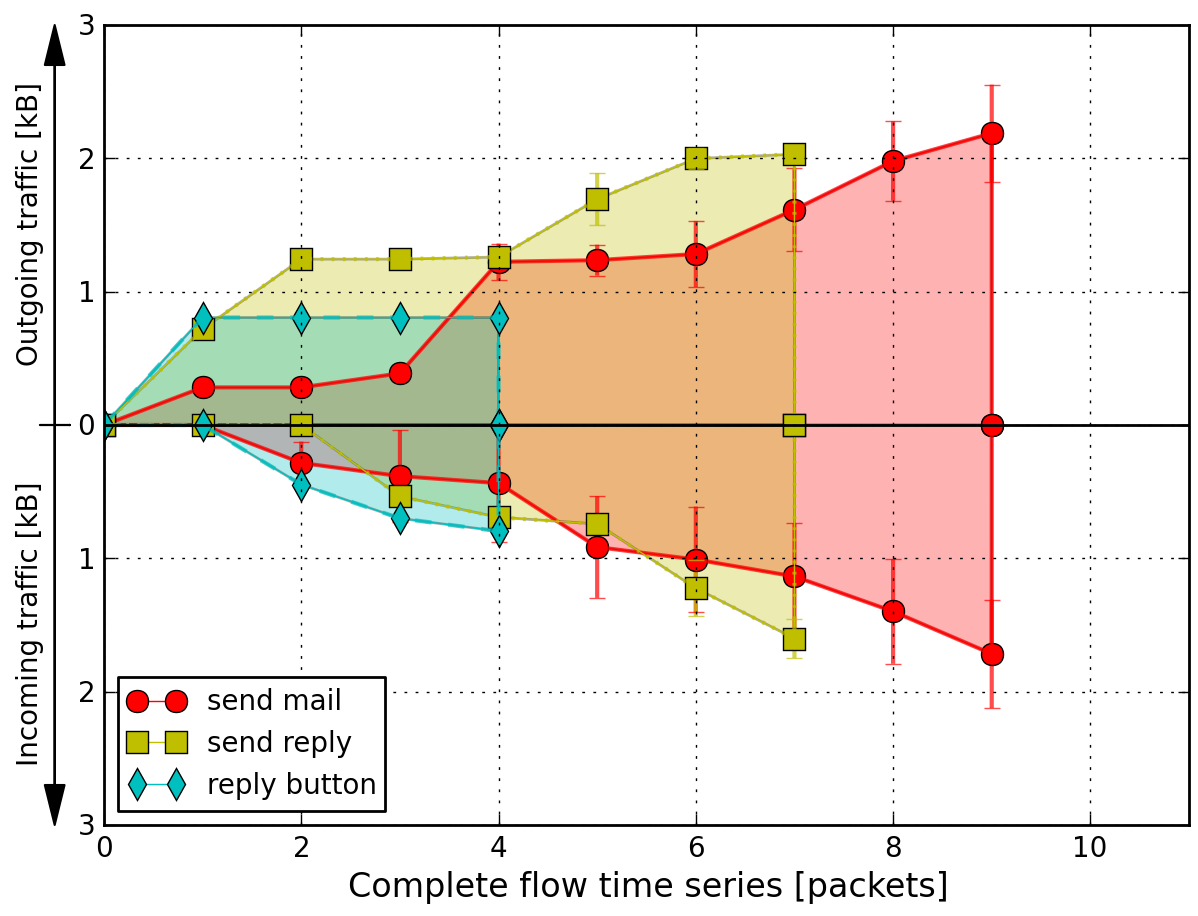
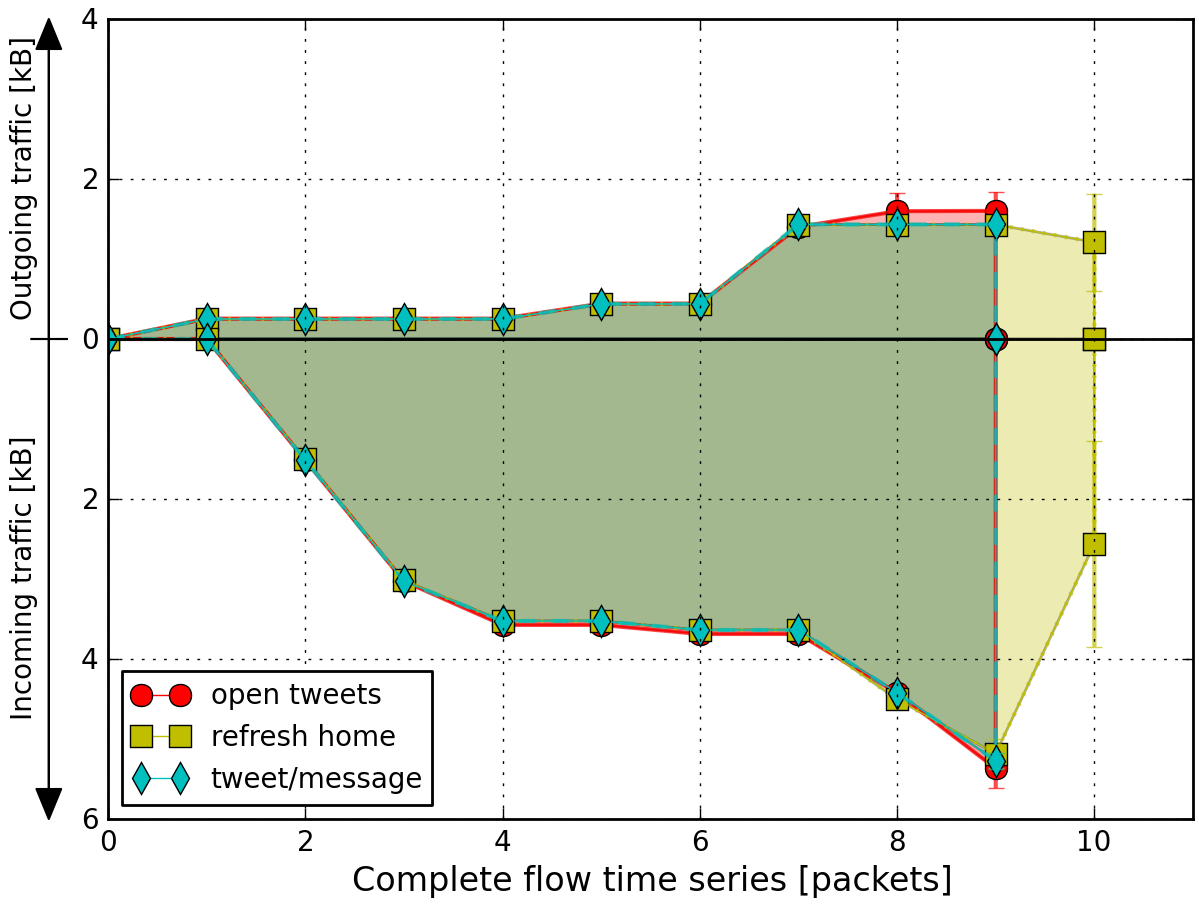
To confirm this statement we report in Figure 4 and Figure 4 the graphical representation of the flows that occur when executing three different actions in Gmail and Twitter respectively. Comparing the two figures, it can be noticed that the shapes of the actions drastically change for Gmail, while they are almost unvaried for Twitter. As a matter of fact, different Twitter actions just differ in their last packets. Nevertheless, our approach reaches very good performance also for this app. In our experiments, we used the Random forest classifier implemented by scikit-learn libraries [2]. The classifier is trained using 40 estimators, with the square root of the number of the features as max feature selection value for each estimator, and the bootstrap option activated. Each estimator (i.e., weak learner) consists in a decision tree without any restrictions on its depth limit.
5.3 Classification Performance
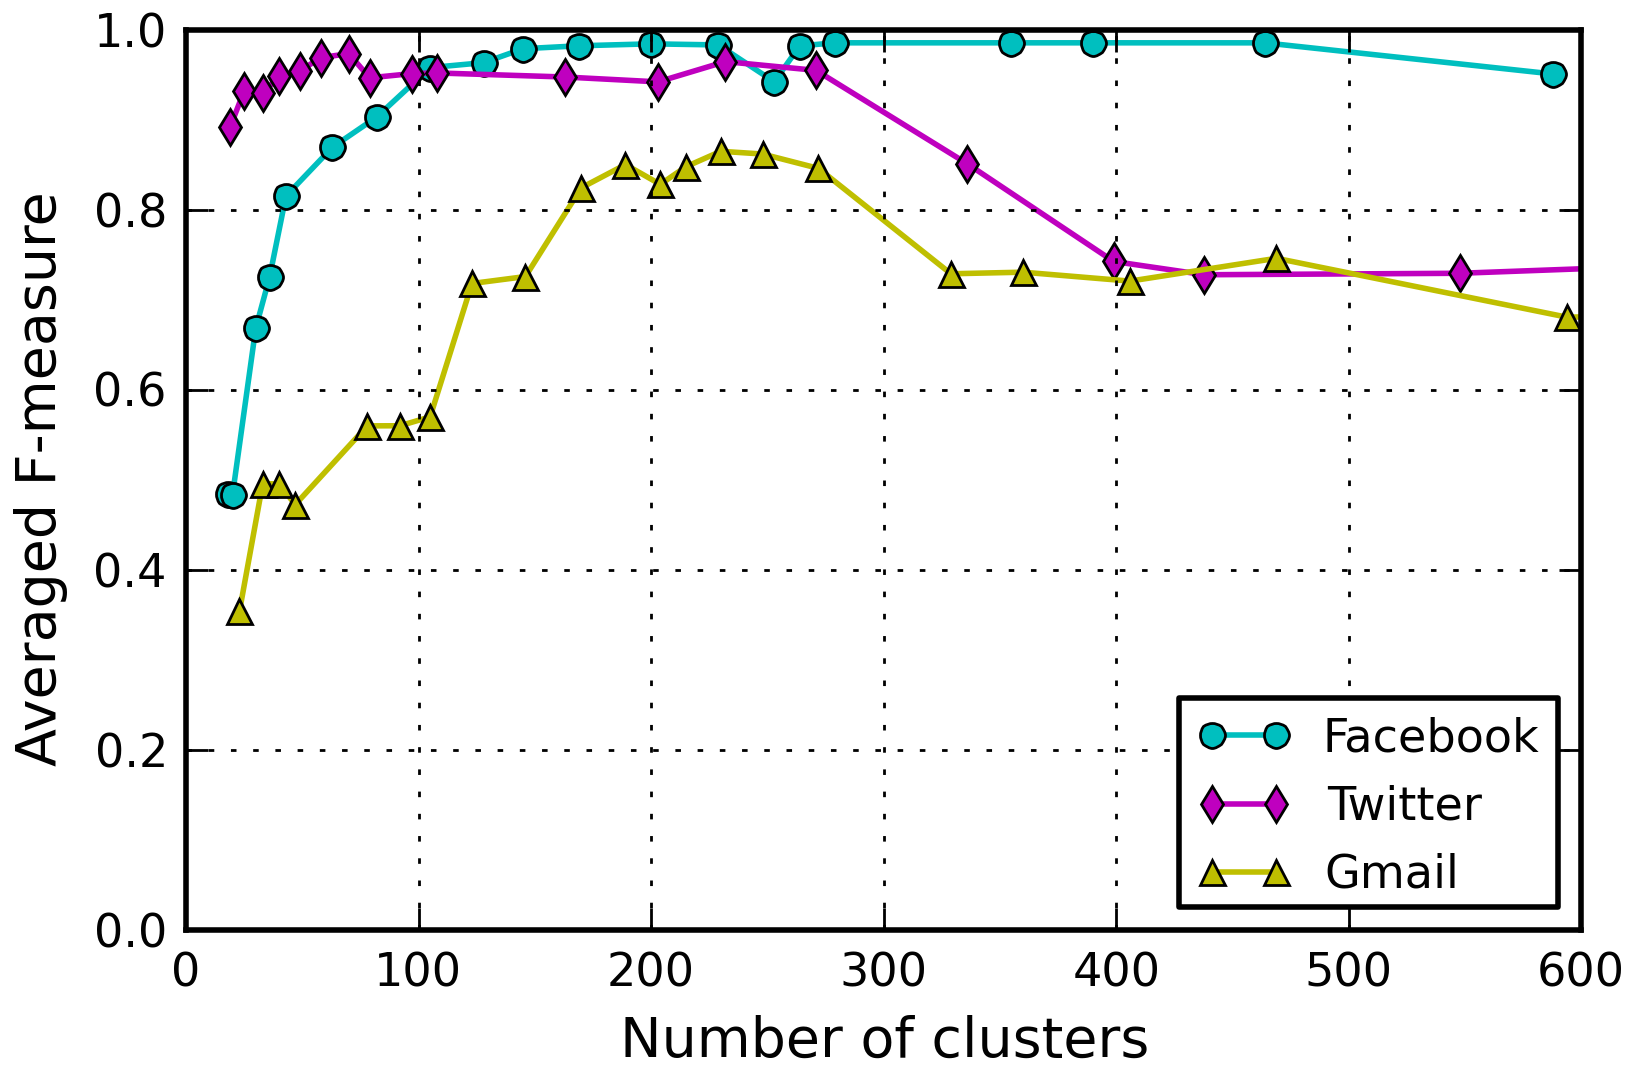
One of the issues to discuss before proceeding to the classification of the user actions is the number of clusters to consider. In order to establish a reasonable value for this parameter, we used a validation dataset to study the accuracy of the classification when varying the number of clusters. Figure 5 reports the achieved results. For each app, we therefore considered the number of clusters that maximized the accuracy, in terms of averaged F-measure. In the following, we report the results of the classification app by app. In particular, we discuss the average accuracy reached when detecting each sensitive user action, we report the corresponding confusion matrices, and detailed results for the precision, the recall and the F-measure metrics.
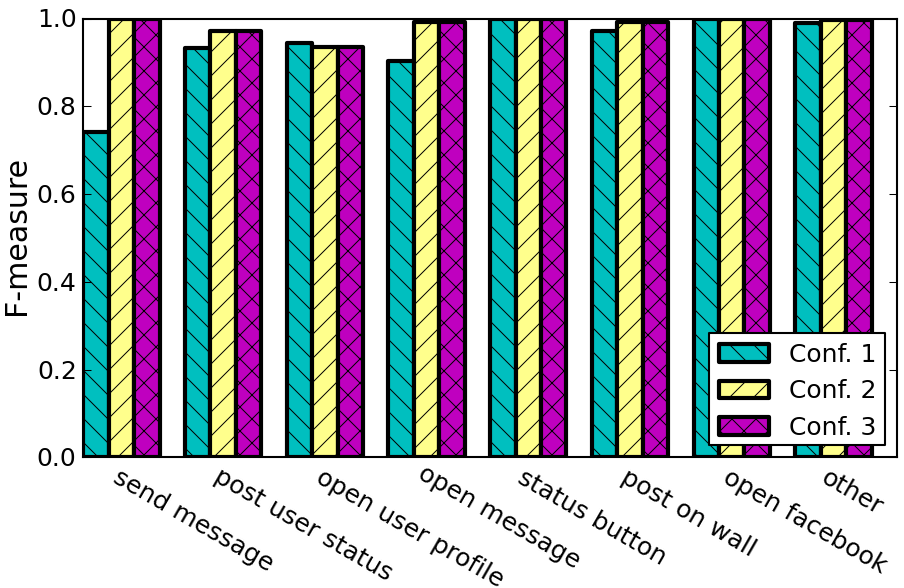
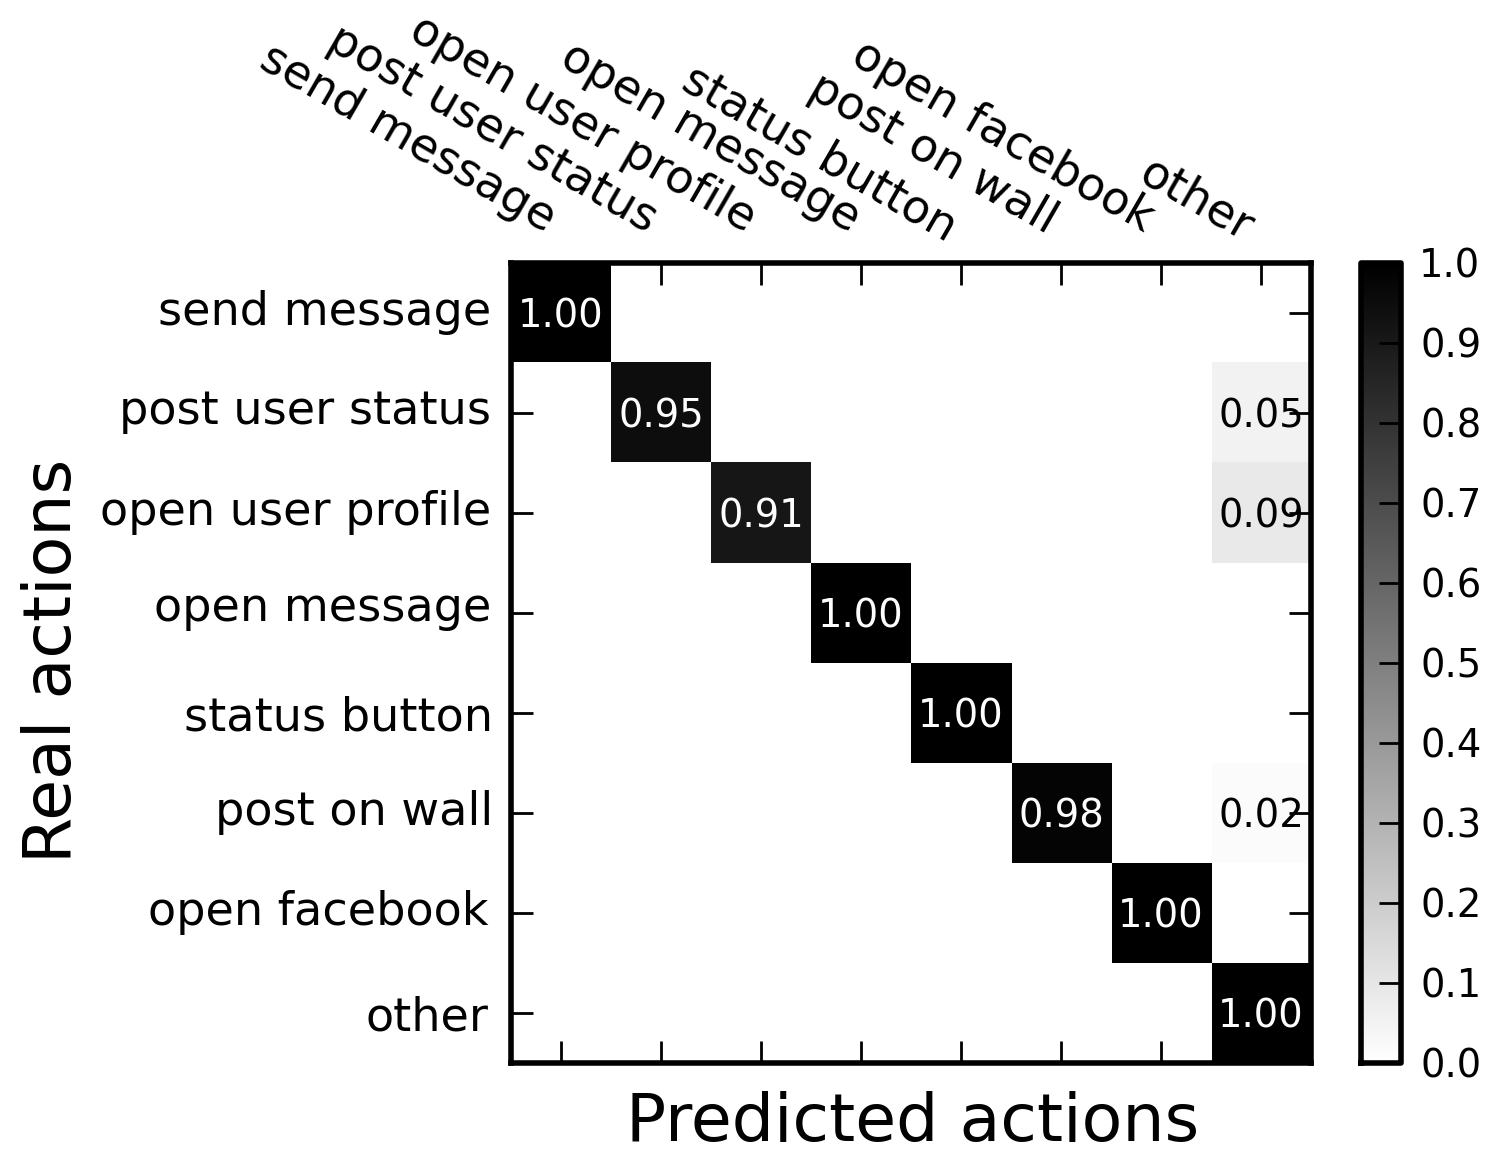
5.3.1 Facebook
We focused on seven different actions that may be sensitive when using the Facebook app. On average, the F-measure is equal to 99%, with a precision and a recall of 99% and 98% respectively. Performance reached with different configurations of weights and packets intervals constraints are reported in Figure 11. For each action at least one of the configurations exceeds 94% of accuracy, while the worst performing is always higher than 74%.
Table 4 reports precision, recall and F-measure reached by using Configuration 3. We noticed that all the actions have a precision higher 96%. The recall is higher than 95% for all the actions but the open user profile, that reaches 91%. In effect we realized that this particular action is classified as other in 9% of the examples, as we can see from the confusion matrix reported in Figure 11.
| Actions | Precision | Recall | F-measure |
|---|---|---|---|
| send message | 1.00 | 1.00 | 1.00 |
| post user status | 1.00 | 0.95 | 0.97 |
| open user profile | 0.96 | 0.91 | 0.94 |
| open message | 0.98 | 1.00 | 0.99 |
| status button | 1.00 | 1.00 | 1.00 |
| post on wall | 1.00 | 0.98 | 0.99 |
| open facebook | 1.00 | 1.00 | 1.00 |
| other | 0.99 | 1.00 | 0.99 |
| Average | 0.99 | 0.98 | 0.99 |
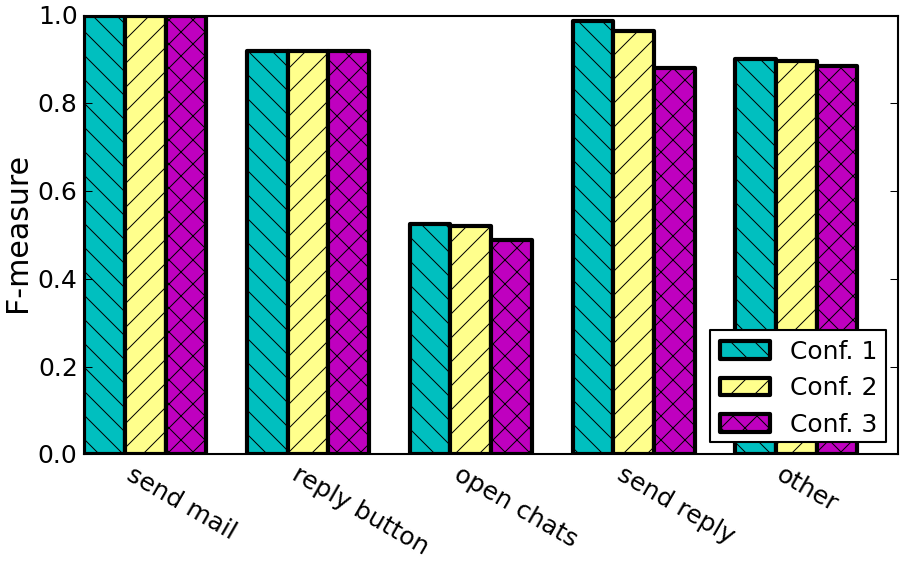
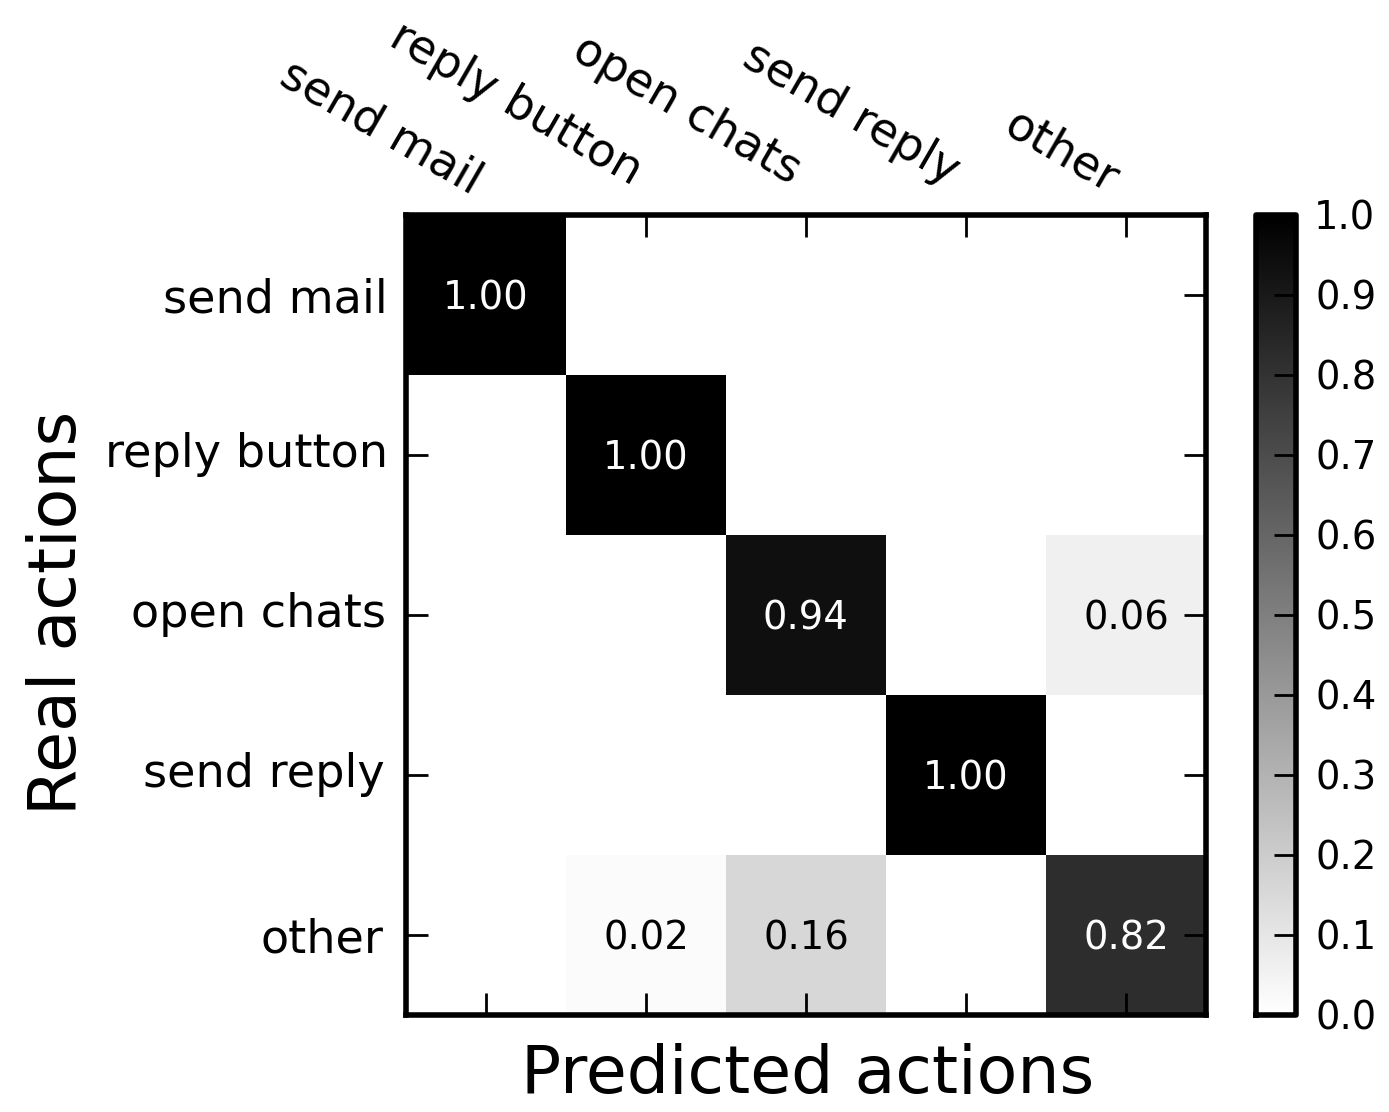
5.3.2 Gmail
We analyzed four specific user actions of the Gmail app: send mail, reply button, open chats and send reply. Figure 11 shows the classification accuracy that has been reached. We observe that we are able to distinguish with high accuracy the action of sending of a new mail, from that of replying to a previously received message, as well as the tap over the reply button. The open chats action is instead more difficult to distinguish. Table 5 reports precision, recall and F-measure for different configurations of weights and packets intervals constraints. We can observe that the action open chats (that allows to read past chats) achieves a low precision but a high recall. Analyzing the confusion matrix depicted in Figure 11 it is possible to notice that of other actions wrongly classified as open chats. This is the reason of such a low precision.
| Actions | Precision | Recall | F-measure |
|---|---|---|---|
| send mail | 1.00 | 1.00 | 1.00 |
| reply button | 0.85 | 1.00 | 0.92 |
| open chats | 0.36 | 0.94 | 0.52 |
| send reply | 0.98 | 1.00 | 0.99 |
| other | 0.99 | 0.82 | 0.90 |
| Average | 0.83 | 0.85 | 0.86 |
5.3.3 Twitter
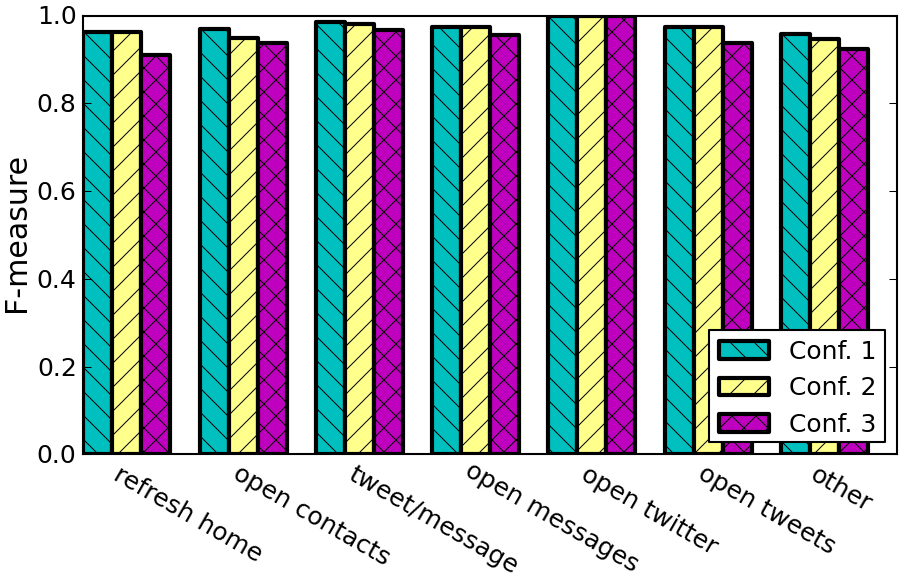
During the analysis we noticed that Twitter actions may be more difficult to classify than Gmail and Facebook actions. Indeed, different Twitter actions generate similar time series that have in common a large portion. Only the last three or four packets of each time series show some difference. Nevertheless, we have been able to reach outstanding results also for this app. In particular, we focus on six specific user actions: refresh home, open contacts, tweet/message, open messages, open twitter, open tweets.
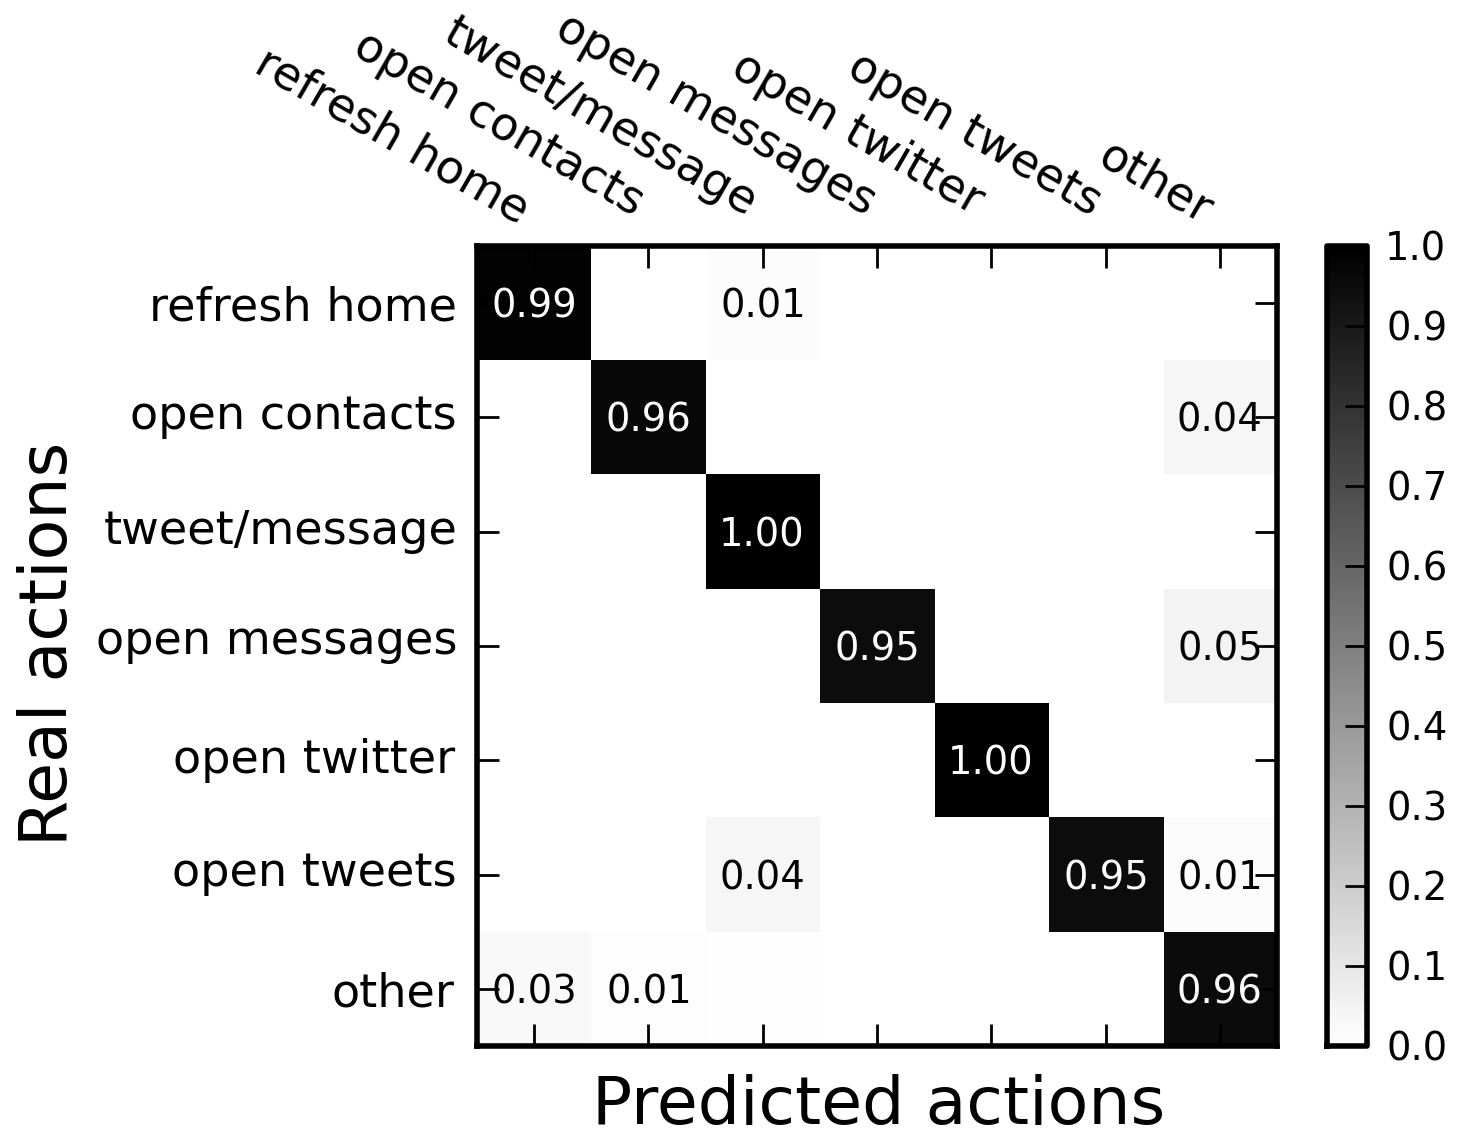
On average, the F-measure is equal to 97%, with a precision and a recall of 98% and 97% respectively (see Table 6). Performance reached are reported in Figure 11. For each action at least one of the configurations exceeds 96% of accuracy, while the worst configuration has an accuracy in any case higher than 91%. The action open twitter has accuracy and recall equal to 100%, independently of the Configuration set used for the clustering phase. As a consequence, none of examples of the test set have been wrongly classified. Figure 11 reports the confusion matrix obtained by considering the Twitter actions. Three of the six analyzed actions are correctly classified in more than the 99% of the cases. However, the other three actions, open contacts, open messages and open tweets are correctly classified in more than 95% of the cases.
| Actions | Precision | Recall | F-measure |
|---|---|---|---|
| refresh home | 0.94 | 0.99 | 0.96 |
| open contacts | 0.97 | 0.96 | 0.97 |
| tweet/message | 0.97 | 1.00 | 0.98 |
| open messages | 1.00 | 0.95 | 0.97 |
| open twitter | 1.00 | 1.00 | 1.00 |
| open tweets | 1.00 | 0.95 | 0.97 |
| other | 0.96 | 0.96 | 0.96 |
| Average | 0.98 | 0.97 | 0.97 |
6 Possible Countermeasures
Users and service providers might believe that their two parties communications are secure if they use the right encryption and authentication mechanisms. Unfortunately, current secure communication mechanisms limit their traffic encryption actions to the syntax of the transmitted data. The semantic of the communication is not protected in any way [25]. For this reason, it has been possible for example to develop classifiers for TLS/SSL encrypted traffic that are able to discriminate between applications.
The contribution of this paper was to investigate to which extent it is feasible to identify the specific actions that a user is doing on his mobile device, by simply eavesdropping the device’s network traffic. While it is out of the scope of the paper to investigate possible countermeasure to the proposed attack, we discuss in the following some related issues.
One common belief is that simple padding techniques may be effective against traffic analysis approaches. However, it has to be considered that padding countermeasures are already standardized in TLS, explicitly to “frustrate attacks on a protocol that are based on analysis of the lengths of exchanged messages” [14]. Nevertheless, our attack worked against TLS encrypted traffic. More advanced techniques have been proposed in the literature, such as traffic morphing and direct target sampling [45, 44]. However, a recent result showed that none of the existing countermeasures are effective [16]. The intuition is that coarse information is unlikely to be hidden efficiently, and the analysis of these features may still allow an accurate analysis. On the light of these results, we believe it is not trivial to propose effective countermeasures to the attack we shown in this paper. Indeed, it is intention of the authors to highlight a problem that is becoming even more alarming after the revelation about the mass surveillance programs that are nowadays adopted by governments and nation states.
7 Conclusions
We proposed a framework to analyze encrypted network traffic and to infer which particular actions the user executed on some apps installed on his mobile-phone. We demonstrated that despite the use of SSL/TLS, our traffic analysis approach is an effective tool that an eavesdropper can leverage to undermine the privacy of mobile users. With this tool an adversary may easily learn habits of the target users. The adversary may aggregate data of thousand users in order to gain some commercial or intelligence advantage against some competitor. In addition, a powerful attacker such as a Government, could use these insights in order to de-anonimize user actions that may be of particular interest. We hope that this work will shed light on the possible attacks that may undermine the user privacy, and that it will stimulate researchers to work on efficient countermeasures that can be adopted also on mobile devices. These countermeasures may require a kind of trade-off between power efficiency and the required privacy level.
8 Acknowledgments
Mauro Conti is supported by a Marie Curie Fellowship funded by the European Commission under the agreement n. PCIG11-GA-2012-321980. This work has been partially supported by the TENACE PRIN Project 20103P34XC funded by the Italian MIUR, and by the Project “Tackling Mobile Malware with Innovative Machine Learning Techniques” funded by the University of Padua. We would like to thank Fabio Aiolli, Michele Donini, and Mauro Scanagatta for their insightful comments.
References
- [1] Androidrank. http://www.androidrank.org/.
- [2] Scikit-learn: Machine learning in Python. http://scikit-learn.org/stable/.
- [3] Top 15 most popular social networking sites, May 2014. http://www.ebizmba.com/articles/social-networking-websites, May 2014.
- [4] R. Abir. iphone 5s can track user’s every move even after the battery dies. http://guardianlv.com/2014/03/iphone-5s-can-track-users-every-move-even-after-the-battery-dies/, Mar. 2014.
- [5] C. A. Ardagna, M. Conti, M. Leone, and J. Stefa. An anonymous end-to-end communication protocol for mobile cloud environments. Services Computing, IEEE Transactions on, 2014.
- [6] R. Atterer, M. Wnuk, and A. Schmidt. Knowing the user’s every move: User activity tracking for website usability evaluation and implicit interaction. In Proceedings of WWW, 2006.
- [7] F. Benevenuto, T. Rodrigues, M. Cha, and V. Almeida. Characterizing user navigation and interactions in online social networks. Inf. Sci., July 2012.
- [8] O. Berthold, H. Federrath, and M. Köhntopp. Project anonymity and unobservability in the internet. In Proceedings of CFP, 2000.
- [9] L. Breiman. Random forests. Machine Learning, 45, 2001.
- [10] X. Cai, X. C. Zhang, B. Joshi, and R. Johnson. Touching from a distance: Website fingerprinting attacks and defenses. In Proceedings of CCS, 2012.
- [11] S. Chen, R. Wang, X. Wang, and K. Zhang. Side-channel leaks in web applications: A reality today, a challenge tomorrow. In Proceedings of S&P, 2010.
- [12] M. Conti, N. Dragoni, and S. Gottardo. Mithys: Mind the hand you shake-protecting mobile devices from ssl usage vulnerabilities. In Security and Trust Management. 2013.
- [13] S. Dai, A. Tongaonkar, X. Wang, A. Nucci, and D. Song. Networkprofiler: Towards automatic fingerprinting of android apps. In Proceedings of INFOCOM, 2013.
- [14] T. Dierks and E. Rescorla. The Transport Layer Security (TLS) Protocol Version 1.2. RFC 5246 (Proposed Standard), August 2008.
- [15] R. Dingledine, N. Mathewson, and P. Syverson. Tor: The second-generation onion router. In Proceedings of SSYM, 2004.
- [16] K. P. Dyer, S. E. Coull, T. Ristenpart, and T. Shrimpton. Peek-a-boo, I still see you: Why efficient traffic analysis countermeasures fail. In Proceedings of S&P, 2012.
- [17] W. Enck, P. Gilbert, B.-G. Chun, L. P. Cox, J. Jung, P. McDaniel, and A. N. Sheth. Taintdroid: An information-flow tracking system for realtime privacy monitoring on smartphones. In Proceedings of OSDI, 2010.
- [18] S. Fahl, M. Harbach, T. Muders, L. Baumgärtner, B. Freisleben, and M. Smith. Why eve and mallory love android: An analysis of android ssl (in)security. In Proceedings of CCS, 2012.
- [19] H. Falaki, D. Lymberopoulos, R. Mahajan, S. Kandula, and D. Estrin. A first look at traffic on smartphones. In Proceedings of IMC, 2010.
- [20] M. Georgiev, S. Iyengar, S. Jana, R. Anubhai, D. Boneh, and V. Shmatikov. The most dangerous code in the world: Validating ssl certificates in non-browser software. In Proceedings of CCS, pages 38–49, 2012.
- [21] Y. Go, D. F. Kune, S. Woo, K. Park, and Y. Kim. Towards accurate accounting of cellular data for tcp retransmission. In Proceedings of HotMobile, 2013.
- [22] T. Hastie, R. Tibshirani, and J. Friedman. The Elements of Statistical Learning (2nd ed.). Springer New York Inc., 2009.
- [23] D. Herrmann, R. Wendolsky, and H. Federrath. Website fingerprinting: Attacking popular privacy enhancing technologies with the multinomial naive-bayes classifier. In Proceedings of CCSW, 2009.
- [24] S. Hutchinson. Social media plays major role in turkey protests. http://www.bbc.com/news/world-europe-22772352, June 2013.
- [25] B. Krishnamurthy. Privacy and online social networks: Can colorless green ideas sleep furiously? IEEE Security and Privacy, 2013.
- [26] M. Liberatore and B. N. Levine. Inferring the source of encrypted http connections. In Proceedings of CCS, 2006.
- [27] S. Ludwig. Gmail finally blows past hotmail to become the world’s largest email service. http://venturebeat.com/2012/06/28/gmail-hotmail-yahoo-email-users/, June 2012.
- [28] X. Luo, P. Zhou, E. W. W. Chan, W. Lee, R. K. C. Chang, and R. Perdisci. Httpos: Sealing information leaks with browser-side obfuscation of encrypted flows. In Proceedings of NDSS, 2011.
- [29] T. M. Mitchell. Machine learning. 1997.
- [30] M. Müller. Information Retrieval for Music and Motion. Springer-Verlag New York, Inc., 2007.
- [31] A. Panchenko, L. Niessen, A. Zinnen, and T. Engel. Website fingerprinting in onion routing based anonymization networks. In Proceedings of WPES, 2011.
- [32] M. Perry. Experimental defense for website traffic fingerprinting. https://blog.torproject.org/blog/experimental-defense-website-traffic-fingerprinting, Sept. 2011.
- [33] J.-F. Raymond. Traffic analysis: Protocols, attacks, design issues, and open problems. In Designing Privacy Enhancing Technologies, 2001.
- [34] B. P. Rocha, M. Conti, S. Etalle, and B. Crispo. Hybrid static-runtime information flow and declassification enforcement. Information Forensics and Security, IEEE Transactions on, 2013.
- [35] R. Schlegel, K. Zhang, X.-y. Zhou, M. Intwala, A. Kapadia, and X. Wang. Soundcomber: A stealthy and context-aware sound trojan for smartphones. In Proceedings of NDSS, 2011.
- [36] F. Schneider, A. Feldmann, B. Krishnamurthy, and W. Willinger. Understanding online social network usage from a network perspective. In Proceedings of IMC, 2009.
- [37] D. X. Song, D. Wagner, and X. Tian. Timing analysis of keystrokes and timing attacks on ssh. In Proceedings of SSYM, pages 25–25, 2001.
- [38] C. Staff. Germany: U.s. might have monitored merkel’s phone. http://edition.cnn.com/2013/10/23/world/europe/germany-us-merkel-phone-monitoring/, Oct. 2014.
- [39] T. Stöber, M. Frank, J. Schmitt, and I. Martinovic. Who do you sync you are?: Smartphone fingerprinting via application behaviour. In Proceedings of WiSec, 2013.
- [40] G. Suarez-Tangil, J. E. Tapiador, P. Peris, and A. Ribagorda. Evolution, detection and analysis of malware for smart devices. IEEE Communications Surveys & Tutorials, 2013.
- [41] N. V. Verde, G. Ateniese, E. Gabrielli, L. V. Mancini, and A. Spognardi. No nat’d user left behind: Fingerprinting users behind nat from netflow records alone. In Proceedings of ICDCS, 2014.
- [42] X. Wei, L. Gomez, I. Neamtiu, and M. Faloutsos. Profiledroid: Multi-layer profiling of android applications. In Proceedings of Mobicom, 2012.
- [43] D. Wolman. Facebook, twitter help the arab spring blossom. http://www.wired.com/2013/04/arabspring/, Apr. 2013.
- [44] C. V. Wright, L. Ballard, S. E. Coull, F. Monrose, and G. M. Masson. Spot me if you can: Uncovering spoken phrases in encrypted voip conversations. In Proceedings of S&P, 2008.
- [45] C. V. Wright, S. E. Coull, and F. Monrose. Traffic morphing: An efficient defense against statistical traffic analysis. In Proceedings of NDSS, 2009.
- [46] Y. Zhauniarovich, G. Russello, M. Conti, B. Crispo, and E. Fernandes. Moses: Supporting and enforcing security profiles on smartphones. Dependable and Secure Computing, IEEE Transactions on, 2014.
- [47] X. Zhou, S. Demetriou, D. He, M. Naveed, X. Pan, X. Wang, C. A. Gunter, and K. Nahrstedt. Identity, location, disease and more: Inferring your secrets from android public resources. In Proceedings of CCS, 2013.