Homesick Lévy walk: A mobility model having Ichi-go Ichi-e and scale-free properties of human encounters
Abstract
In recent years, mobility models have been reconsidered based on findings by analyzing some big datasets collected by GPS sensors, cellphone call records, and Geotagging. To understand the fundamental statistical properties of the frequency of serendipitous human encounters, we conducted experiments to collect long-term data on human contact using short-range wireless communication devices which many people frequently carry in daily life. By analyzing the data we showed that the majority of human encounters occur once-in-an-experimental-period: they are Ichi-go Ichi-e. We also found that the remaining more frequent encounters obey a power-law distribution: they are scale-free. To theoretically find the origin of these properties, we introduced as a minimal human mobility model, Homesick Lévy walk, where the walker stochastically selects moving long distances as well as Lévy walk or returning back home. Using numerical simulations and a simple mean-field theory, we offer a theoretical explanation for the properties to validate the mobility model. The proposed model is helpful for evaluating long-term performance of routing protocols in delay tolerant networks and mobile opportunistic networks better since some utility-based protocols select nodes with frequent encounters for message transfer.
Index Terms:
Mobility models, Contact frequency, Ichi-go Ichi-e, Power law, and Delay Tolerant Networks.I Introduction
In recent years, many kinds of human-carried mobile devices, such as smartphones and tablets, that enable many high-tech sensors and wireless communications have been increasingly pervasive throughout the world. Because most of the people in the world usually carry these devices in their lives, their activity logs, such as places where they visit and persons who they are connected with, can be easily recorded using GPS, cellphone call, and Geotagging. We are living in the era of Big data: by analyzing collections of data on people’s activity, big companies can take advantage of success in their businesses. Also, academic researchers can investigate human activities and social behaviours in more details than ever. For example, some recent studies based on the analysis of Big data of human mobility patterns have revealed that human behavior is easily predictable because human mobility is biased in general [1, 2]. This result shows that human mobility is far from random, but is ordered.
In parallel with the understanding of human mobility patterns, recently, many researchers become actively engaged in studies on mobility models, and many mobility models have been proposed [4, 3]. Traditional mobility models, such as Random Walk (RW), (truncated) Lévy Walk (LW), Random WayPoint (RWP), are simple and basic: they can easily be used for numerical simulations in general purposes, but they are far from real human mobility patterns. Therefore, newly proposed models have become more realistic and complicated : They includes more parameters to explain many statistical properties on human mobility patterns and social effects, thus they resultingly consume more memory space as simulation time progresses, such as SLAW [5]. The more a model explains, however, the harder it gets to use for the simulations with a large number of walkers in general.
These mobility models are often used for evaluating performance of routing protocols in Delay Tolerant Networks (DTNs) [19] and Mobile Opportunistic Networks (MON) [6, 7]. To evaluate the performance in systems with a large number of mobile nodes, we need to select a balanced mobility model properly. Because the above routing protocols are often contact-based ones, the model doesn’t necessarily preserve real mobility patterns, but it must have real contact patterns. In the context of information communication networks, many researchers frequently mention statistical properties on inter-contact time (or inter-meeting time) to select the model. But, we would argue in this paper that statistical properties on contact frequency is also an important factor to properly select the mobility model.
By the way, there is a famous Japanese proverb closely related with the frequency of human contacts which is called Ichi-go Ichi-e. This proverb is literally translated as “One chance in a lifetime” or more specifically as “Treasure every encounter, for it will never recur.” This phrase is closely associated with the history of the tea ceremony of Japan. Sen no rikyū (1522-1591), the famous tea master during the age of the provincial wars, originally taught this proverb to his pupils in the spirit of good service. Later, at the end of the Edo Period, Ii Naosuke (1815-1860), an accomplished practitioner of the Japanese tea ceremony, rediscovered and reconsidered this lesson as it is known today.
We know from experience that to meet with someone (or something) is sometimes very precious, and we might wonder about how often we have once-in-a-lifetime meetings in our daily lives or whether there is any statistical law that governs our meetings with people (or things). To the best of our knowledge, no scientific study has answered these questions because of the difficulty of collecting long-term data concerning human contact. However, given the recent advances in mobile wireless communication technologies, studies on the statistical physics of serendipitous human encounters can now be undertaken.
Our research group collected data concerning daily human contact using Bluetooth and Wi-Fi wireless communication technologies. Today, billions of electronic devices equipped with Bluetooth and Wi-Fi are used throughout the world. Most of these devices are light and mobile, including mobile PCs and phones, PDAs, tablets, and portable game machines. Therefore, they tend to be carried at almost all times. In addition, the communication range of Bluetooth and Wi-Fi is usually on the order of several meters, which is nearly the same as the range that humans can see when observing those around them. Thus, by scanning and logging nearby Bluetooth and Wi-Fi devices, we can collect reasonably well-sampled data concerning human encounters. In this case, here, encounter should be defined as a state that other humans having the device happen to come close within several dozen of meters at a maximum distance of its communicable range. In our experiment, we used PDAs and smartphones to continuously scan once every twenty seconds and to record pairs of time stamps and MAC addresses of detected devices, which indicated when a participant of the experiment encountered other people. A sample data logging software that our group uses is available as an open-access application for Android OS [8]. To calculate the contact frequency, we need to give a threshold value where two consecutive device detections whose interval time is less than the threshold value are within the same encounter. In this research, we give as a choice, but we also have checked that varying the choice of the threshold from some minutes to some hours is not sensitive for the whole contact frequency. After conducting our experiment, we obtained Long data (rather than a recent buzzword Big data) whose experimental period is between a minimum of several months and a maximum of more than two years. (See Table I and II). A dozen of people (university teachers, students, and company workers) participated and in total more than 50,000 different devices are detected in the experiment.
In this paper, by analyzing the collected experimental data, we exhibit two basic statistical properties of human contact frequency in the long data of human serendipitous encounters: (1) the property of Ichi-go Ichi-e, under which most human encounters occur once-in-a-experimental-period, and (2) the scale-free property of the remaining more frequent meetings. We can find that these properties clearly emerge for each individual when analyzing the Long Data. Inversely, it is difficult to observe these properties by analyzing short-term data even if they are categorized into the Big Data. To theoretically explain the origin of these statistical properties observed in the experiment, we furthermore propose “Homesick Lévy Walk” as a simple mobility model. This is a minimal stochastic model of human mobility that traces whether the walker stochastically selects moving long distances as well as the Lévy walk [9], or returning back home as a minimum social effect. In order to validate the mobility model, we offer a theoretical explanation for the properties of human contact using numerical simulations and a simple mean-field theory, which is the main contribution of the paper.
The rest of the paper is organized as follows. In Section II, we show the experimental results of analyzing collected data with Bluetooth and Wi-Fi opportunistic communications. In Section III, we propose a minimal stochastic model of human mobility patterns as a way to simultaneously explain both the two basic statistical properties. In Section IV, we perform numerical simulations to show that the minimal model can explain these properties. Section V demonstrates a simple mean-field theory to explain the emergence of these properties. We summarize our work, discuss future directions, and comment on an application of the model to performance evaluation of routing protocols in Delay Tolerant Networks in Sections VI and VII.
II Experimental results
First, we define as the ratio of one-time meetings to all meetings until time . The ratio of Ichi-go Ichi-e (once-in-a-lifetime meetings) to all encounters can also be denoted as at where is the end of life. Some typical time variations in during the experiment are shown in Fig. 1.
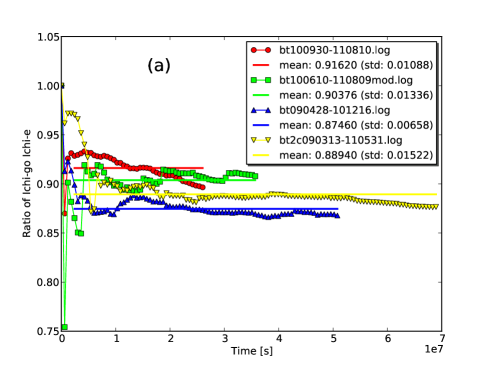
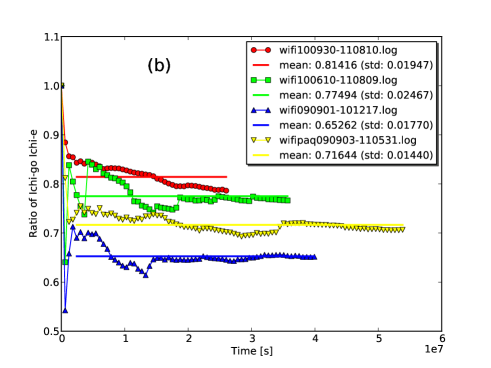
Although the initial patterns of vary strongly from one individual to the next, all of them stabilize as time progresses. Therefore, we may roughly assume that each of the time variations in converges to some fixed point around the ratio . Under this assumption, we may consider the time-averaged ratio over the experimental period denoted as to be approximately equivalent to the ratio . We present the time-averaged ratio using Bluetooth, , and Wi-Fi, , in Tables I and II, respectively. Averaged over all participants, the percentages of Ichi-go Ichi-e meetings using Bluetooth and Wi-Fi are approximately 80-90%, meaning that the majority of human encounters occur once-in-an-experimental-period.
We also considered the complementary cumulative distribution function (CCDF) for human contact frequency. As illustrated in Fig. 2, the CCDF clearly follows a power-law distribution,
| (1) |
where is a scaling exponent. Note that this power law is satisfied only for the remaining 10-20% of encounters, those that occur more than once for each individual. In other words, a large gap exists between and in .
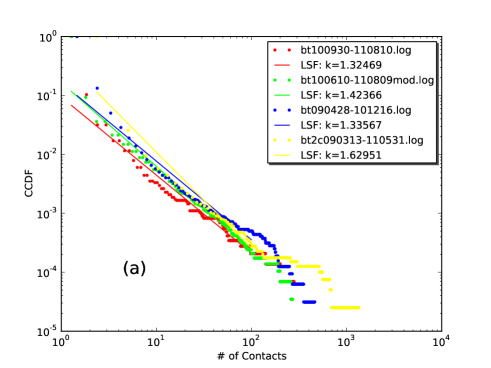
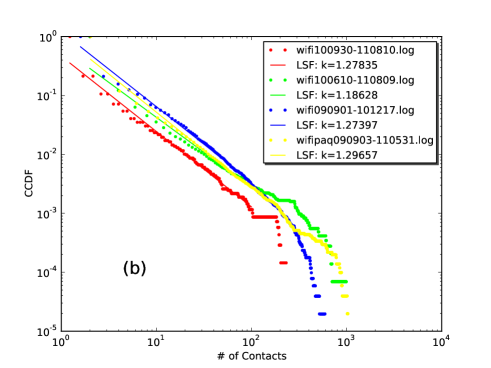
The estimated scaling exponents of Bluetooth, , and Wi-Fi, , which were determined using the experimental data, are summarized in Tables I and II, respectively.
| Participant ID | Experimental period | ||
|---|---|---|---|
| A | 2009/03/13-2011/05/31 | 1.63 | |
| B | 2009/04/28-2010/12/16 | 1.34 | |
| C | 2010/06/10-2011/08/09 | 1.42 | |
| D | 2010/09/01-2011/08/08 | 1.25 | |
| E | 2010/09/30-2011/08/10 | 1.32 | |
| F | 2010/10/18-2011/02/22 | 1.24 | |
| G | 2010/10/19-2011/03/09 | 1.29 | |
| H | 2010/10/21-2011/01/27 | 1.39 | |
| I | 2010/10/21-2011/02/03 | 1.17 | |
| J | 2010/11/10-2011/03/31 | 2.23 |
| Participant ID | Experimental period | ||
|---|---|---|---|
| A | 2009/09/03-2011/05/31 | 1.30 | |
| B | 2009/09/01-2010/12/17 | 1.27 | |
| C | 2010/06/10-2011/08/09 | 1.19 | |
| D | 2010/09/01-2011/08/08 | 1.25 | |
| E | 2010/09/30-2011/08/10 | 1.28 | |
| F | 2010/10/18-2011/02/22 | 0.94 | |
| G | 2010/10/19-2011/03/09 | 0.90 | |
| H | 2010/10/21-2011/01/27 | 1.40 | |
| I | 2010/10/21-2011/02/03 | 1.42 | |
| J | 2010/11/10-2011/03/31 | 1.42 |
For almost all the participants, the estimated scaling exponents are lower than two. Because of this, the variance of the CCDF tends to diverge during a long experimental period. This divergence indicates that the number of encounters that the participants meet with people in their experimental periods has no characteristic scale. In other words, meetings inherently exhibit extreme inequality, making it difficult to predict how many opportunities are left to encounter someone (or something).
III Homesick Lévy Walk
Next, we propose a minimal stochastic model of human mobility patterns as a way to simultaneously explain both the Ichi-go Ichi-e and scale-free properties of human encounters. A number of researchers have recently reported that human mobility traces statistically exhibit the Lévy walk (LW) [11, 13, 12, 10]. A Lévy walker in -dimensional space determines his or her destination; the travel distance from the present location is governed by an independently and identically distributed power-law distribution,
| (2) |
where is the Lévy index. The direction from the present location to the next destination location is usually determined by the uniform distribution. This feature has been found to be common to the mobility of humans and animals in two-dimensional space [14, 15, 16, 17].
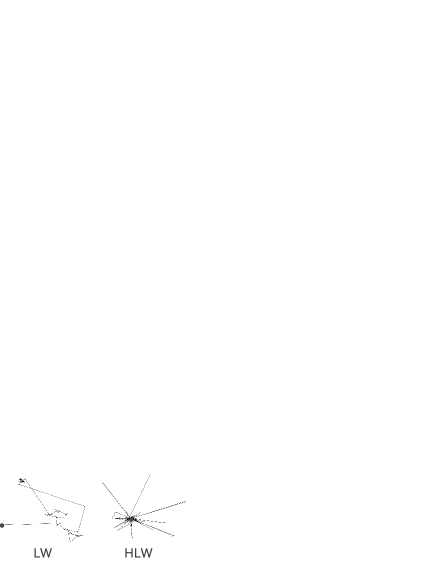
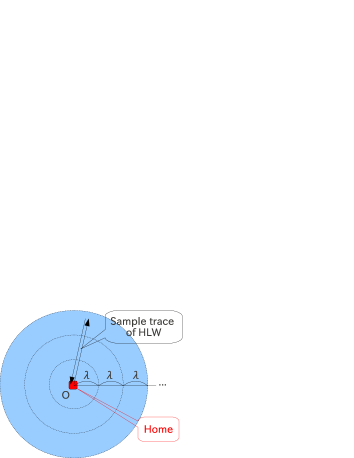
However, the scale-free property of walk lengths is insufficient to explain the statistical properties of human contact frequency. We numerically confirmed that the CCDF of contact frequency for Lévy walkers in bounded two-dimensional space generally decays exponentially at the tail. Let us consider what is lacking in the ordinary Lévy walk scenario. A Lévy walker easily travels long distances, but has difficulty returning to his or her original position (refer to Fig. 3). In real life, however, each participant typically frequents his or her own hub of social activity (or his or her own home). This reality strongly determines most of the topology of human mobility traces. Taking into consideration the role of the hub, we propose an extended version of the Lévy walk named the “Homesick Lévy Walk (HLW).” In this model, after arriving at the destination determined by the power-law walk length in Eq. (2), there exists a certain fixed probability that the Lévy walker will become homesick and return home; otherwise, according to probability , the walker will determine his or her next destination using Eq. (2) and continue travelling. By definition, HLW with a homesick probability of reduces to LW. For the sake of convenience, we define the initial position of HLW as home. The detailed procedure to move two-dimensional HLW is shown in Motion Control 1. The difference between the sample traces associated with the (simple) Lévy walk and the homesick Lévy walk is illustrated in Fig. 3.
In the name of this model, we use the word walk but not flight. In general, walk means that a walker moves with a finite velocity to the destination, but flight means that a walker jump instantly to the destination, which is the difference between these words. Because we also consider serendipitous encounters on the way to the destination, we introduce homesick Lévy walk here. But, Homesick Lévy Flight (HLF) can be defined by a similar way with changing from walk to flight in the model.
IV Numerical Simulations
We performed numerical simulations for homesick Lévy walkers in a bounded two-dimensional space. Initially, walkers were uniformly distributed within a squared region. The number of the walkers does not change in the simulations. The density of the walkers was determined based on the average population density of Japan, approximately , because all of the study participants live mainly in Japan. The distance between the present position and the next destination described using the polar coordinate is randomly generated from the probability distribution function, , where
| (3) |
and the minimum travelling distance . These equations are derived from Eq. (2) to satisfy the normalization condition . We assumed that for each time-step, all of the walkers move with a constant speed , and a small number of walkers meet together if they are within a fixed communication radius . We also assumed that after a walker arrive at a destination, the walker waits a single time-step to determine the next destination.
Next, we considered the effects of the homesick property and long-distance travelling on the time-averaged Ichi-go Ichi-e ratio and the scaling exponent of the CCDF of the contact frequency , varying and . The typical time evolution of is illustrated in Fig. 4 (a).
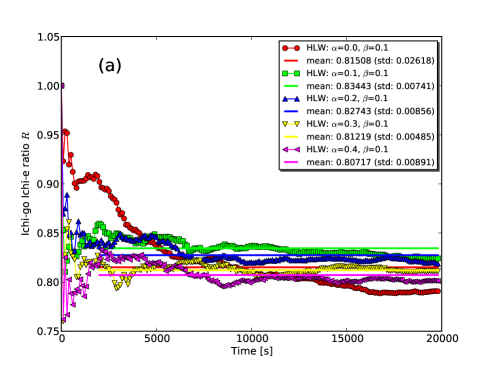
As observed in Fig. 1, each tends to converge as time progresses. The time-averaged ratio , calculated by averaging over the simulation time, is also plotted for the ranges and in Fig. 4 (b). We numerically confirmed that tends to decrease with increases in and . Also, we observe that by roughly tuning parameters and to sufficiently small values, we obtain a value of more than 80% for and the numerical results becomes consistent with the experimental ones.
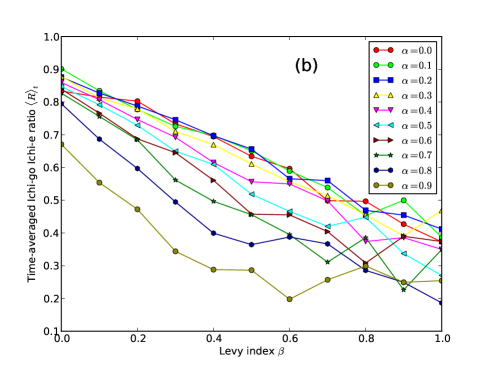
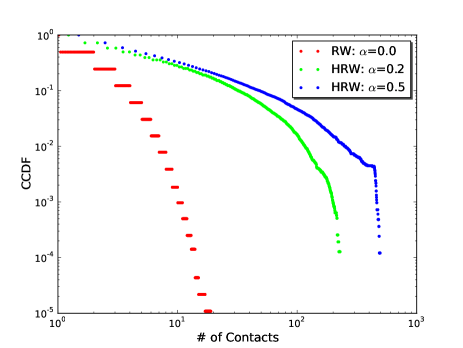
In Fig. 5(a), we also present some typical CCDFs for contact frequency based on the numerical results.
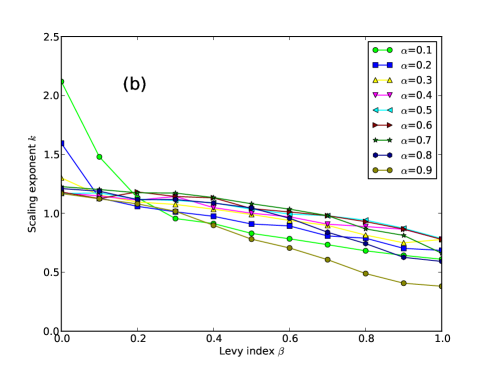
We can clearly see that the CCDF created using HLW for obeys a power-law distribution, whereas that created using LW () decays exponentially at the tail, as we mentioned before. This exponential decay for was observed for the entire range, . The results indicate that the homesickness component of HLW is essential to the scale-free property of contact frequencies. We also consider the relationship between the scaling exponent for contact frequency and for and calculated using least-squares fitting. As observed in Fig. 5(b), has a weak decreasing trend with increasing and for and . The most important point is that the value of matches the experimental values of and in Tables I and II when we keep () and small, as shown in Fig. 5(b). As a result, we numerically demonstrate that the HLW stochastic model can explain human contact frequency.
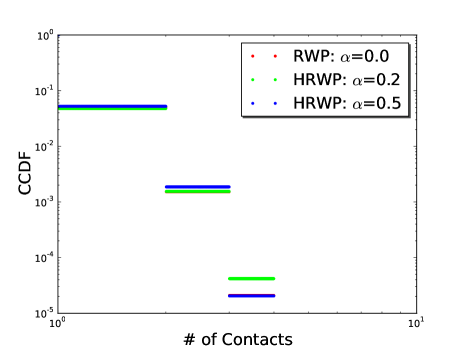
It should be emphasized that the contact frequencies of Homesick Random Walk (HRW) and
Homesick Random WayPoint (HRWP)
V Mean-field Theory
Finally, we use a simple mean-field theory of HLW to explain the emergence of these phenomena. We focus on one walker whose home is fixed at the origin of the two-dimensional space, whereas the other walkers are assumed to be spatially fixed and uniformly distributed in the space. We also define the mean-free path as the averaged moving distance that one traverses before encountering the next walker. Because the walker continues to repeatedly travel around and return home, the spatial existence probability of the focused walker tends to increase as the distance from home decreases. With this viewpoint in mind, we assume that the contact frequency for this walker and others depends only on the distance from home and that the walker meets the same walker at the same distance. Taking into consideration all of the above definitions and assumptions, we envision a scenario in which the walker encounters a new walker whenever he walks away from the concentric rings of width whose centre is his home. This image of meetings with walkers is used to separate the space into many ring-shaped concentric zones in which the walker in question meets others, as shown in Fig. 8.
We call this the concentric zone hypothesis.
In Fig. 9(a), we present numerical results for the CCDF of the walker’s frequency of contact with others with respect to his distance from home and the location at which he encounters those other individuals, .
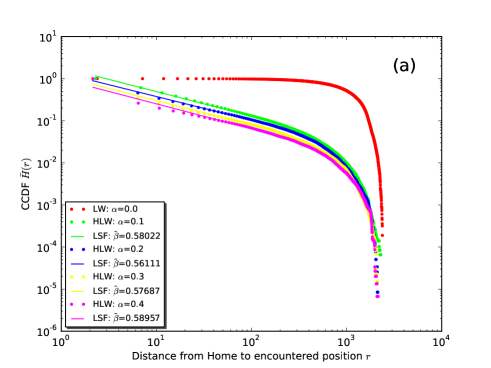
We observe that the function generally obeys a power-law distribution for , especially for the lower range of ,
| (4) |
where is the power index. The cut-off of the power law at the tail arises from the effect of spatial boundedness. For , however, is more likely to behave like a uniform distribution than it is to behave like a power law. Therefore, the spatial existence probability appears to be qualitatively different for HLW and LW.
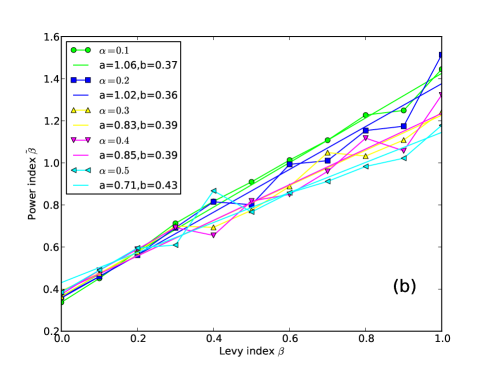
In Fig. 9 (b), we showed the numerical results indicating how the power index behaves given changes in and . We can see that a proportional relationship between and ,
| (5) |
is approximately satisfied for small and . The proportionality coefficient in Eq. (5), which seems to have a particular value when is fixed, tends to gradually decrease with increasing . These values of for varies around one.
Applying the power-law distribution of to the concentric zone hypothesis allows us to calculate the contact frequency of the walker in the -th concentric ring zone, denoted as . For this purpose, we use as follows:
| (6) | |||||
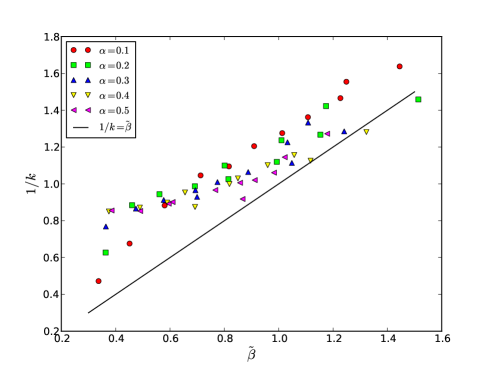
This equation directly indicates that the rank distribution of the contact frequencies also obeys a power-law distribution whose power index is . When remains within its small range , the power index of the rank distribution becomes less than one by Eq. (5). In this case, therefore, the tail of the rank distribution is generally so wide that the number of low-ranked walkers is divergent, which provides a simple explanation of why the majority of human encounters is Ichi-go Ichi-e.
We also consider the relationship between the rank distribution and the CCDF for contact frequency. It is well-known that if a rank distribution obeys a power law, then its frequency also becomes a power law. Thus, for the rank distribution , we can obtain the scale-free human contact frequency. In this case, it is also known that an inverse relationship exists between and :
| (7) |
We checked whether this inverse relation is numerically supported in Fig. 10.
VI Conclusion
In summary, we investigated the general statistical properties of serendipitous human encounters in daily life using portable wireless communication devices. We experimentally determined that we can universally apply the following statistical principles to human contact frequencies among individuals:
-
1.
The majority of human encounters occur once during one’s experimental period and this feature seems to continue during one’s lifetime (the property of Ichi-go Ichi-e)
-
2.
The remaining, more frequent encounters obey the power-law distribution in terms of contact frequency and its variance diverges (the scale-free property)
Because this long tail principle of human contact frequency is universal, it is difficult to predict how many times we will have additional opportunities to meet with people over long periods of time. This further validates the principle of Ichi-go Ichi-e, which teaches us to “treasure every encounter.”
To facilitate a fundamental theoretical understanding of these principles, we introduced a novel stochastic model of human mobility traces called the “homesick Lévy walk.” We used numerical simulations to demonstrate that this model can successfully explain both of the principles. Furthermore, using simple mean-field theory, we determined that the origin of the principles arises from the following two opposing mechanisms that inherently underlie human mobility patterns:
-
1.
Long-distance travelling ( in HLW)
-
2.
Homesickness ( in HLW)
Although we have proposed this model in [22, 23] for evaluation our proposed routing method, the origin of the above properties is first explained in this paper. Balancing the two mechanisms leads the statistical principles of human contact frequency to emerge. Note that according to violating the first mechanism, “Homesick Random Walk (HRW)” whose walk length to the next destination is determined by a distribution with a finite variance does not have the scale-free property of contact frequency, which we have also checked numerically.
It should be noted that we have introduced home as a minimum social effect. Because homesick Lévy walkers periodically return to their home, they tend to stay longer around their homes. Therefore, they meet with each other more frequently as the distance between their homes is closer, which naturally includes social relations between the walkers.
VII Discussions
In this paper, we focused on contact frequency for humans. However, that of animals might also obey the same principles because the above two mechanisms are common to animals and humans: animals usually have nests that are similar to our homes, and they also travel to distant feeding sites.
For future works, it is also important to consider effects of non-uniformity of population density. In the simulations, we used the average population density of Japan, but the density of people highly varies by the size of city where they live. Effects of the density on contact frequency, inter-contact time, and contact duration is an interesting task to investigate.
Recently, Song et al. has proposed “preferential return” to explain spatial visitation properties of human mobility patterns using their individual mobility model [18]. Our homesick Lévy walk model seems to be similar to their model, but there are some differences: Since they consider the visitation frequency of locations, their model needs multiple locations where one can return preferentially by flight. Since we consider the contact frequency between humans, on the other hand, our model does not necessarily assume multiple locations, but only one hub location where one can return with a fixed probability by walk. By experiment, we empirically know that the serendipitous human contacts occur on the way to destination more frequently rather than duration of visit at destination. Therefore, theoretical results given by their model does not cover statistical properties of the majority of human contacts. To understand the relation between these models is left for future work.
We think our mobility model is useful for performance evaluation of routing protocols in Delay Tolerant Networks (DTN) [19] since some protocols selects routing paths with frequent encounters in utility-based routing protocols, such as PRoPHET [20], MAXPROP [21], and so on. We also have proposed our algorithm for routing in DTN and have shown some results regarding the comparison between LW and HLW [22, 23], which indicates that the arrival rate of transferred messages tends to be much lower as increasing the homesick probability . It is also important to take into consideration the effect of Ichi-go Ichi-e since the large number of human encounters is rare. Therefore, the majority of human encounters usually doesn’t contribute to the performance of the utility-based routing, but they only consume much memory in vain for memorizing the history of encounters with many nodes that will never be encountered again. After understanding the properties of the frequency of human contact well, the routing protocols for message transfer could be improved.
Acknowledgment
This work is partially supported by Japan Society for the Promotion of Science through Grant-in-Aid for Scientific Research (C) (23500105) and Grant-in-Aid for Young Scientists (B) (25870958).
References
- [1] Song, C., et al. Limits of Predictability in Human Mobility, Science, vol. 327, no. 5968, pp.1018-1021 (2010).
- [2] Y.-A. de Montjoye, et al., Unique in the Crowd: The privacy bounds of human mobility, Scientific Reports, vol. 3, no. 1376 (2013).
- [3] Roy, R. R. Handbook of Mobile Ad Hoc Networks for Mobility Models (Springer, 2011).
- [4] Santi, P. Mobility Models for Next Generation Wireless Networks: Ad Hoc, Vehicular and Mesh Networks (Wiley, 2012).
- [5] Lee, K. et al. SLAW: Self-Similar Least-Action Human Walk, IEEE/ACM Transactions on Networking, vol. 20, no.2, (2012).
- [6] Denko, M. K. Mobile Opportunistic Networks: Architectures, Protocols and Applications (Auerbach Publications, 2011).
- [7] Woungang, I., et al. Routing in Opportunistic Networks (Springer, 2013).
- [8] http://tech.pokutuna.com/android-wireless-device-logger/
- [9] ben-Avraham, D. & Havlin, S. Diffusion and Reactions in Fractals and Disordered Systems (Cambridge University Press, 2000).
- [10] Barabási, A.-L. Bursts: The Hidden Pattern Behind Everything We Do (Dutton Adult, 2010).
- [11] Brockmann, D. et al. The scaling laws of human travel. Nature 439 462-465 (2006).
- [12] González, M. C. et al. Understanding individual human mobility patterns. Nature 453, 779-782 (2008).
- [13] Rhee, I. et al. On the Levy-walk Nature of Human Mobility: Do Humans Walk like Monkey? The 27th IEEE International Conference on Computer Communications (IEEE INFOCOM 2008), 924-932 (2008).
- [14] Viswanathan, G. M. et al. Optimizing the success of random searches. Nature 401, 911–914 (1999).
- [15] Edwards, A. M. et al. Revisiting Lévy flight search patterns of wandering albatrosses, bumblebees and deer. Nature 449, 1044-1048 (2007).
- [16] David W. Sims et al. Scaling laws of marine predator search behaviour. Nature 451, 1098-1102 (2008).
- [17] Viswanathan, G. M. et al. The Physics of Foraging: An Introduction to Random Searches and Biological Encounters (Cambridge University Press, 2011).
- [18] C. Song et al., Modelling the scaling properties of human mobility, Nature Physics (Advanced Online Publications) 7, 713 (2010).
- [19] A. Vasilakos, Y. Zhang, and T. V. Spyropoulos, Delay Tolerant Networks: Protocols and Applications, Wireless Networks and Mobile Communications Series, CRC Press, 2012.
- [20] A. Lindgren, A. Doria, and O. Schelén, “Probabilistic routing in intermittently connected networks,” ACM SIGMOBILE Mobile Computing and Communications Review, Vol. 7 Issue 3, pp.19-20(2003).
- [21] J. Burgess, B. Gallagher, D. Jensen, and B. N. Levine, “MaxProp: Routing for vehicle-based disruption-tolerant networks,” In Proc. IEEE INFOCOM, 398-408 (2006).
- [22] A. Fujihara, S. Ono, and H. Miwa “Optimal Forwarding Criterion of Utility-based Routing under Sequential Encounters for Delay Tolerant Networks,” Third International Conference on Intelligent Networking and Collaborative Systems (INCoS) 2011, 279-286 (2011).
- [23] A. Fujihara and H. Miwa, “Homesick Lévy Walk and Optimal Forwarding Criterion of Utility-based Routing under Sequential Encounters,” Internet of things and inter-cooperative computational technologies for collective intelligence, Studies in Computational Intelligence, vol. 460, pp. 207-231 (2013).