Beam energy dependence of the expansion dynamics in relativistic heavy ion collisions: Indications for the critical end point?
Abstract
The flow harmonic and the emission source radii , and are studied for a broad range of centrality selections and beam collision energies in Au+Au ( GeV) and Pb+Pb ( TeV) collisions at RHIC and the LHC respectively. They validate the acoustic scaling patterns expected for hydrodynamic-like expansion over the entire range of beam energies studied. The combined data sets allow estimates for the dependence of the mean expansion speed , emission duration and the viscous coefficients that encode the magnitude of the specific shear viscosity . The estimates indicate initial-state model independent values of which are larger for the plasma produced at 2.76 TeV (LHC) compared to that produced at 200 GeV (RHIC) ( and ). They also show a non-monotonic dependence for , and , with minima for and , and a complimentary maximum for . These dependencies signal a significant change in reaction dynamics in a narrow span of , which may be linked to reaction trajectories close to the critical end point (CEP) in the phase diagram for nuclear matter.
keywords:
1 Introduction
Heavy ion collisions provide an important avenue for studying the phase diagram for Quantum Chromodynamics (QCD) [1, 2, 3]. The location of the phase boundaries and the critical end point (CEP), in the plane of temperature vs. baryon chemical potential [()-plane], are fundamental “landmarks” of this phase diagram [4]. Lattice QCD calculations suggest that the quark-hadron transition is a crossover at high and small or high collision energies () [5]. Experimental results from the Relativistic Heavy Ion Collider (RHIC) at = 200 GeV and the Large Hadron Collider (LHC) at = 2.76 TeV, indicate that this transition results in the production of a strongly coupled plasma of de-confined quarks and gluons (sQGP) with low specific shear viscosity , i.e. the ratio of shear viscosity to entropy density [6]. The validation of this crossover transition, which is a necessary, albeit insufficient, requirement for the existence of the CEP, serves as an important impetus for the ongoing experimental searches.
A current strategy for (i) establishing the essential “landmarks” of the phase diagram and (ii) pinning down the thermodynamic and transport properties of each QCD phase, is centered on measurements in energy scans designed to access the broadest possible -domain of the phase diagram. In this proceedings we follow this lead by leveraging the combined measurements for anisotropic flow and HBT radii, recently obtained by PHENIX and STAR in the first RHIC Beam Energy Scan (BES-I) and by ATLAS, ALICE and CMS at the LHC.
2 Probes for transport properties and the Critical End Point (CEP)
The expansion dynamics of relativistic heavy ion collisions is strongly influenced by the transport properties of the created medium, as well as the path of the reaction trajectory in the ()-plane. Such an influence can manifest as quantifiable changes in the magnitude of the space-time extent of the emission source, characterized by the so-called HBT radii , and ; the square of (i) the emission source lifetime , (ii) its geometric size and (iii) the emission duration [7]. It can also manifest as a significant modulation of the anisotropic flow coefficients , depending on the magnitude of . The LHC measurements at TeV, allow investigations of the space-time extent and at high and small ; they compliment similar measurements from BES-I which allow a systematic study for the and values spanned by the collision energy range GeV. Here, it is noteworthy that currently, there are only a few experimental constraints for the ()-dependence of , especially at the lower beam energies [8].
At the CEP or close to it, anomalies in the dynamic properties of the medium can drive abrupt changes in transport coefficients and relaxation rates to give a non-montonic dependence of [6, 9, 10]. An emitting system produced in the vicinity of the CEP is also expected to show a stalling of the expansion speed and a larger emission duration manifested as a difference between and () [11]. Here, the rationale is that, in the vicinity of the CEP, the equation of state (EOS) “softens” considerably and this slows down the speed of expansion and prolongs the emission duration to give .
In prior work [12, 13], we have used the participant eccentricities () and initial transverse size (, where and are the respective root-mean-square widths of the density distributions) obtained with Monte Carlo Glauber (MC-Glauber) simulations, to validated the acoustic nature of of the expansion dynamics [14] in RHIC and LHC collisions. This acoustic property predicts a linear relationship between the expansion time () and the initial traverse size (), as well as a characteristic linear dependence of on both and , with slopes and . We use the latter scaling patterns in conjunction with viscous hydrodynamical calculations [15, 16], to calibrate and make estimates of for the plasma produced in Au+Au and Pb+Pb collisions at 200 GeV and 2.76 TeV respectively. A further study of the dependence of , and is then used to search for non-monotonic patterns which could signal the presence of the CEP.
3 Results
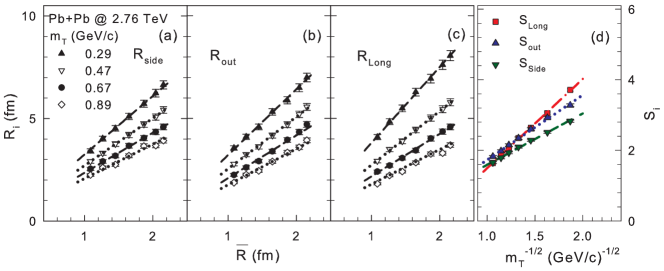
Representative summaries of the the scaling properties of the HBT radii and are shown in Figs. 1 and 2 respectively. Figs. 1(a), (b) and (c) validate the expected linear dependence of , and on . They also show the expected decrease in the slope of the respective scaling curves (for , and ) with increasing transverse mass . The latter confirms the important influence of the space-momentum correlations which result from collective expansion. Fig. 1(d) shows that the slopes , obtained from linear fits (dashed and dotted curves) to the data in panels (a)-(c), scale as and the space-momentum correlations are largest (smallest) in the long (side) direction. They also indicate that, for a given , the full set of differential measurements (as a function of centrality and ) for each radius, can be made to scale to a single curve. Similar scaling patterns were observed for the full range of values spanned by the PHENIX and STAR data sets.
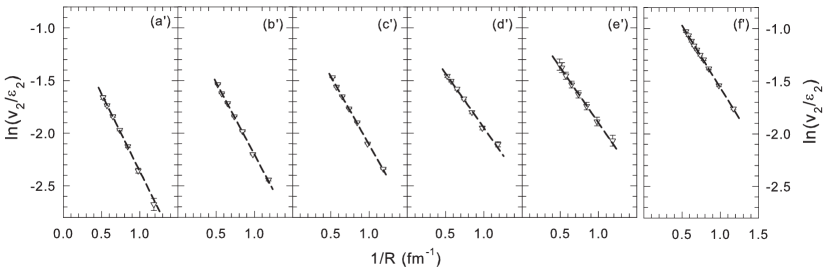
Figures 2() show the expected linear dependence of vs. for the full range of available beam energies. This pervasive pattern of scaling provides the basis for a consistent method of extraction of the viscous coefficient , via linear fits to the scaled data for each beam energy. The characteristic linear dependence of on both and , with slopes and was also observed for viscous hydrodynamical calculations [21]. Consequently, such calculations were used to calibrate and and extract for the plasma produced in Au+Au and Pb+Pb collisions at 200 GeV (RHIC) and 2.76 TeV (LHC) respectively. This procedure give the values ) and which are insensitive to the initial-state geometry model employed [21].
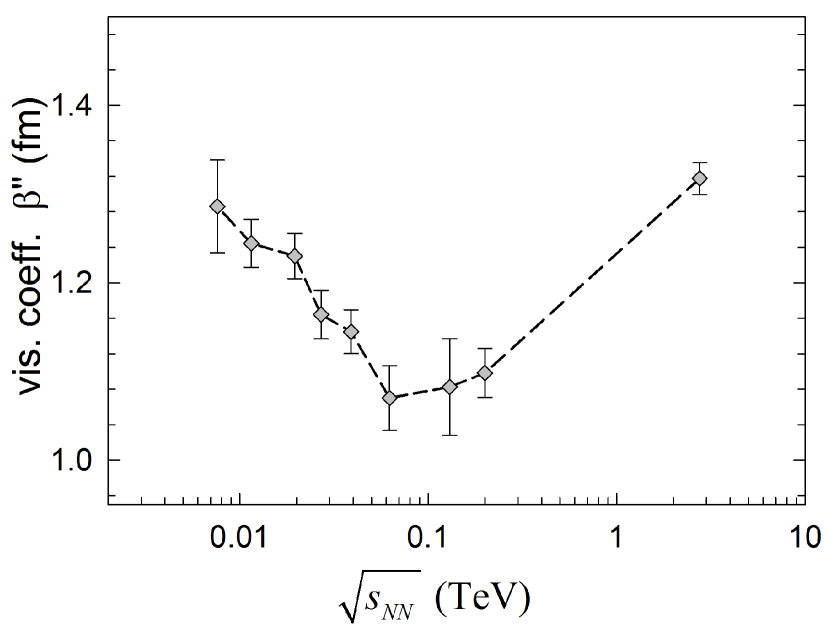
The results from a search for possible non-monotonic patterns linked to the CEP, are summarized in Figs. 4 and 4. The dependence for (Fig. 4) shows a decreasing trend from GeV to approximately 62.4 GeV, followed by a relatively slow increase from GeV - 2.76 TeV. Here, it should be emphasized that the error bars for the extractions made at 62.4, 130 and 200 GeV, as well as a lack of measurements between 39 and 62.4 GeV, do not allow a definitive estimate of the precise location of this apparent minimum. Nonetheless, we associate this characteristic dependence of with the expected trend of for reaction trajectories in the vicinity of the CEP [9, 10]. If this is so, such trajectories should also lead to signatures indicative of a softening of the EOS and a prolonged emission duration. The results from the tests for such signatures are shown in Fig. 4.
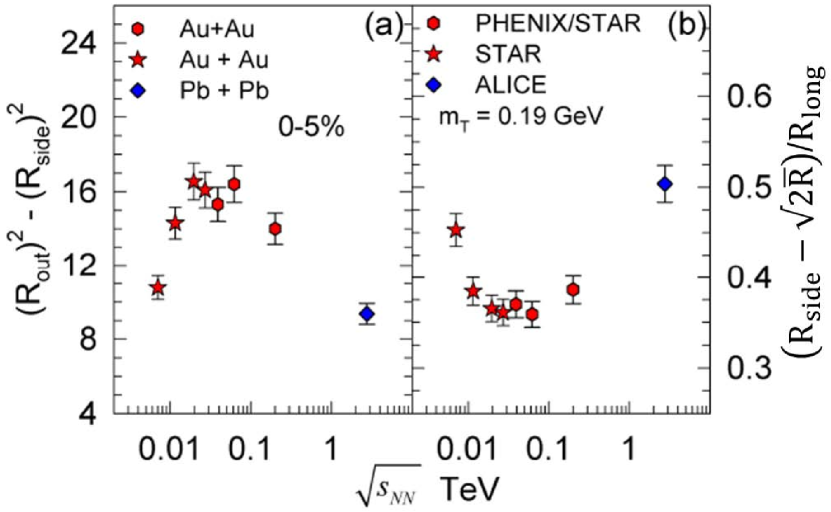
The dependence of and ()/ are shown in Figs. 4 (a) and (b) respectively. ()/ is used as a proxy for the expansion speed since () represent the expansion radius and . Fig. 4 shows the anticipated non-monotonic trends; they indicate a maximum for and a complimentary minimum for in the same narrow span of . These dependencies signal a significant change in reaction dynamics which could also be linked to reaction trajectories close to the CEP.
4 Conclusions
In summary, we have presented a detailed study of the expansion dynamics in relativistic heavy ion collisions, using the combined data sets for flow and HBT measurements in Pb+Pb collisions at TeV and Au+Au collisions spanning GeV. Our study shows that the scaling properties of these measurements validate the characteristic signatures expected for sound propagation in the matter produced in these collisions. They also allow estimates for the dependence of the mean expansion speed , emission duration and the viscous coefficients that encode the magnitude of the specific shear viscosity . The estimates indicate a larger value of for the plasma produced at 2.76 TeV (LHC) compared to that produced at 200 GeV (RHIC) ( and ); these values are insensitive to the choice of the initial-state model employed for the extractions. They also show a non-monotonic dependence for , and , with minima for and , and a complimentary maximum for . These dependencies signal an important change in the reaction dynamics for a narrow range of , which may be linked to reaction trajectories close to the critical end point. Further detailed studies, with improved errors and modeling, are required to make a more precise mapping, as well as to confirm if the observed patterns for , and , are definitively linked to decay trajectories close to the critical end point in the phase diagram for nuclear matter.
Acknowledgments
This research is supported by the US DOE under contract DE-FG02-87ER40331.A008.
References
- Itoh [1970] N. Itoh, Prog. Theor. Phys. 44 (1970) 291–292.
- Shuryak [1983] E. V. Shuryak, CERN-83-01, CERN-YELLOW-83-01 .
- Stephanov et al. [1998] M. A. Stephanov, K. Rajagopal, E. V. Shuryak, Phys.Rev.Lett. 81 (1998) 4816–4819, doi:10.1103/PhysRevLett.81.4816.
- SAsakawa and Yazaki [1989] M. SAsakawa, K. Yazaki, Nucl. Phys. A 504 (1989) 668.
- Aoki et al. [2006] Y. Aoki, G. Endrodi, Z. Fodor, S. Katz, K. Szabo, Nature 443 (2006) 675–678, doi:10.1038/nature05120.
- Lacey et al. [2007a] R. A. Lacey, et al., Phys. Rev. Lett. 98 (2007a) 092301, doi:10.1103/PhysRevLett.98.092301.
- Chapman et al. [1995] S. Chapman, P. Scotto, U. W. Heinz, Phys.Rev.Lett. 74 (1995) 4400–4403, doi:10.1103/PhysRevLett.74.4400.
- Lacey et al. [2014] R. A. Lacey, A. Taranenko, J. Jia, D. Reynolds, N. Ajitanand, et al., Phys.Rev.Lett. 112 (2014) 082302, doi:10.1103/PhysRevLett.112.082302.
- Csernai et al. [2006] L. P. Csernai, J. Kapusta, L. D. McLerran, Phys.Rev.Lett. 97 (2006) 152303, doi:10.1103/PhysRevLett.97.152303.
- Lacey et al. [2007b] R. A. Lacey, N. Ajitanand, J. Alexander, P. Chung, J. Jia, et al., arXiv:0708.3512 .
- Rischke and Gyulassy [1996] D. H. Rischke, M. Gyulassy, Nucl.Phys. A608 (1996) 479–512, doi:10.1016/0375-9474(96)00259-X.
- Lacey et al. [2013a] R. A. Lacey, Y. Gu, X. Gong, D. Reynolds, N. Ajitanand, et al., arXiv:1301.0165 .
- Lacey et al. [2011] R. A. Lacey, A. Taranenko, N. Ajitanand, J. Alexander, arXiv:1105.3782 .
- Staig and Shuryak [2011] P. Staig, E. Shuryak, Phys.Rev. C84 (2011) 034908, doi:10.1103/PhysRevC.84.034908.
- Song et al. [2011] H. Song, S. A. Bass, U. Heinz, T. Hirano, C. Shen, Phys.Rev. C83 (2011) 054910, doi:10.1103/PhysRevC.83.054910,10.1103/PhysRevC.86.059903.
- cms [????] See Fig. 14 in CMS PAS HIN-12-011., ????
- Kisiel [2011] A. Kisiel, PoS WPCF2011 (2011) 003.
- Adamczyk et al. [2012] L. Adamczyk, et al., Phys.Rev. C86 (2012) 054908, doi:10.1103/PhysRevC.86.054908.
- Agakishiev et al. [2012] G. Agakishiev, et al., Phys.Rev. C86 (2012) 014904, doi:10.1103/PhysRevC.86.014904.
- Chatrchyan et al. [2013] S. Chatrchyan, et al., Phys.Rev. C87 (2013) 014902, doi:10.1103/PhysRevC.87.014902.
- Lacey et al. [2013b] R. A. Lacey, D. Reynolds, A. Taranenko, N. Ajitanand, J. Alexander, et al., arXiv:1311.1728 .
- Adamczyk et al. [2014] L. Adamczyk, et al., arXiv:1403.4972 .