The blob crashes into the mirror:
modelling the exceptional -ray flaring activity of 3C 454.3 in November 2010
Abstract
3C 454.3 is a prominent Flat Spectrum Radio Quasar that in recent years attracted considerable attention because of its variable high-energy emissions. In this paper we focus on the exceptional flaring activity of 3C 454.3 that was detected by AGILE and by Fermi-LAT in November, 2010. In the light of the time varying data ranging from the radio, optical, X-ray up to GeV -ray bands, we discuss a theoretical framework addressing all data in their overall evolution. For two weeks the source has shown a plateau of enhanced GeV emission preceding a sudden major flare lasting about 3 days before decaying. The -ray flare onset is abrupt (about 6 hours), and is characterized by a prominent ”Compton dominance” with the GeV flux exceeding the pre-flare values by a factor of 4-5. During this episode, the optical and X-ray fluxes increased by a factor around .
Within the standard framework of a jet launched with a Lorentz bulk factor from a central black hole, we explore the yields of two alternatives. Case 1, with high-energy emission originating within the broad line region (BLR); and Case 2, with most of it produced outside, at larger distances of a few parsecs. We show that Case 1 has considerable problems in explaining the whole set of multifrequency data. Case 2, instead, leads to a consistent and interesting interpretation based on the enhanced inverse Compton radiation that is produced as the jet crashes onto a mirror cloud positioned at parsec scales. This model explains the -ray vs. optical/X-ray behavior of 3C 454.3, including the otherwise puzzling phenomena such as the prominent ”orphan” optical flare, and the enhanced line emission with no appreciable -ray counterpart that preceded the GeV -ray flare. It also accounts for the delayed onset of the latter on top of the long plateau. Our modelling of the exceptional 3C 454.3 -ray flare shows that, while emission inside the canonical BLR is problematic, major and rapid variations can be produced at parsec scales with moderate bulk Lorentz factors . Our ”crashed mirror” model is also applicable to other blazar flares marked by large Compton dominance of the emitted radiation such as the flare of PKS 1830-211 in October 2010.
1 Introduction
Blazars are powered by massive black holes (BH) which launch relativistic jets with considerable bulk Lorentz factors that are aligned with our line of sight. The variability of their flux radiated in different energy bands provides a promising avenue to understand the physical processes involved in particle acceleration and in the high energy emissions from such sources.
Blazars of the Flat Spectrum Radio Quasar (FSRQ) type are characterized by beamed continuum emission in the IR-optical-UV bands of synchrotron radiation nature and also show broad optical emission lines (e.g., Peterson, 2006; Netzer, 2006). Variations of the flux in the optical continuum are often observed to be correlated and simultaneous with flux variations in higher energy bands. This indicates a key role in the -ray emission played by inverse Compton scattering of surrounding seed photons off the same highly relativistic electrons that radiate the synchrotron. Adequate seed photons can be supplied not only by the beamed synchrotron emission itself (the so called Synchrotron Self Compton, process, SSC see Jones et al., 1974; Marscher, 1983; Ghisellini et al., 1985, but also by more distributed sources outside the jet that produce external inverse Compton (EC) scattering of seed photons off the highly relativistic electrons in the jet (e.g., Sikora et al., 1994; Paggi et al., 2011). Such sources are constituted by the accretion disk around the BH, and by ionized clouds of gas generally organized in a Broad Line Region (BLR) that scatter/reprocess the ionizing radiation from the disk (see Ghisellini & Madau, 1996), and also by the embracing dusty torus (Sikora et al., 2002). However, some interesting new observations challenge this basic picture, and stimulate discussions on the nature of the seed photons and on the location of the -ray production site in FSRQs.
A first challenging instance has been provided by PKS 1830-211 () which during a one-month enhancement up to photons cm-2s-1 in -rays around 1 GeV exhibited a strong flare around 14 October 2010: the -ray flux reached photons cm-2s-1 in five hours (Ciprini et al., 2010 Atel 2943), with very little or no radio, optical and X-ray counterparts (Donnarumma et al., 2011). This curious behavior can be understood by considering rapid and strong variations in the density of external seed photons as seen by a relativistically moving blob or plasmoid in the jet as it approaches the BLR system of clouds.
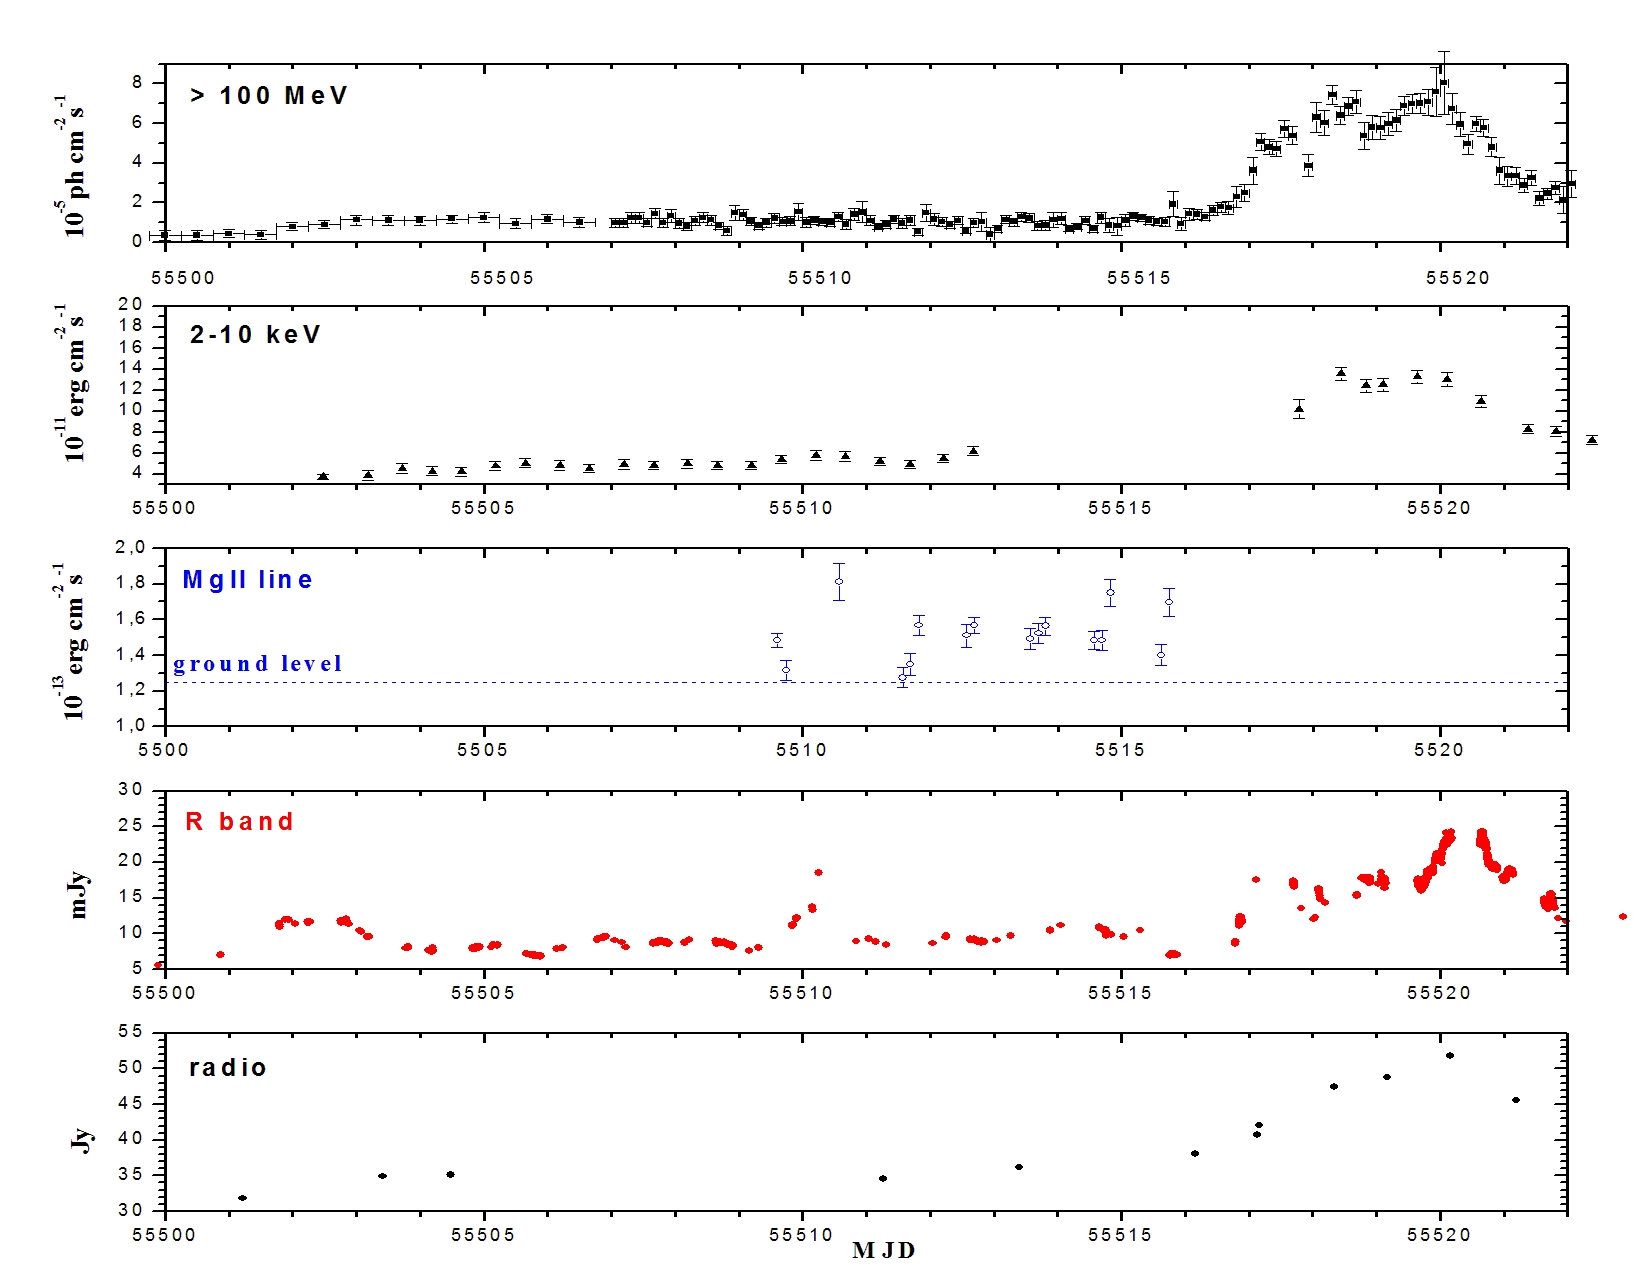
An even richer set of data was provided by the exceptional flare of the 3C 454.3 () at GeV energies. This object entered a high state on 2 November 2010 maintaining -ray fluxes around photons cm-2s-1 for a week. Thereafter the source was observed by AGILE and by Fermi-LAT in the energy range 100 MeV - 30 GeV while jumping up by a factor 4 on 17 November 2010, and reaching the peak flux photons cm-2s-1 on 20 November 2010. During this period, the source was extensively monitored in the radio, IR, optical, and X-ray bands (see Vercellone et al., 2010, 2011; Striani et al., 2010; Abdo et al., 2011; Wehrle et al., 2012; Jorstad et al., 2013). Models of the high energy emission have been presented in Khangulyan et al., 2013 and Wehrle et al., 2012 (see also Marscher, 2014).
In FSRQs, -ray emission above 100 MeV often appears to be correlated with radio emission as shown by the analysis of Wehrle et al., 2012. On the other hand, simultaneity of optical and UV emissions with rays is often dubious. In particular, in 3C 454.3 a strong precursor was observed in the R, optical and UV bands on November 10, 2010, i.e., seven days before the -ray jump and ten days before the -ray peak (see Fig. 2). Unfortunately, radio and IR data were not obtained during this episode, while the optical has been observed to double its flux and then fall back in one day. Around 10 November 2010, the high energy component of the 3C 454.3 spectrum showed at most a modest enhancement by % in X-rays, and less or none in rays.
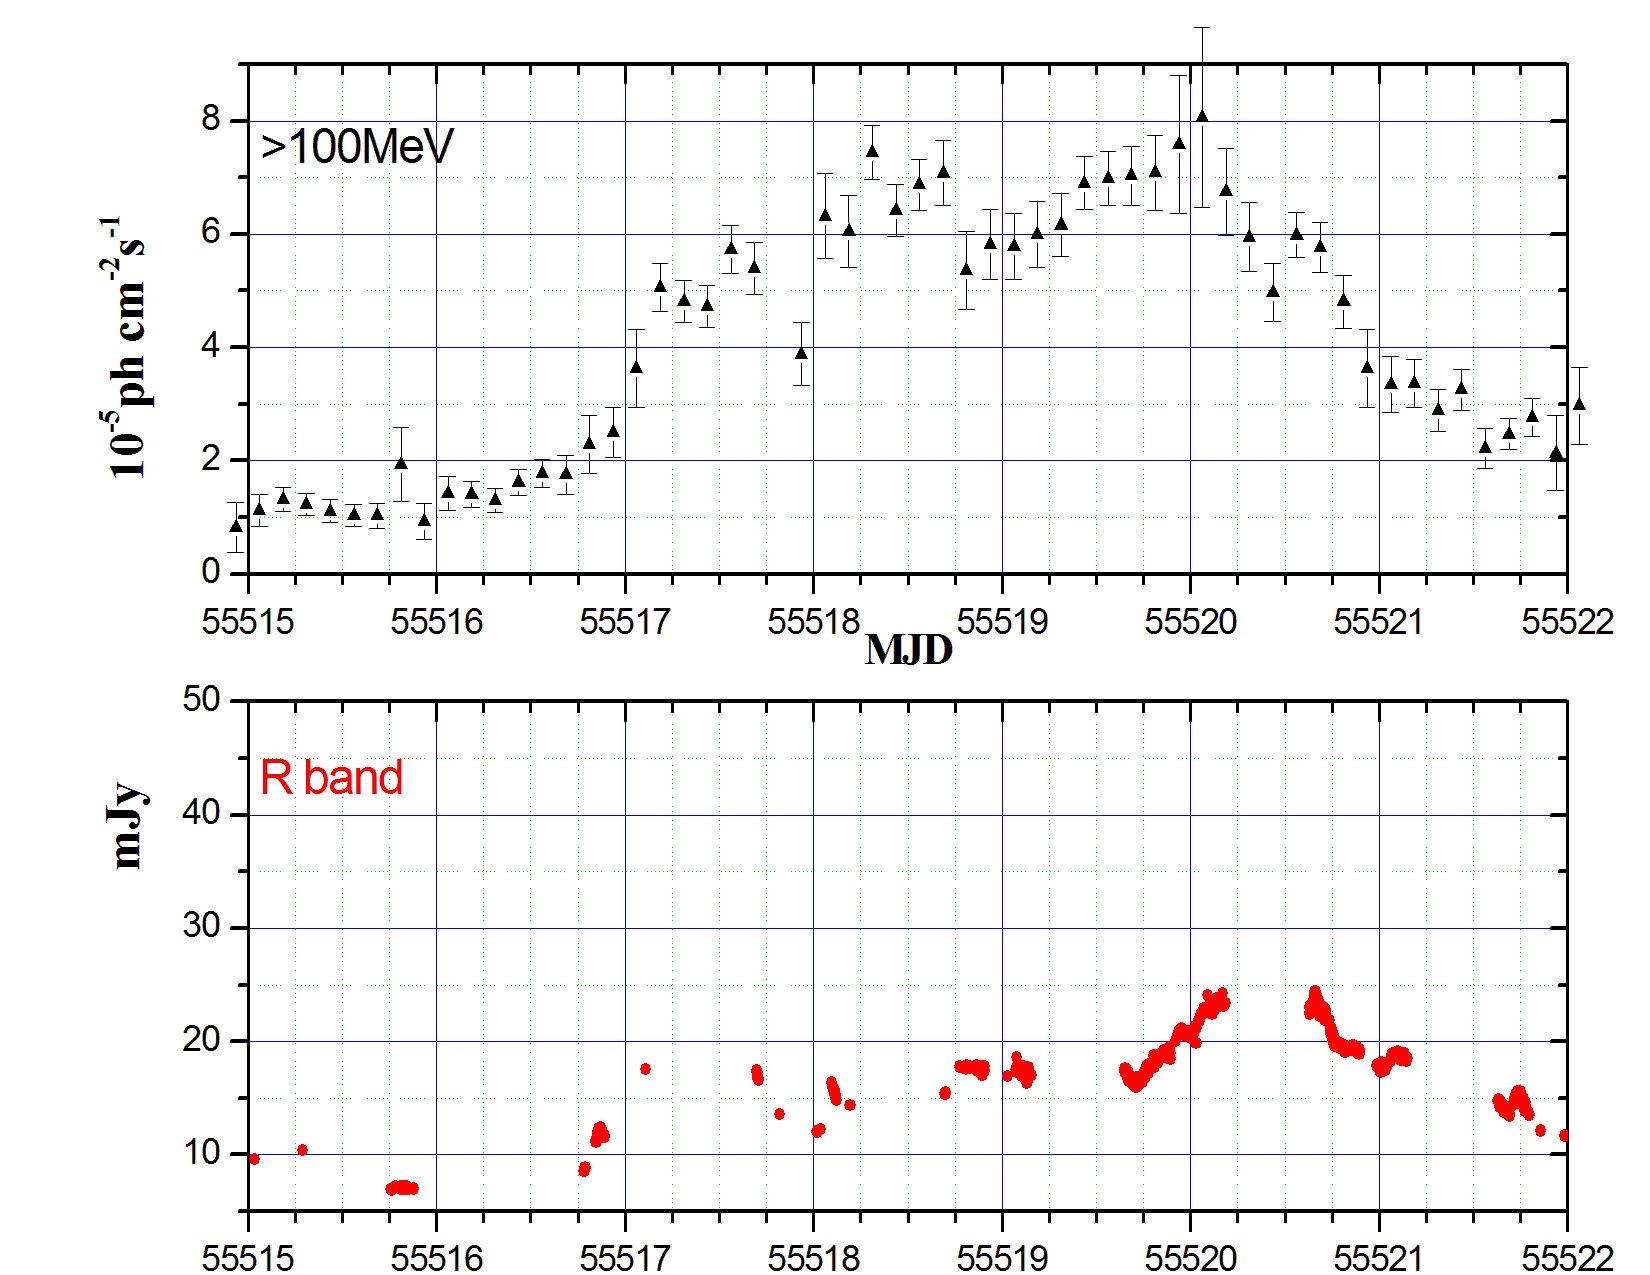
Remarkably, on November 17, 2010 the -ray flux jumped up by a factor of 4 on a timescale significantly shorter than 1 day, whereas the optical and X-ray fluxes increased only by a factor of 2. Moreover, the -ray flux showed variations by on a timescale of 3 hours, whereas similar optical and X-ray variations occurred on a timescale of 6 hours (see Figs. 2 and 3). These facts challenge models based on synchrotron and inverse Compton emission from a homogeneous region. Strong and fast -ray variations with milder or no counterparts in X-ray and optical require correspondingly strong and fast variations in seed photon density as seen by an emitting region moving along the jet with bulk Lorentz factors , as envisioned in Vercellone et al., 2011. It is interesting to note that in 3C 454.3 a remarkable radio plasmoid, named ”K10”, was detected by Jorstad et al., 2013 to emerge from the radio core about 160 days after the super-flare. By tracing back the trajectory of K10 the authors deduced a close starting time of the plasmoid and of the -ray flaring activity. This finding supports the view advocated in the present paper that relativistically moving plasmoids in the jet are also related to the high-energy emission of 3C 454.3.
Furthermore, Leon-Tavares et al., 2013 reported variations of the MgII emission line in 3C 454.3 during the month of November 2010 (see also Isler et al., 2013). These observations suggest that ”mirror” processes involving a plasmoid that approaches a specific gas cloud are relevant to the -ray flare event; mirror models considerably contributing to the local density of seed photons have been applied to clouds in the BLR by Ghisellini & Madau, 1996; Böttcher & Dermer, 1998. In the present paper we take up the view that mirror effects operate to cause complex, multi-frequency behavior of 3C 454.3 also at parsec scales, where Wehrle et al., 2012 (see also Jorstad et al., 2012) locate the high energy emissions of 3C 454.3 .
In fact, we will present here a physical model covering the multi-band behavior of 3C 454.3 during its exceptional activity of November 2010, and study the resulting constraints on the -ray emission processes and location. In Sect. 2 we discuss some mechanisms that can lead to strong flares in -ray band by the EC process. In Sect. 3 we model the activity and the flare of 3C 454.3 in Nov. 2010. Sect. 4 is devoted to discuss our results, and Sect. 5 summarizes our conclusions. The Appendix contains expressions and references that we used in computing our model.
In the observed physical quantities (timescales, and radiative fluxes) we include the cosmological redshift effects in standard form; we adopt the ”concordance cosmology”: flat geometry with round parameters km s-1Mpc-1, and .
2 Two scenarios for -ray flaring by EC of cloud photons
We consider a multi-zone, time-dependent, leptonic jet model focused on a schematic and yet effective geometry that bases on relativistic plasmoids traveling outwards of the compact source of 3C 454.3 , and moving toward, through and beyond the BLR shell. For the interactions of plasmoids with clouds we consider two main scenarios which can lead to -ray flaring behavior (see Fig. 1). Our radiation model is focused on EC scattering to GeV rays of soft seed photons; the most relevant seeds are constituted by the optical-UV photons coming from clouds in the main BLR or beyond, that interact face-on with the jet electrons. We consider in our calculations seed photons contributed by the dusty torus and by the accretion disk, entering from behind and sideways; these seed photons contribute mostly to the weaker hard X-ray radiations (Sikora et al., 2002; Ghisellini & Tavecchio, 2008). In our calculations of relevant quantities we will consider two frames: the laboratory frame (marked by unprimed symbols), and the co-moving frame (marked by primed symbols).
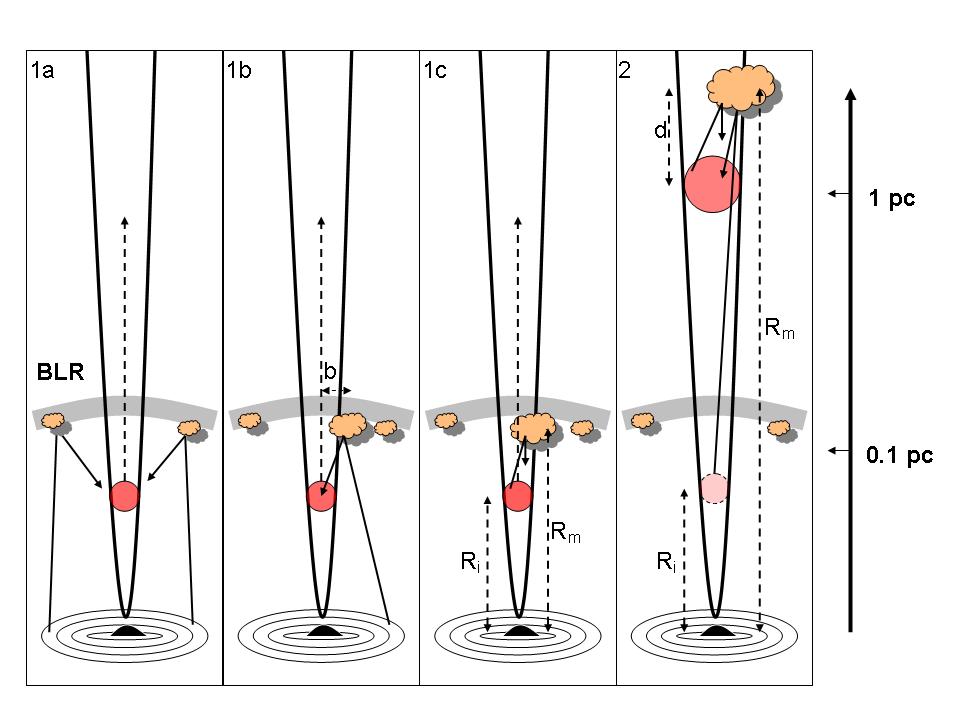
2.1 Case 1: seed photons from clouds in the BLR
Clouds in a BLR shell surround a blazar central engine at a distance cm, and cover a small fraction of the solid angle; at larger distances, the disk becomes inefficient to adequately ionize the clouds (see Netzer, 2006; Peterson, 2006). Clouds typically scatter/reprocess the ionizing disk luminosity and re-emit a fraction thereof; thus an average photon energy density
| (1) |
is present within (see Fig. 1, Case 1a). This provides adequate seed photons to be upscattered into rays by the electrons in a plasmoid of comoving size scale , itself moving with velocity and a Doppler factor ( is the angle of the jet axis relative to our line of sight, and 10 is the bulk Lorentz factor of the plasmoid, see Begelman et al., 1984). In fact, the plasmoid experiences in its reference frame a boosted field (Dermer & Schlickeiser, 1994).
Correspondingly, fast -ray variability can be observed on a timescale , where is the light crossing time of the plasmoid in the comoving frame. Variability in rays (and in X rays) is expected to be produced by EC scattering, and to be closely correlated with the variability of the synchrotron emission from the jet; as a result, optical and -ray emissions vary by similar amounts on similar time scales. The relativistic motion of the plasmoid along the jet causes the -ray radiation by EC from the BLR seeds to be observed for a time
| (2) |
that for viewing angles becomes 1 day.
Similar expressions also apply in the case of seed photons steadily originating from a dusty torus, on replacing with the torus effective distance pc, and erg s-1 with the infrared torus luminosity (e.g., Ghisellini & Tavecchio, 2008). Detailed treatments of seed photon field anisotropies have been developed at increasingly sophisticated levels by several authors ( e.g., Böttcher & Bloom, 2000; Dermer et al., 2009; Marscher, 2014; Joshi et al., 2014). For -ray production the most relevant seeds are constituted by the optical-UV photons coming from clouds in the BLR, that interact face-on with the jet electrons; here we focus on the strong anisotropies in the comoving frame introduced by the relativistic motion of the plasmoid (see Appendix, and Dermer & Schlickeiser, 1993). We denote this disposition with ”Case 1a” in Fig. 1.
The expression in Eq. 1 was derived on assuming that the BLR constitutes a continuous surface that partially reprocesses the ionizing radiation from a much smaller disk; it describes an average photon field which is nearly uniform within and steady on a 1-day time scale. But when a plasmoid of comoving radius cm approaches with impact parameter a cloud of size cm, the discrete nature of the BLR emerges. Strong anisotropy effects (e.g., Dermer et al., 2009) appear when the plasmoid approaches a specific cloud, either in the canonical BLR shell (of width ) or beyond; therefore, we focus on the ”head-on” geometry, a condition for which it is reasonable to consider an isotropic seed photon field.
We take and focus on the main kinematic and radiative features. A locally enhanced radiation field
| (3) |
obtains during the crossing time . The moving blob experiences a boosted field . During the plasmoid-cloud interaction the EC radiation leads to observed flux variations by a factor
| (4) |
in the -ray band only; this implies a short observed timescale a few hours (see Eq. 2). The factor in Eqs. 3 and 4 arises from the fact that now the reflecting cloud obviously covers of the projected cloud surface .
Such a disposition (that we denote Case 1b in Fig. 1) can explain the enhanced EC radiation in the -ray band during flares with no correlated counterparts in other bands. In fact, these flares are likely due to a local enhancement of optical-UV external photons close to the plasmoid; the observer detects these photons as scattered by the relativistic electrons in the plasmoid to energies , where and are the electron and seed photon energies. On the other hand, the possibility that a plasmoid meets a cloud system as described above is confined to distances cm from the central black hole, where dense, disk-illuminated clouds are realistic. We note that the rate of such plasmoid-cloud encounters is expected to be low just because of the small BLR overall covering factor .
The process can produce Compton dominance in events such as the one from 3C 454.3 in November 2010 (see Vercellone et al., 2011), and in the ”orphan” -ray flare of PKS 1830-211 in October 2010 (Donnarumma et al., 2011). However, by itself it offers no explanation for the other, long delayed emissions from 3C 454.3; a similar conclusion has been reached by Joshi et al., 2014 after a detailed treatment of the spectral evolution during the plasmoid outflow toward the BLR.
2.2 Case 2: seed photons from a mirroring cloud beyond the BLR
In this Section we proceed to consider the interaction of a plasmoid with single clouds illuminated by it. The case of a mirror cloud positioned inside the BLR shell has been treated by Ghisellini & Madau, 1996, and by Böttcher & Dermer, 1998, see Fig. 1, Case 1c. In this configuration a cloud is illuminated by the emission from the plasmoid itself, and the effective seed field is considerably contributed by the photons scattered back by the cloud. The observed time lags between optical emission (originated closer to the BH) and the mirror emission are expected to be of order 1 day only (see Eq. 2). Thus we consider a more extended configuration based on a mirror cloud located outside the BLR ( Fig. 1, Case 2). This configuration is marked by long time lags and rare occurrence, both fitting the 3C 454.3 features as we discuss below.
Let us then consider a cloud located at distance from the BH and crossing the jet outflow. At such distances from the BH, the disk becomes inefficient for ionizing clouds (e.g., Netzer, 2006; Peterson, 2006); on the other hand, reprocessing material with velocity dispersions km can still be present there. In such a case, the illuminating continuum for a moving plasmoid can be provided in the forward direction by the plasmoid itself; in fact, its beamed synchrotron emission illuminates a cone with aperture around the jet axis.
Specifically, we consider a mirroring cloud placed at a distance a few parsecs along the jet axis, and a plasmoid with bulk Lorentz factor emitting an intrinsic synchrotron power . Owing to the plasmoid relativistic motion, these seed photons (emitted at distance from the BH) re-enter the plasmoid when the latter is very close to the mirroring cloud, namely, at a distance
| (5) |
where we have taken into account the causality constraint pointed out by Böttcher & Dermer, 1998, that in our case reads . Thus the plasmoid experiences in its frame a doubly boosted, local photon density, starting from and suddenly growing up to the limiting value
| (6) |
when remains closely constant just on reaching the mirror (see also Ghisellini & Madau, 1996 and Böttcher & Dermer, 1998 for applications of the process within the BLR). In the above, we assumed the intervening cloud to fill the cone illuminated by the beamed synchrotron radiation when the mirror cloud has a size comparable with the jet radius. Such a ”head-on” geometry maximizes the radiative output as shown by Dermer & Schlickeiser, 1992.
Thus a ”mirror-flash” can be radiated in the -ray band due to EC of reprocessed photons off the relativistic electrons in the plasmoid. Eventually, the plasmoid impacts the mirror and radiates a broad-band synchrotron - EC flare (see Fig. 4 and 5); this will be observed to closely follow the mirror flash with a time lag
| (7) |
which can be as short as 1/2 hour. On the other hand, the typical duration of the mirror flash is a few hours, where cm is the size of the outer mirroring cloud (see Fig. 1, case 2). Since we assume , the mirror flash and the impact flare are expected to appear nearly simultaneous.
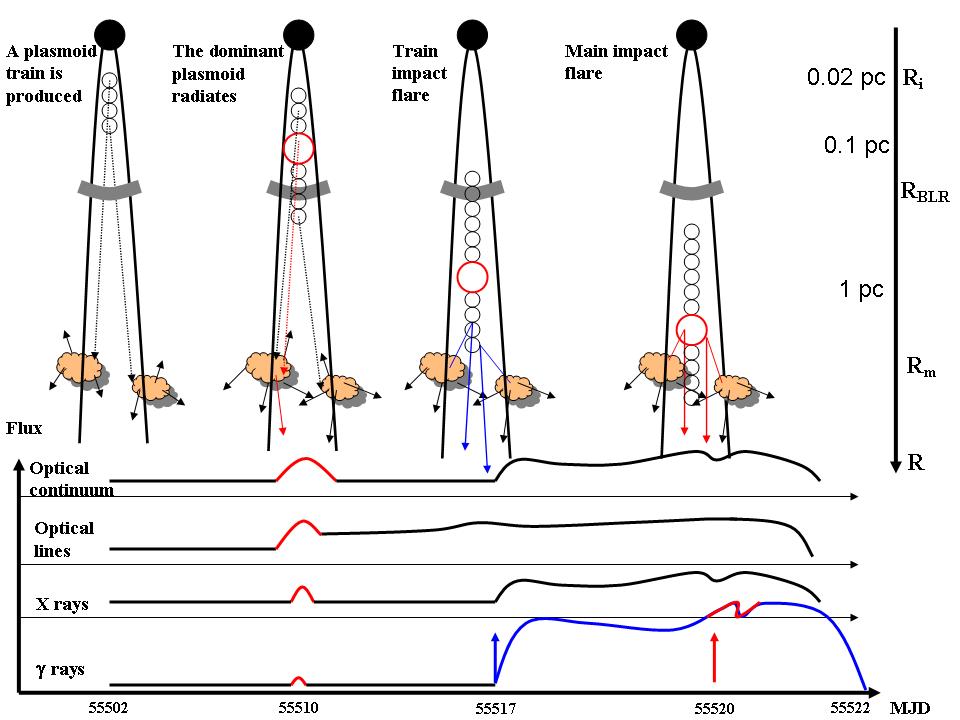
A feature supporting this view is provided by a variation of the emission line flux simultaneous with the optical continuum’s variation; an enhancement of in the lines is expected when the optical continuum from the plasmoid doubles its flux and ionizes a mirror on its trajectory (Ghisellini & Madau, 1996, see also Leon-Tavares et al., 2013; Isler et al., 2013). Fig. 6 outlines the spectral evolution associated with the geometry of Case 2.
3 Modelling the exceptional -ray flare of 3C 454.3 in November 2010
The 3C 454.3 lightcurves observed in different bands (see Figs. 2 and 3) show the activity of 3C 454.3 to start around MJD 55502, with fluxes in the optical, X-ray and -ray bands that double in one day relative to the baseline values. Then the fluxes stay at these enhanced levels for two weeks (the plateau level of -ray emission). On MJD 55510, the optical and UV fluxes showed a remarkable flare with no -ray variation; they then doubled, and eventually fell back to the previous value in one day, with no comparable variations in other bands, except for a moderate enhancement of in soft X rays .
Around MJD 55517, the -ray flux dramatically jumped up by a factor of while the optical and X rays increased simultaneously by only a factor of . At later times, -ray, X-ray and optical fluxes increased together by the same factor, up to a maximum around MJD 55520, after which they decreased together. Remarkably, during the entire period of activity a significant enhancement of the emission line flux was detected especially since MJD 55510 as reported by Leon-Tavares et al., 2013 and Isler et al., 2013; as we discuss below, this line emission plays an important role in our modelling. We stress that such a complex behavior is hard to reconcile with standard co-spatial models of broad-band emissions for the whole stretch of activity.
Radio maps (Wehrle et al., 2012) show that the -ray flare activity is in apparent coincidence with the super-luminal knot K10 which is observed to cross the core with size pc. The plasmoid K10 is resolved on its detaching from the core yr after the -ray flare. We note that the light travel-time yr at a viewing angle corresponds to an observed (Doppler contracted) lag of 0.5 yr for (see Eq. 2), with an (apparent) projected super-luminal speed . In the detailed timing of the radio knot allowance should be made for an initial self-absorbed stage at mm wavelengths111Detailed fits to the radio spectra are beyond the scope of the present paper..
Toward understanding the complex multifrequency behavior of 3C 454.3 during the entire activity, we start from the standard picture of a single plasmoid propagating inside the BLR. On crossing the BLR the plasmoid produces -ray emission of expected duration 1 day (see Eq. 2). At later times, the plasmoid interacts with the radiation emitted/reflected by clouds located either close to, or beyond the main BLR as outlined in Figs. 1 and 6. On the other hand, if we assume production of relativistic plasmoids continued for at least 2 weeks in the observer frame, an interesting picture emerges. Such a ”plasmoid train”222A plasmoid train, i.e., a sequence of density enhancements, can be provided either by intrinsically intermittent source activity, or more likely by a sequence of relativistic internal shocks (as proposed by Rees, 1978, and developed by many others including Joshi & Böttcher, 2011). The latter process is appropriate for heavy jets where the energy outflow is dominated by the proton kinetic energy . comprising a dozen plasmoids with a dominant one addresses both issues of major flaring events and of the underlying, month-long plateau.
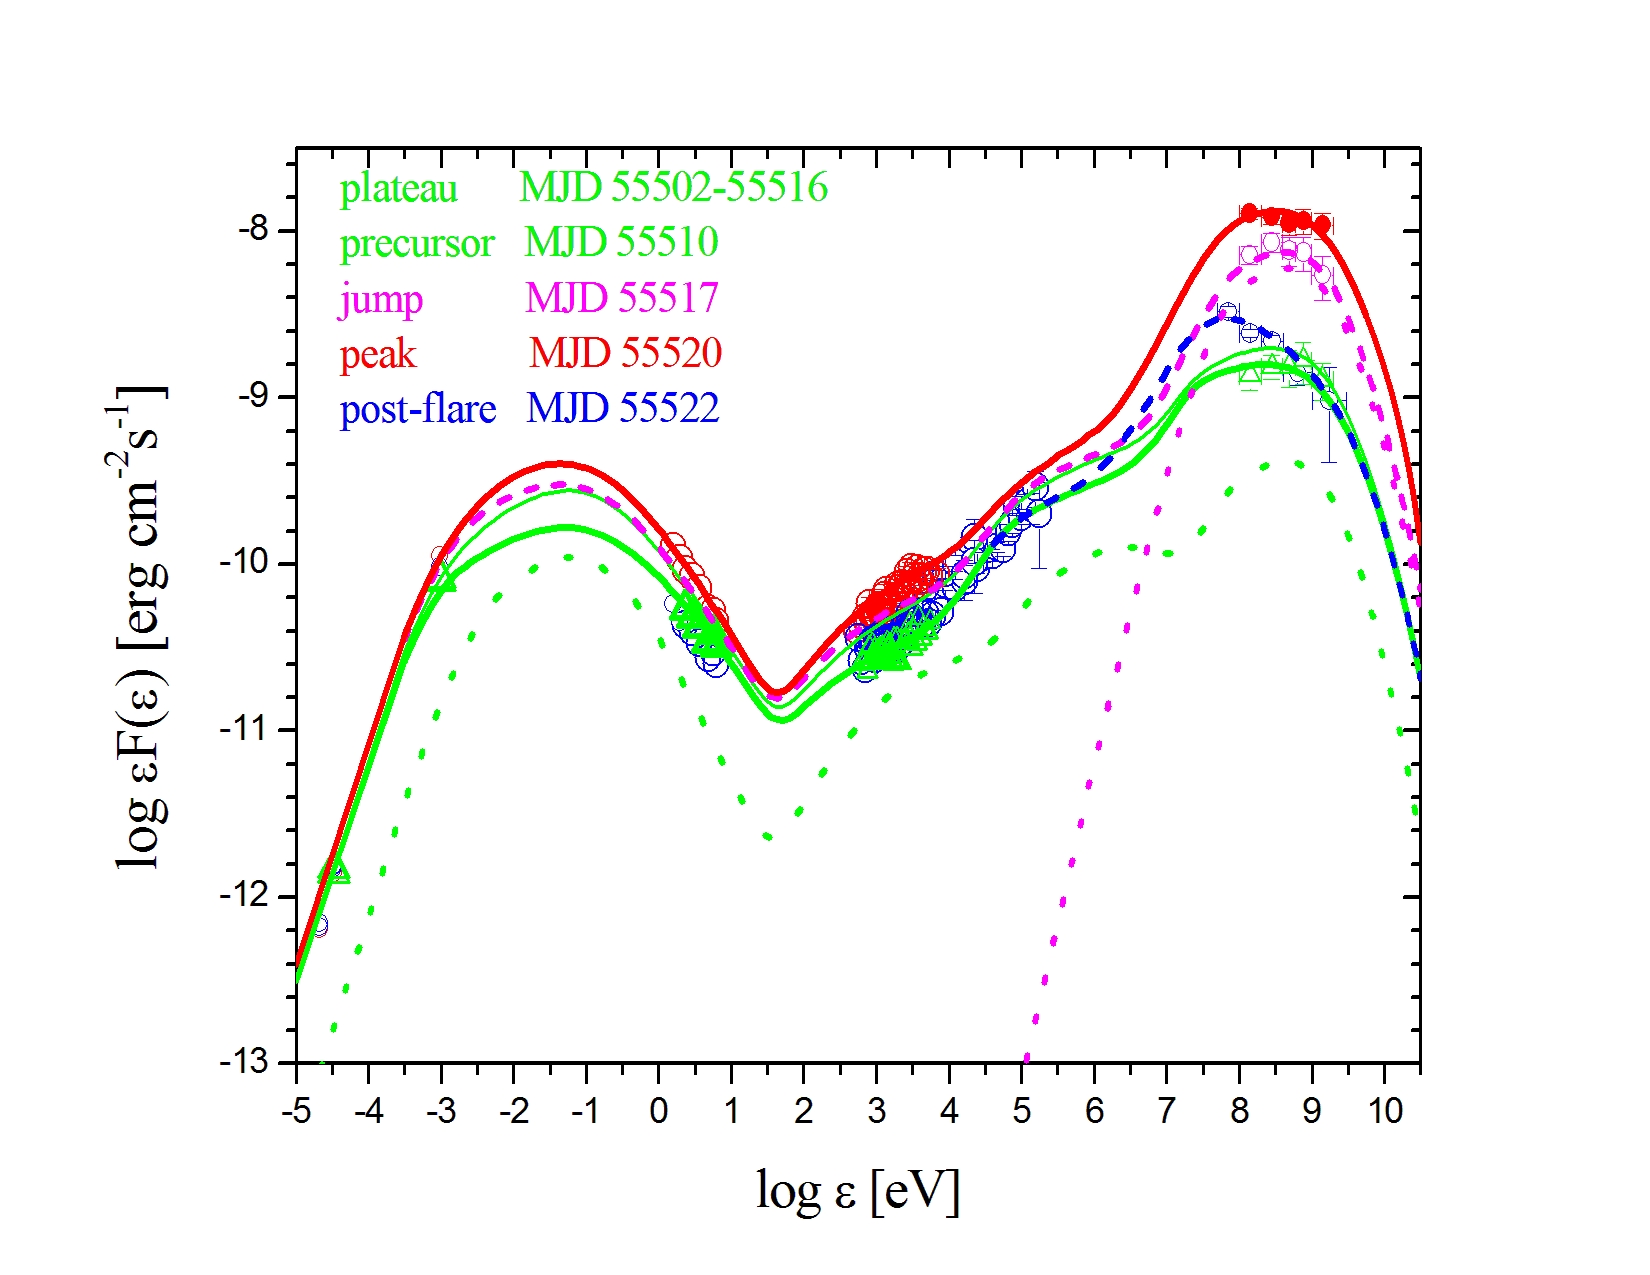
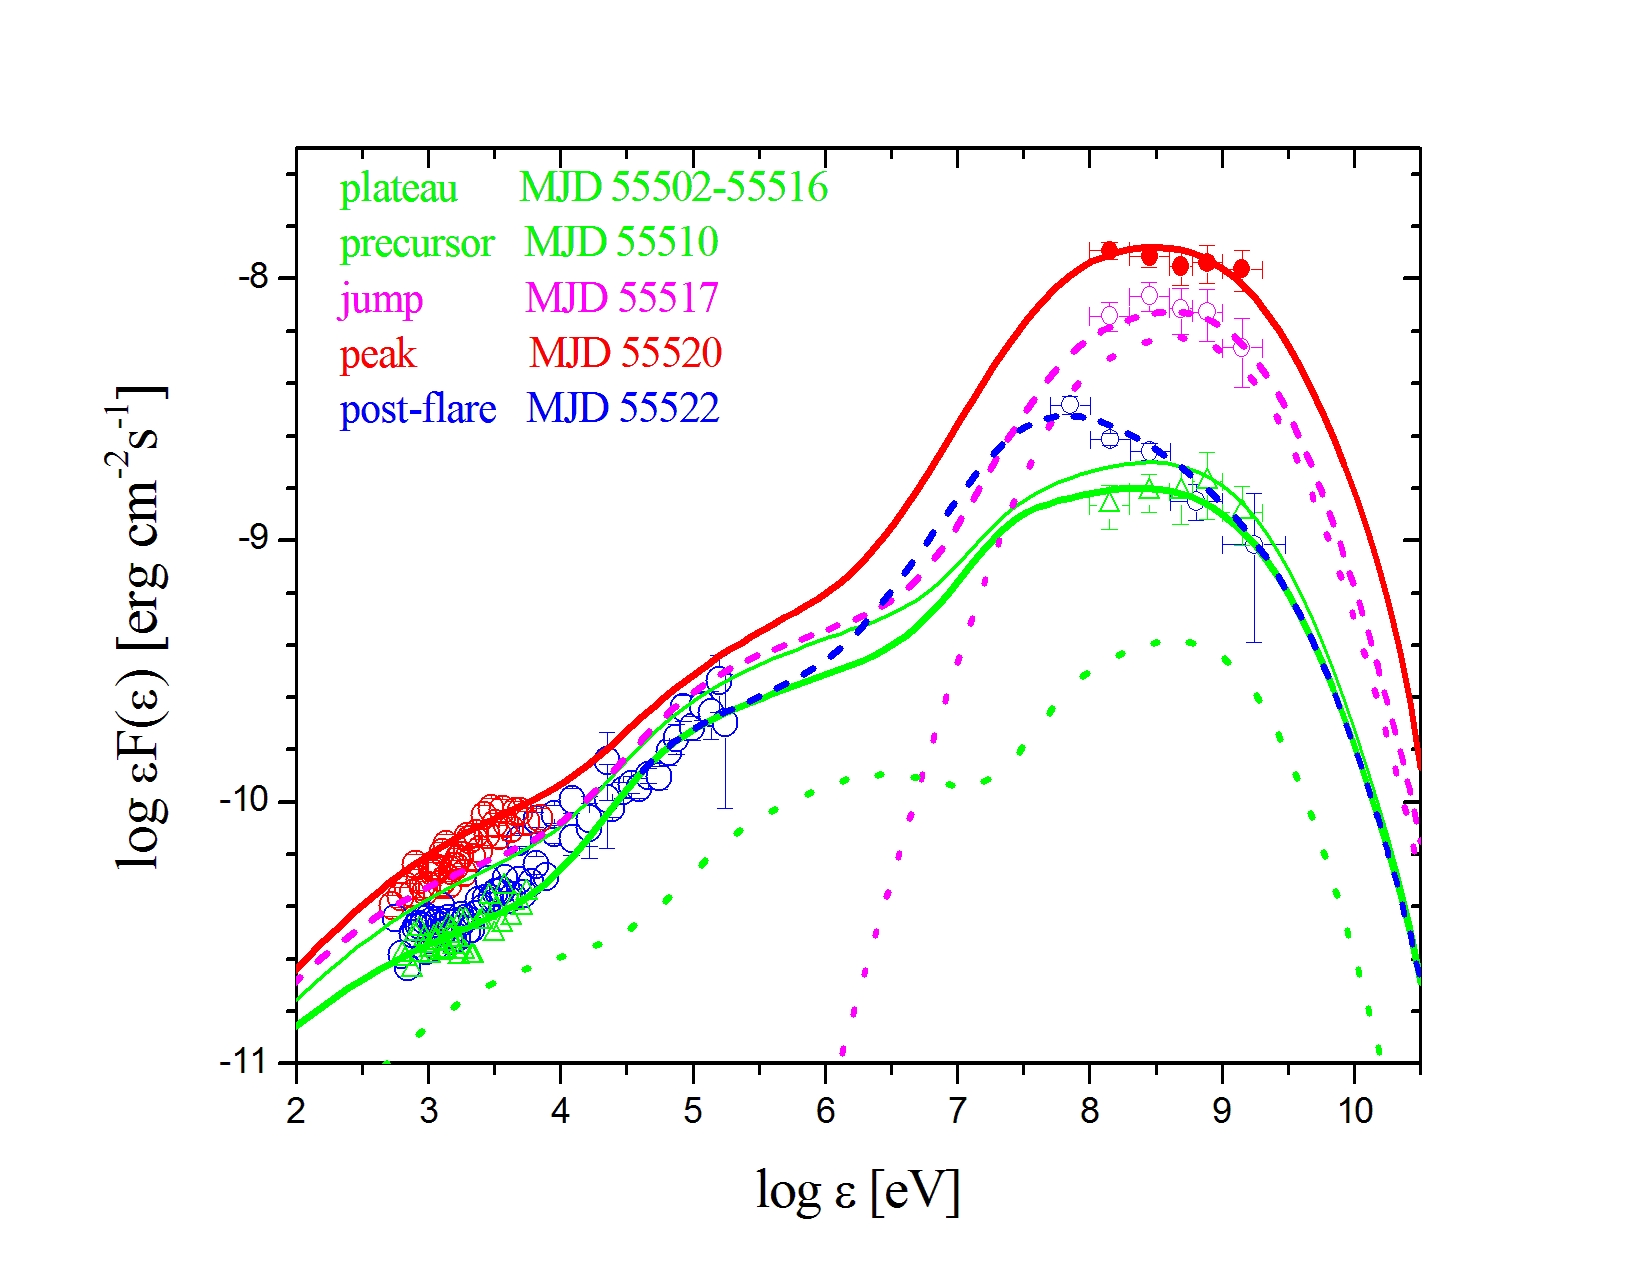
For distances within these plasmoids steadily produce the observed plateau with standard synchrotron plus EC spectra as illustrated in Fig. 1, Case 1a. The EC radiations off seed photons from the disk, the dusty torus and the BLR produce enhancements in X rays and rays by comparable amounts as the synchrotron rises in the IR, optical and UV bands. This picture agrees with the observations covering the first two weeks of plateau activity, i.e., from MJD 55502 to 55516, see green curves in Fig. 4 and the first two panels in Fig. 6 relative to Case 1a.
On the other hand, from a mirror cloud located within, or close to the jet cone at an height pc, (Case 2) we have additional effects on the radiations from the plasmoid train. For the latter to be responsible for the plateau lasting two weeks, the mirror is to be irradiated by the incoming plasmoids, and to re-emit for two weeks in the observer frame. The reflection begins when the leading edge of the emitting train approaches the mirror; in detail, when the distance of the edge from the mirror is (recall from Eq. 5 that is the distance of the edge when the reflected photons re-enter the plasmoid).
When the leading and the following plasmoids reach the mirror and crash into it, powerful electron re-accelerations take place due to strong shocks driven by the impacts themselves (see Khangulyan et al., 2013, and Appendix) and replenish previous losses. The new injections sustain a substantial Compton jump in the -ray band relative to the synchrotron emission detected around MJD 55517. Thereafter, the electrons radiate by synchrotron and by EC in the photon field established by the mirroring cloud (see Fig. 6 last two panels relative to Case 2). When the dominant plasmoid crashes into the mirror synchrotron and dominant EC radiations produce the correlated peaks of similar amounts in the radio, optical, X rays and rays that are detected around MJD 55520. For the production of the optical flare at MJD 55510 we focus on the dominant plasmoid with its enhanced density and magnetic field that travels within the BLR and emits enhanced synchrotron radiation without appreciable EC counterparts (as in Case 1a).
Thus we can understand in detail all the time and spectral features of 3C 454.3 flare emission within our model including a plasmoid train that outflows into a mirroring cloud located far beyond the BLR. Concerning the lag of days between the start of activity (MJD 55502) and the sudden jump in rays at MJD 55517, Eq. 2 leads to an effective travel time (seen at viewing angle ) of days, that corresponds to a length pc. Therefore, in agreement with Wehrle et al., 2012, the peak of the -ray flare episode is mostly radiated at parsec scales from the central BH. We locate the plateau emission and the optical precursor closer to the BH, at the BLR distance or even closer down to a distance cm. The high magnetic fields and electron densities expected to prevail at such close distances lead to enhanced synchrotron emission in the optical-UV. These conditions produce the remarkable optical flare without -ray counterpart that is observed around MJD 55510 as shown in Fig. 2 (see also Fig. 4 and its caption). As anticipated above, this in fact requires the dominant plasmoid to have a higher magnetic field and electron density by some , relative to other components of the plasmoid train (see Table 1). The EC counterpart in X-ray and -ray is not easily detectable in the presence of the relatively strong plateau emission discussed at the beginning of this Section.
The Appendix provides details of our spectral computations. Table 1 summarizes the parameters of our modeling which covers the plateau, the flare, and the post-flare phases. Additional parameters are constituted by the disk luminosity erg cm-2s-1, the injection distance cm, the BLR radius cm, the dusty torus infrared luminosity , the torus effective distance pc; the mirror distance is taken pc and its size cm. Figs. 4 and 5 show the resulting broad-band spectral energy distribution as a function of photon energy.
| Component | B (G) | |||||||
|---|---|---|---|---|---|---|---|---|
| Dominant plasmoid | 12 | 1.1 | 50 | 80 | 2.0 | 4.4 | ||
| Subdominant plasmoids | 15 | 0.9 | 40 | 45 | 2.4 | 4.2 |
The Table provides the main physical parameters of the emitting plasmoids responsible for the emissions plotted in Figs. 4 and 5. The columns give the bulk Lorentz factor , the average comoving magnetic field , and the comoving radius for the dominant and for the average plasmoid in a train of a dozen. The subsequent columns give for the associated electron distribution functions : these are modeled as broken power-law with the normalization , the minimum particle energy , the break , and the low- and high-energy indices and (see Appendix).
Here we stress that our computed spectra agree with the observed overall and specific features. In particular, the slope specifically reflects into the steep shape of the optical - UV continuum, and the flatter slope into the relatively flat shape in rays in the range 100 MeV - 1 GeV.
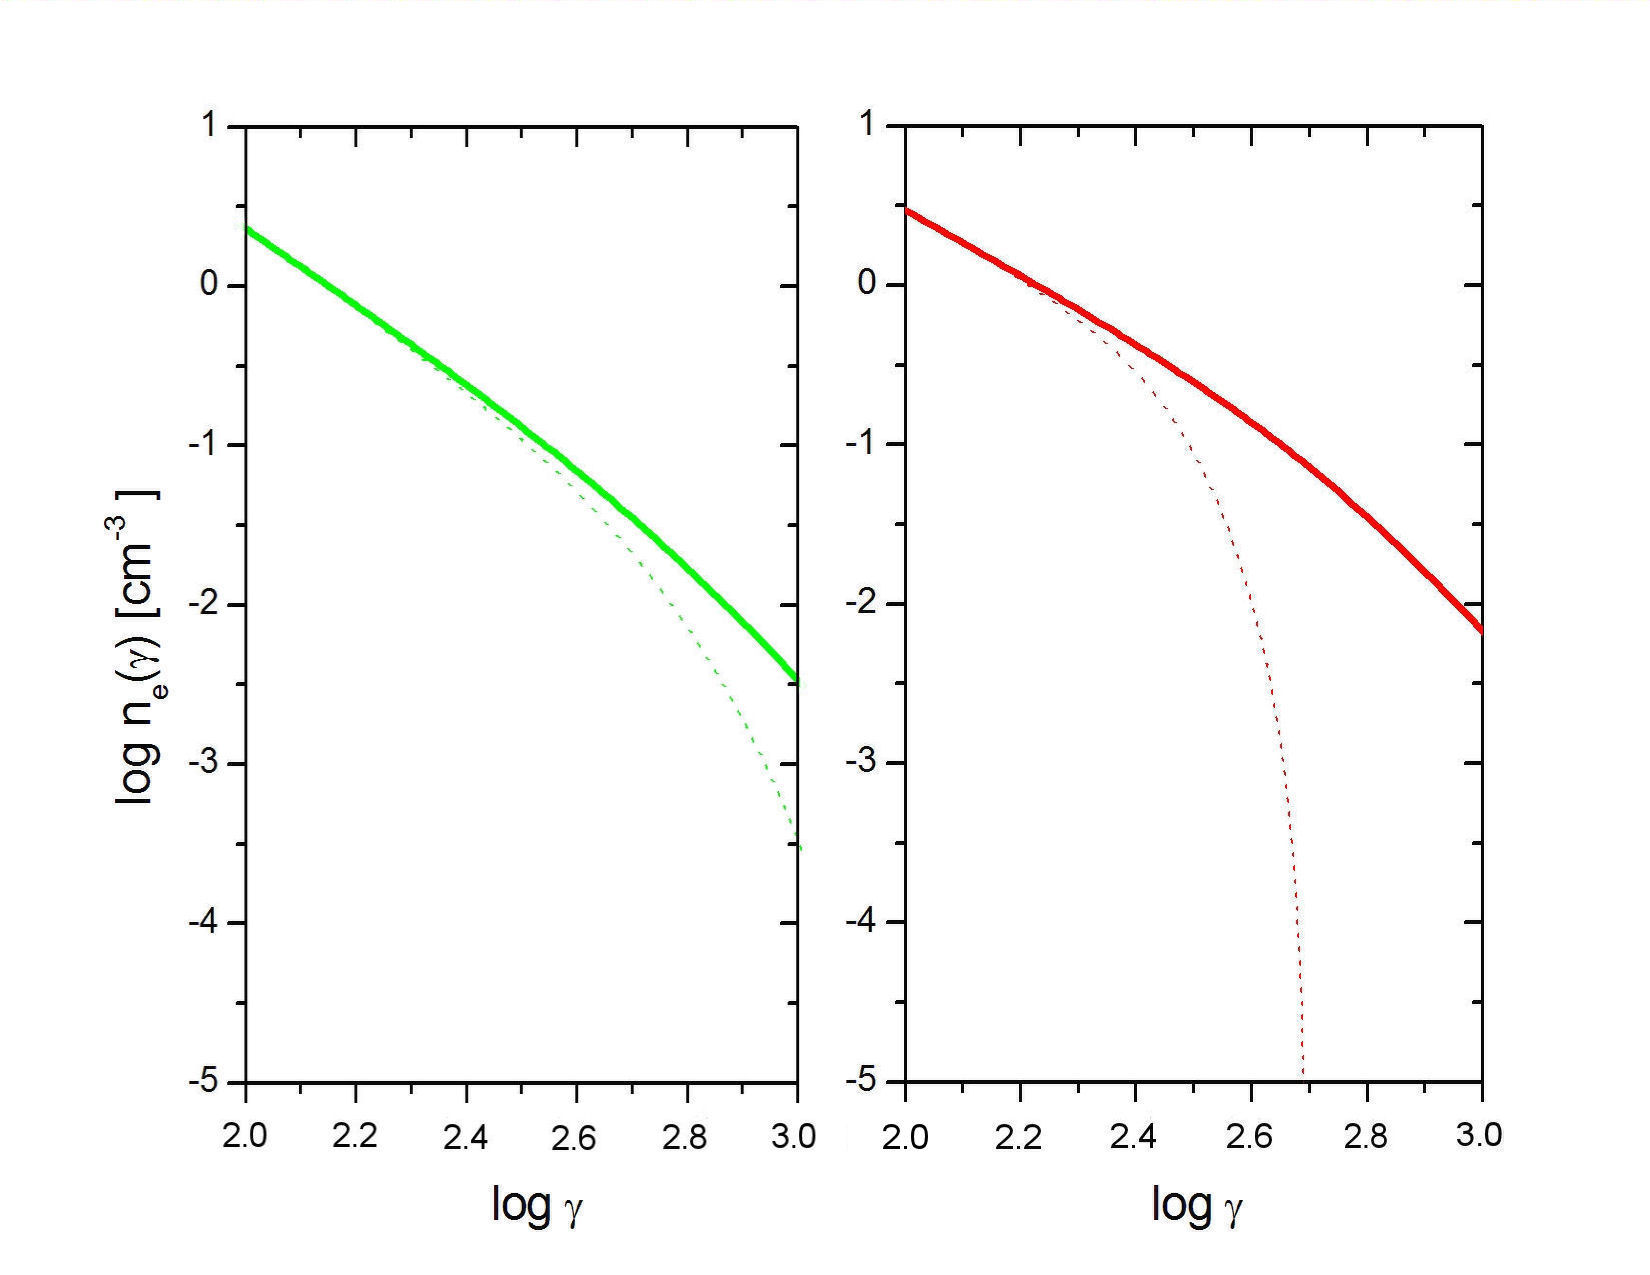
Note that the low-energy (and initial) slope indicated by the spectral fits and reported in Table 1 turns out to be flatter in the dominant compared to the subdominant plasmoids, (see also Fig. 7 in the Appendix). Higher values of and density are expected (see, e.g., Longair, 2002) for stronger shocks driven in the dominant relative to the subdominant plasmoids. The electron accelerations are easily fed by the large bulk energy in the jet and the associated plasmoids, namely, by . We add two points: (i) higher densities and magnetic fields hold behind stronger shock fronts in trans-relativistic plasmas; (ii) lower values of coupled with higher magnetic fields agree with the minimum power arguments for blazar jets down to the core as discussed by Ghisellini & Celotti, 2001. These features consistently support our model.
4 Discussion
Our model aims at a specific understanding of all multifrequency emissions of 3C 454.3 during its record-high -ray emission episode in November 2010. The model considers plasmoid production along the jet and their propagation into environments with widely different densities of soft photons, that scatter off the GeV electrons within the plasmoids. We find that it is hard to explain all observed features of the flaring 3C 454.3 within a sparsely covering BLR. Instead, mirroring by a cloud located along the jet trajectory can produce locally a strongly enhanced seed photon field yielding an intense EC flare.
We have followed the evolution of the dominant plasmoid in the train as it outflows from the inner region up to the distant mirror. Its appearance is observed in our frame after about a week from the beginning of the plateau due to the plasmoid train. The -ray peak at MJD 55520 is interpreted as mirror-enhanced EC radiation once the dominant plasmoid reaches the mirror region, approximately after 10 days in the observer frame.
Fig. 6 summarizes our model and its outputs, spelled out as follows. To start with, a train of several plasmoids is produced and flows towards and throughout the BLR. The resulting synchrotron and EC radiation inside and at the BLR shell produces the quasi-steady plateau stretch. Plasmoids that leave the BLR are replaced by the trailing ones in the train. The plateau emission therefore lasts some 15 days, with wiggles reflecting internal activity in the plasmoid train. At some point, a dominant plasmoid occurs; this yields the ”orphan” optical flare after about 1 week in the observer’s frame and the enhanced flux of emission lines as discussed at the end of Sect. 2.2. Eventually, the leading edge of the train reaches a mirror cloud located well beyond the BLR; strong radiation of the EC type is produced at this point as explained in detail in Sect. 3. Evidence of mirror emission is supported by enhancement in line-emission and by strong Compton dominance, while retaining a conservative value of for the bulk Lorentz factor. While Compton-dominated radiation continues on, synchrotron emission adds as ensuing plasmoids crash into the outer mirror cloud. The -ray radiation is still mirror-enhanced, while increased synchrotron emission is produced. When the dominant plasmoid reaches the mirror, a strong peak in both fluxes ensues. Later on, the overall radiation decreases until the plasmoid production ends, or its outflow is terminated.
Previous authors (Ghisellini & Madau, 1996; Böttcher & Dermer, 1998) discussed similar mirror processes within the BLR at distances less than ; we find this location not adequate for the events of 3C 454.3 in November 2010. In fact, in interpreting the ”orphan” optical flare a clear difference arises between models based on mirrors placed inside and beyond the BLR. If the mirror were located within the BLR, the absence of a corresponding increase of rays would be problematic. The enhanced lines emitted in approximate coincidence with the ”orphan” optical flare are indicative of a reprocessing cloud; it is unlikely for this cloud to re-emit within the BLR without overproducing rays.
On the other hand, we propose in Sect. 2 that mirror enhanced EC radiation at some distance beyond the BLR constitutes a good candidate to explain all known multifrequency and timing features of 3C 454.3; specifically it explains the time lag of 10 days between the ”orphan” optical flare and the peak in rays. We envisage the following sequence (see Fig. 6): (1) production of a plasmoid train; (2) outflow into the BLR leading to plateau emission; (3) outflow of the train beyond the BLR; (4) interaction with a mirror cloud. The appearance of the dominant plasmoid corresponds to the optical flare without -ray counterpart; the delayed, strong -ray radiation agrees with the plasmoid outflow and interaction with the mirror cloud. A virtue of our model is to require a conservative value of the jet bulk Lorentz factor , a value not stressing the jet acceleration processes (e.g., Camenzind, 1987) yet consistent with the observed rapid onset of the -ray flare in November 2010. The requirement of substantial high-energy radiation from the jet at large distances from the central BH is indeed the main feature of our model that marks it out from other investigations focused on outer emissions but with low radiative cooling (e.g., Ghisellini et al., 2012). An added bonus of our proposed disposition is to place most of the -ray emission at distances , where the opacity for - interactions is safely low (e.g., Ghisellini & Madau, 1996).
Note that our model requires a sequence of two infrequent events that is
consistent with the rare occurrence (about 1 in several years) of
-ray superflares among the whole population of
blazars monitored by AGILE and Fermi-LAT (Pittori et al., 2009, http://fermi.gsfc.nasa.gov/ssc/data/access/lat/msl_lc).
5 Conclusions
We have discussed a set of possible models for the exceptionally intense and complex flare from the blazar 3C 454.3 in November 2010. We have focussed and developed a consistent model that addresses all existing observations in different bands from radio waves to GeV energies. This is based on a train of plasmoids propagating along the jet and interacting with the BLR and with the external environment, which naturally explains both the extended plateau and the intense -ray flare. The strongly Compton-dominant nature of the latter indicates that EC from a blob crashing into a mirror is at work. Difficulties with a mirror cloud located within the BLR are overcome by our proposed alternative location beyond the canonical BLR shell.
In fact, our preferred picture for 3C 454.3 event is based on a location well beyond the BLR to produce the -ray super-flare episode. The sharp onset (a few hours) of the super-flare and its strong Compton dominance are specific features of our model. Mirroring implies a double Lorentz boost that strongly affects the radiation. On the other hand, the long duration of the -ray enhanced emission is accounted for by the large distances (of order few pc) implied in our model. So the latter is characterized by intense ”far-yet-fast” -ray radiation, and can also be applied to similar flaring episodes other sources such as the activity of PKS 1830-211 in October 2010.
Acknowledgments: This work is based on satellite data from AGILE and Fermi-LAT, and on ground-based data taken and assembled by the WEBT collaboration and stored in the WEBT archive at the Osservatorio Astrofisico di Torino - INAF (http://www.oato.inaf.it/blazars/webt/). We acknowledge constructive comments by our referee that helped us to improve our presentation. We thank P. Romano for the Swift/XRT data, C.M. Raiteri, and M. Villata for the GASP/WEBT radio/optical data. We also thank J. Leon-Tavares for providing optical line data. Investigation carried out with partial support by the ASI grant no. I/028/12/0 and I/028/12/2.
References
- Abdo et al. (2011) Abdo, A. et al. 2011, ApJL, 733, L26
- Begelman et al. (1984) Begelman, M.C., Blandford R.D., and Rees, M.J. 1984, Rev. Mod. Physics, 56, 255
- Blumenthal & Gould (1970) Blumenthal, G.R. & Gould, R.J. 1970, Rev. Mod. Phys., 42, 237
- Böttcher & Dermer (1998) Böttcher, M. & Dermer, C.D. 1998, ApJL, 501, L51
- Böttcher & Bloom (2000) Böttcher, M. & Bloom, S.D. 2000, AJ, 119, 469
- Camenzind (1987) Camenzind, M. 1987, A&A, 184, 341
- Ciprini et al. (2010) Ciprini, S. 2010, ATel n. 2943
- Dermer & Schlickeiser (1992) Dermer, C.D. & Schlickeiser, R. 1992, ApJ, 575, 667
- Dermer & Schlickeiser (1993) Dermer, C.D. & Schlickeiser, R. 1993, ApJ, 416, 458
- Dermer & Schlickeiser (1994) Dermer, C.D. & Schlickeiser, R. 1994, ApJS, 90, 94
- Dermer et al. (2009) Dermer, C.D., Finke, J.D., Krug, H., Böttcher, M. 2009, ApJ, 692,32
- Donnarumma et al. (2011) Donnarumma, I. et al. 2011, ApJL, 736, L30
- Ghisellini & Celotti (2001) Ghisellini, G. & Celotti, A. 2001, MNRAS, 327, 739
- Ghisellini et al. (1985) Ghisellini, G., Maraschi, L., Treves, A. 1985, A&A, 146, 204
- Ghisellini & Madau (1996) Ghisellini, G. & Madau, P. 1996, MNRAS, 280, 67
- Ghisellini et al. (2012) Ghisellini, G., Tavecchio, F., Foschini, L., Sbarrato, T., Ghirlanda, G., Maraschi, L. 2012, MNRAS, 425, 1371
- Ghisellini & Tavecchio (2008) Ghisellini, G. & Tavecchio, F. 2008, MNRAS, 387, 1669
- Isler et al. (2013) Isler, J.D., et al. 2013, ApJ, 779, 100
- Jones et al. (1974) Jones, T.W., O’Dell, S.F., and Stein, W.A. 1974, ApJ, 188, 353
- Jorstad et al. (2012) Jorstad, S.G. et al. 2012, astro-ph/12050520
- Jorstad et al. (2013) Jorstad, S.G. et al. 2013, ApJ, 773, 147
- Joshi & Böttcher (2011) Joshi, M. & Böttcher, M. 2011, ApJ, 727, 21
- Joshi et al. (2014) Joshi, M., Marscher, A.P. & Böttcher, M. 2014, ApJ, 785, 132
- Khangulyan et al. (2013) Khangulyan, D.V., Barkov, M.V., Bosch-Ramon, V., Aharonian, F.A., Dorodnitsyn, A.V. 2013, ApJ, 774, 113
- Leon-Tavares et al. (2013) Leon-Tavares, J. et al 2013, ApJL, 763, L36
- Longair (2002) Longair, M.S. 2002, ”High Energy Astrophysics”, Cambridge Univ. Press, Cambridge
- Marscher (1983) Marscher, A.P. 1983, ApJ, 264, 296
- Marscher (2014) Marscher, A.P. 2014, ApJ, 780, 87
- Netzer (2006) Netzer, H. 2006, Springer Lecture Notes in Physics, Volume 693, 1 (Berlin)
- Paggi et al. (2011) Paggi, A. et al. 2011, ApJ, 736, 128
- Pittori et al. (2009) Pittori, C. et al. 2009, A&A, 506, 15
- Peterson (2006) Peterson, B.M. 2006, The Broad-Line Region in Active Galactic Nuclei, Lect. Notes Phys. 693, 77 (Springer)
- Rees (1978) Rees, M.J. 1978, MNRAS, 184, 61
- Reynolds (1982) Reynolds, S.P. 1982, ApJ, 256, 38
- Sikora et al. (1994) Sikora, M., Begelman, M. C., Rees, M. J. 1994, ApJ 421, 153
- Sikora et al. (2002) Sikora M., Blazejowski, M., Moderski, R., Madejsky, G. M. 2002, ApJ, 577, 78
- Striani et al. (2010) Striani, E. et al. 2010, ATel n. 3034 & ATel n. 3043
- Vercellone et al. (2011) Vercellone, S. et al. 2011, ApJL, 736, L38
- Vercellone et al. (2010) Vercellone, S. et al. 2010, ApJ, 718, 455
- Wehrle et al. (2012) Wehrle, A.E. et al. 2012, ApJ, 758, 72
Appendix
We assume the emitting electron population to emerge from an injection/acceleration stage, provided by shocks (see Longair, 2002), with a comoving distribution of the random relativistic energies in the form of a single power-law; this is subsequently reshaped into a broken power-law
| (A1) |
with parameters tabulated in Table 1.
These electrons emit a primary synchrotron spectrum and a second contribution (SSC) produced by inverse Compton (IC) as the primary synchrotron photons scatter off the same electron population. We numerically compute the fluxes from these processes following standard relations given in detail by, e.g., Blumenthal & Gould, 1970, Eqs. 4.52 and 2.61.
For electrons in a magnetic field , the synchrotron SED peaks in the laboratory frame at
| (A2) |
where is the Planck constant and is the Doppler factor due to the bulk flow of emitters toward the observer at an angle relative to the line of sight. The SED at the synchrotron peak scales as
| (A3) |
As to the IC component, its SED contribution peaks at
| (A4) |
with a peak value scaling in the Thomson regime as
| (A5) |
if the scattering takes place with a density of target photons scaling as . The relativistic motion toward the observer amplifies the observed power by the factor , and allows it to vary on a timescale .
Fluxes emitted by EC process are computed as given in detail by e.g., Reynolds, 1982, (Eq. 12). Here target photons additional to SSC are provided by sources external to the jet. The high-energy component of the spectra is contributed by the electrons that Compton upscatter the external photons. The SED now peaks at energies
| (A6) |
and the corresponding peak value scales as
| (A7) |
Here two new ingredients enter: and i.e., the peak energy and the density at the peak of the external photons as seen by the moving plasmoid. These quantities are related to the energy density in the laboratory frame by means of the bulk Lorentz factor , in a manner that depends on the geometry of the system that causes an additional dependence on . Dermer & Schlickeiser, 1993 discuss observed SED dependencies on varying from to , for photons entering the moving plasmoid from behind or from the front, respectively. Here we assume for black body distributions at temperatures K, K and K for the accretion disk, the dusty torus and the BLR, respectively. Since the peak energy of the external photons in the observer-frame satisfies eV, the scattering occurs in the Thomson regime; in fact, with the parameters reported in Table 1 results. If the scattering happened in the Klein-Nishina regime, further steepening of high energy spectra would be observed.
By synchrotron and Compton losses the electrons cool down on a comoving timescale
| (A8) |
where is the Thomson cross section, and are the comoving energy densities before scattering of the magnetic field and of the external radiation, respectively. This sets a cooling break at the energy , beyond which the electrons cool down rapidly.
Focusing on the radiative cooling, the electron energy distribution for a single plasmoid (Eq. A1) evolves according to
| (A9) |
The results for the dominant (red) and a subdominant (green) plasmoid are shown in Fig. 7 which illustrates the detailed effects of cooling on the distributions after 1 day in the observer frame. The contributions of one dominant and of several other subdominant plasmoids at the appropriate stages of evolution are summed to produce the spectra of Figs. 4 and 5. We schematically illustrate in Fig. 6 our procedure for summation and composition of the received fluxes in four spectral bands.