ULTRASPEC: a high-speed imaging photometer on the 2.4-m Thai National Telescope
Abstract
ULTRASPEC is a high-speed imaging photometer mounted permanently at one of the Nasmyth focii of the 2.4-m Thai National Telescope (TNT) on Doi Inthanon, Thailand’s highest mountain. ULTRASPEC employs a 10241024 pixel frame-transfer, electron-multiplying CCD (EMCCD) in conjunction with re-imaging optics to image a field of 7.7’7.7’ at (windowed) frame rates of up to 200 Hz. The EMCCD has two outputs – a normal output that provides a readout noise of 2.3 e- and an avalanche output that can provide essentially zero readout noise. A six-position filter wheel enables narrow-band and broad-band imaging over the wavelength range 330–1000 nm. The instrument saw first light on the TNT in November 2013 and will be used to study rapid variability in the Universe. In this paper we describe the scientific motivation behind ULTRASPEC, present an outline of its design and report on its measured performance on the TNT.
keywords:
instrumentation: detectors – instrumentation: photometers – techniques: photometric1 Introduction
High-speed optical photometry can be defined as photometry obtained on timescales of tens of seconds and below. This is a technological definition, based on the fact that the conventional CCDs found on the vast majority of the world’s largest telescopes take tens of seconds or longer to read out. Hence if one wishes to perform high-speed optical photometry on large telescopes, it is usually necessary to build specialised instruments dedicated to the task. A list of some of the world’s high-speed optical photometers is given by Dhillon et al. (2007b).
High-speed photometry enables the study of compact objects, such as white dwarfs, neutron stars and black holes. This is because the dynamical timescales of these stellar remnants range from seconds to milliseconds, so that their rotation, pulsation, and the motion of any material in close proximity to them (e.g. in an accretion disc), tends to occur on these short timescales. Hence only by observing at high speeds can the variability of compact objects be resolved, and in this variability one finds encoded a wealth of information, such as their structure, radii, masses and emission mechanisms, e.g. Littlefair et al. (2006).
The study of white dwarfs, neutron stars and black holes, both isolated and in binary systems, is of great importance in astrophysics. For example, they allow us to test theories of fundamental physics to their limits: black holes give us the chance to study the effects of strong-field general relativity, and neutron stars and white dwarfs enable the study of exotic states of matter predicted by quantum mechanics. Black holes, neutron stars and white dwarfs also provide a fossil record of stellar evolution, and the evolution of such objects within binaries is responsible for some of the Galaxy’s most exotic and scientifically-valuable inhabitants, such as accreting black holes, millisecond pulsars and binary white dwarfs, e.g. Gandhi et al. (2010), Antoniadis et al. (2013).
The study of other classes of compact objects, with dynamical timescales of minutes rather than seconds, can also benefit from high-speed optical photometry. For example, one can use high time-resolution observations of the eclipses, transits and occultations of exoplanets, brown dwarfs and solar system objects to provide unsurpassed spatial resolution, as well as to search for small variations in their orbits due to the presence of other bodies, e.g. Zalucha et al. (2007), Ortiz et al. (2012), Marsh et al. (2014), Richichi et al. (2014). Some of these targets, e.g. the host stars of exoplanets, can also be very bright, and in these cases the short exposures (with negligible dead time between exposures) are beneficial to avoid saturation without destroying the efficiency of the observations.
2 A brief history of ULTRASPEC
In 2002, our team commissioned a high-speed, triple-beam imaging photometer known as ULTRACAM (Dhillon et al., 2007b). Motivated by a desire to understand the kinematics of compact objects, we then decided to build a spectroscopic version of ULTRACAM, which we called ULTRASPEC. Two key factors drove the design of ULTRASPEC – the first was the requirement to minimise detector readout noise, as the light in a spectrum is spread out over many more pixels than it is in an image. This led us to use a frame-transfer electron-multiplying CCD (EMCCD) – see Sect. 3.4 – as the detector in ULTRASPEC. The second was the realisation that it was unnecessary to build a new spectrograph for ULTRASPEC, as so many excellent spectrographs with external focii able to accept visiting cryostats already exist. Thus we designed ULTRASPEC as a bare (i.e. no optics) EMCCD in a cryostat, to be bolted onto an existing spectrograph, and re-using as much of the ULTRACAM data acquisition hardware and software as possible, as described by Ives et al. (2008) and Dhillon et al. (2008).
ULTRASPEC was tested for the first time on-sky during a 4-night commissioning run in December 2006 on the EFOSC2 spectrograph mounted on the ESO 3.6-m telescope at La Silla. This was the first time an EMCCD had been used to perform astronomical spectroscopy on a large-aperture telescope (Dhillon et al., 2007a), a topic which is discussed in detail by Tulloch & Dhillon (2011). The first 17-night science run with ULTRASPEC took place in January 2008 on the ESO 3.6-m, and a second 22-night science run with EFOSC2 mounted on the 3.5-m New Technology Telescope (NTT) at La Silla was successfully completed in June 2009.
Visiting instruments such as ULTRACAM and ULTRASPEC have the major disadvantage that they are subject to the vagaries of the time-allocation process and are mounted on a telescope for only a few weeks each year, making it difficult to respond rapidly to new astronomical discoveries and to plan long-term monitoring or survey observations. So in 2010 our priorities switched from performing high-speed spectroscopy with ULTRASPEC to finding a permanent home for the instrument and converting it into a high-speed photometer. In 2011, we signed a Memorandum of Understanding with the National Astronomical Research Institute of Thailand (NARIT), providing the ULTRASPEC team with 30 nights per year on the new 2.4-m Thai National Telescope (TNT) in return for access to ULTRASPEC for the Thai astronomical community for the rest of the year. In the course of the move to the TNT, ULTRASPEC’s data acquisition hardware and software were upgraded to bring them into line with the latest version of the ULTRACAM data acquisition system. We also constructed an opto-mechanical chassis on which to mount the original ULTRASPEC cryostat and a new set of re-imaging optics. ULTRASPEC saw first light on the TNT on 2013 November 5.
No detailed description of ULTRASPEC, in either its spectroscopic or photometric incarnations, has appeared in the refereed astronomical literature. In this paper, therefore, we describe the design and performance of ULTRASPEC, primarily in its new role as a high-speed optical photometer mounted on the TNT.
3 Design
We begin this section with a brief summary of the TNT, followed by a detailed description of the design of ULTRASPEC in its current form as a high-speed imaging photometer on the TNT.
3.1 The Thai National Telescope
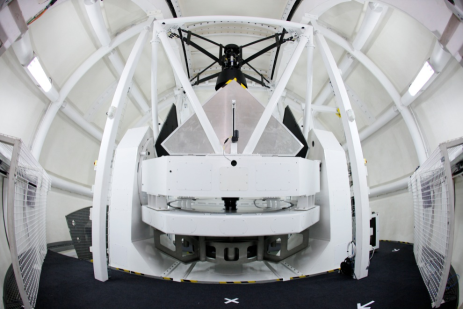
The Thai National Telescope is a 2.4-m Ritchey-Chrétien with an /10 focal ratio, providing a plate scale of 8.6”/mm at the two Nasmyth focii (Fig. 1). The telescope is on an alt-az mount which can slew at up to 4∘/s, making it ideal for the rapid acquisition of transient sources triggered by other facilities. The pointing accuracy is better than 3” over most of the sky and the telescope can track to better than 0.5” over 10 min without autoguiding. The TNT was designed and built by EOS Technologies, USA/Australia, and saw first light in early 2013. The telescope is housed in a hemispherical fibre-glass dome, designed and manufactured in Thailand.
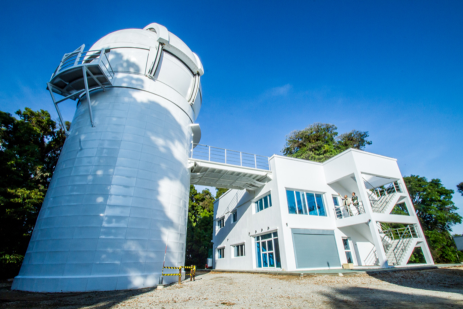
The TNT (latitude 18.573725∘N, longitude 98.482194∘E, altitude 2457 m) is the main facility of the Thai National Observatory (TNO), located close to the summit of the highest mountain in Thailand, Doi Inthanon. The site is approximately 100 km by road from the nearest city – Chiang Mai – and lies in the middle of a national park, thereby ensuring dark skies: and magnitudes per square arcsecond on a moonless night, comparable with the best observing sites in the world. Doi Inthanon is tree-covered all the way to the summit, and the trees are protected from being felled. Hence the telescope had to be built on a tower to provide a clear view to the horizon (Fig. 1). The median seeing is approximately 0.9” and is remarkably stable on most nights, rarely exceeding 2”. The climate at Doi Inthanon is split into wet and dry seasons. The telescope is only operated during the dry season, which runs from the beginning of November to the end of April. The best months during the 2013/14 observing season were December–March, with approximately 75% usable nights during this period, similar to that observed at other major observatories, e.g. La Palma (Della Valle et al., 2010).
At present, only one of the two Nasmyth focii is in operation. This focus is equipped with a rotator, on which is mounted a cube with four ports for instruments. Light from the tertiary (M3) mirror is directed to a quarternary (M4) mirror mounted inside the cube, which can then direct the beam to whichever of the four ports the astronomer wants to use. At present, the four ports currently harbour: ULTRASPEC, an autoguider, a fibre-fed spectrograph, and a conventional 4 k4 k CCD camera.
3.2 Optics
Critically sampling the median seeing at the TNT requires a platescale of 0.45”/pixel, which would result in a field of view of 7.7’7.7’ on ULTRASPEC’s 10241024-pixel detector. Using the star counts listed by Simons (1995), such a field of view would result in an 80% probability of finding a comparison star of magnitude at a galactic latitude of 30∘ (the all-sky average). This is brighter than the vast majority of our target stars, thereby ensuring reliable differential photometry. Hence we designed a 4 focal reducer for ULTRASPEC in order to provide a platescale of 0.45”/pixel, which can work across the desired wavelength range of 330–1000 nm covered by the SDSS filters (see below).
| Surface | ROC | Thickness | Glass |
|---|---|---|---|
| TFP | 50.046 | ||
| Lens 1 | 144.930 | 17.970 | N-FK51A2 |
| 931.800 | 220.924 | ||
| Lens 2 | 77.985 | 8.000 | N-BK72 |
| 90.995 | 43.511 | ||
| Lens 3 | –47.345 | 3.730 | N-PSK53A2 |
| –81.505 | 2.351 | ||
| Lens 4 | 75.800 | 12.740 | N-BK72 |
| –134.940 | 3.500 | N-LAK211 | |
| 412.675 | 38.684 | ||
| Filter | Infinity | 5.000 | SILICA |
| Infinity | 25.000 | ||
| Lens 5 | 223.375 | 3.500 | N-SK141 |
| 44.605 | 12.570 | CAF22 | |
| –40.600 | 2.194 | ||
| Lens 6 | –39.460 | 4.460 | N-LAK211 |
| –90.995 | 1.911 | ||
| Lens 7 | 50.065 | 18.000 | CAF22 |
| –55.690 | 2.315 | ||
| Lens 8 | –50.065 | 18.000 | N-BK72 |
| –96.860 | 33.544 | ||
| Lens 9 | 30.255 | 17.450 | N-BK72 |
| –475.220 | 3.358 | ||
| Lens 10 | –62.415 | 4.510 | N-LAK211 |
| 23.070 | 16.244 | ||
| CCD | Infinity |
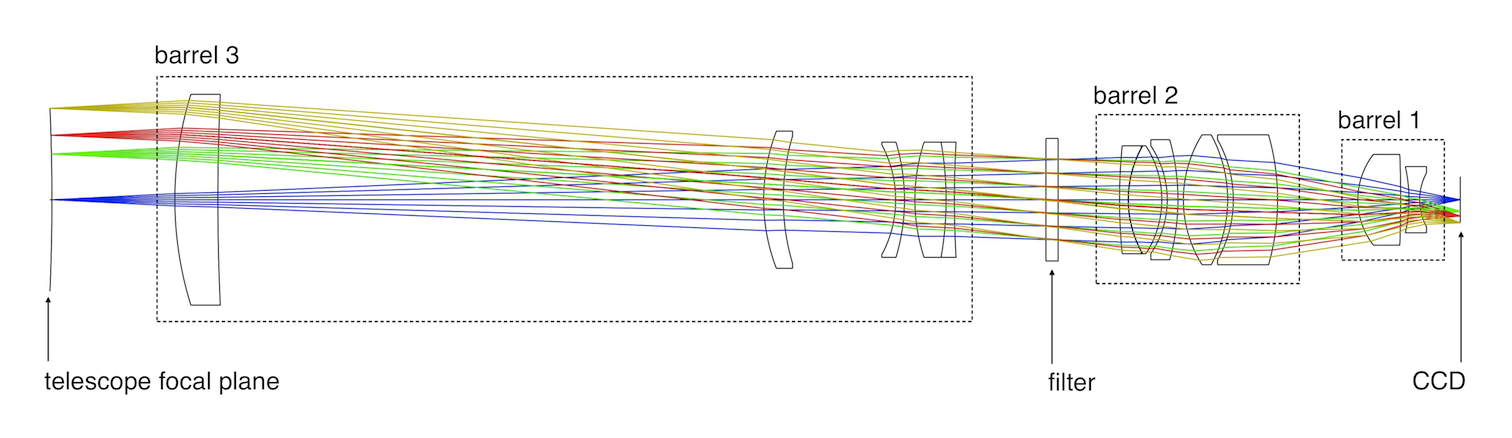
The final ULTRASPEC optical design is shown in Fig. 2 and Tab. 1, and is composed of 12 lenses plus the plane-parallel filter. The first 5 elements form a collimator that images the telescope exit pupil onto the filters in the wheel. These lenses are packaged into barrel 3. The next 7 lenses form a camera section, with sufficient space between camera and collimator to accommodate the filter wheel assembly. These lenses are packaged into lens barrels 1 and 2. Since the pupil image is remote from both collimator and camera, the collimator needs to act rather like an eyepiece, and a modified Petzval type lens with field flattener was chosen as the basis of the camera design. The main difficulty of the design was presented by the very broad spectral range and the need for co-registration of image centroids across all bands (correction of lateral colour), which is essential if we want to use small windows and change filter without having to adjust the telescope position and/or window parameters each time. In particular, the availability of glasses with reasonable transmission over the scientifically-important band restricted the usable glass types. The seeing conditions at the telescope site and the pixel size determined the target modulation transfer function and spot size for optimisation, with the goal of providing seeing-limited stellar images in median seeing conditions (0.9”) at the TNT. A simple ghost analysis finds the best-focused ghost to have an RMS spot area of 47 times the image spot area, with a brightness 0.0002% of the stellar image and a displacement that varies from zero on axis to 145 m ( pixels) at the edge of the field.
There are two doublets in the optical design, lenses 4 and 5 in Tab. 1. N-BK7 and N-LAK21 are both non-crystalline glasses with similar coefficients of thermal expansion. Hence we were able to use a relatively rigid cement with excellent transmission properties – Norland Optical Adhesive NOA88. N-SK14 and CaF2 have different thermal expansion properties, resulting in a radial expansion of 8.3 m when the temperature fluctuates by 30 K around room temperature, giving significant shear stress on any adhesive used. This is particularly problematic for the CaF2 element which is crystalline and less resilient. Hence we chose to bond these two elements using a 120 m layer of flexible silicon-based adhesive known as RTV 615. The lenses were manufactured by IC Optical Systems, UK, and coated by CVI Melles Griot, Isle of Man. The lens barrels were manufactured, and the lenses mounted and aligned within them, by IC Optical Systems.
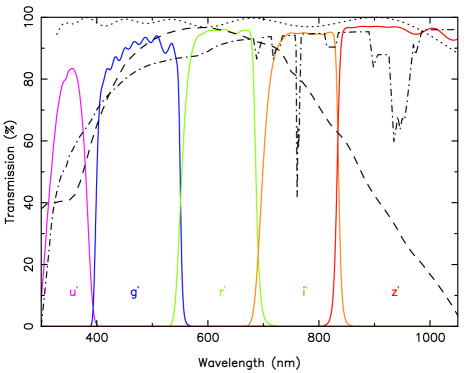
The Sloan Digital Sky Survey (SDSS) photometric system (Fukugita et al., 1996) was adopted as the primary filter set for ULTRASPEC – the pass-bands are shown in Fig. 3. We chose this filter set primarily because we wanted to ensure that we could combine our ULTRASPEC observations with those made with our other high-speed imaging photometer, ULTRACAM (Dhillon et al., 2007b). As well as SDSS filters, which are identical to those used in ULTRACAM, ULTRASPEC also has an extensive set of broad-band and narrow-band filters – see Tab. 2. Only 6 filters can be mounted at any one time in the wheel. All ULTRASPEC filters are 5050 mm2 and approximately 5 mm thick, but have been designed to have identical optical thicknesses so that their differing refractive indices are compensated by slightly different physical thicknesses, making the filters interchangeable without having to refocus the telescope. The filters have also been designed taking the ULTRASPEC optical design into account to ensure that the required central wavelength and FHWM are achieved. All of the filters used in ULTRASPEC were designed and manufactured by Asahi Spectra Company, Japan.
| Filter | (nm) | (nm) |
|---|---|---|
| 355.7 | 59.9 | |
| 482.5 | 137.9 | |
| 626.1 | 138.2 | |
| 767.2 | 153.5 | |
| 909.7 | 137.0 | |
| Clear | – | – |
| Schott KG5 | 507.5 | 360.5 |
| 838.5 | 290.5 | |
| CIII/NIII+HeII | 465.7 | 11.2 |
| Blue continuum | 514.9 | 15.8 |
| NaI | 591.1 | 31.2 |
| Red continuum | 601.0 | 11.8 |
| H wide | 655.4 | 9.4 |
| H narrow | 656.4 | 5.4 |
3.3 Mechanics
The design of the mechanical structure of ULTRASPEC on the TNT was driven by the requirement to fit within the space envelope and mass limit determined by the properties of the Nasmyth rotator and cube. Specifically, any instrument mounting on the cube has to be less than 1 m in length and weigh no more than 100 kg. This proved quite challenging, given the dimensions and masses of the optics barrels and the cryostat, so we decided upon an open-strut design, utilising aluminium and carbon fibre wherever possible for their low mass and high rigidity. The other requirements for our opto-mechanical chassis were: i) to provide a platform on which to mount the optics, cryostat and CCD controller; ii) to allow easy access to the optics and cryostat for filter changes and maintenance; iii) to exhibit low thermal expansion to minimise focus changes with temperature; iv) to exhibit low flexure (of order 1 pixel, i.e. 13 m) at any orientation, so stars do not drift out of the small windows defined on the CCD; v) to be electrically isolated from the telescope in order to reduce pickup noise via ground loops.
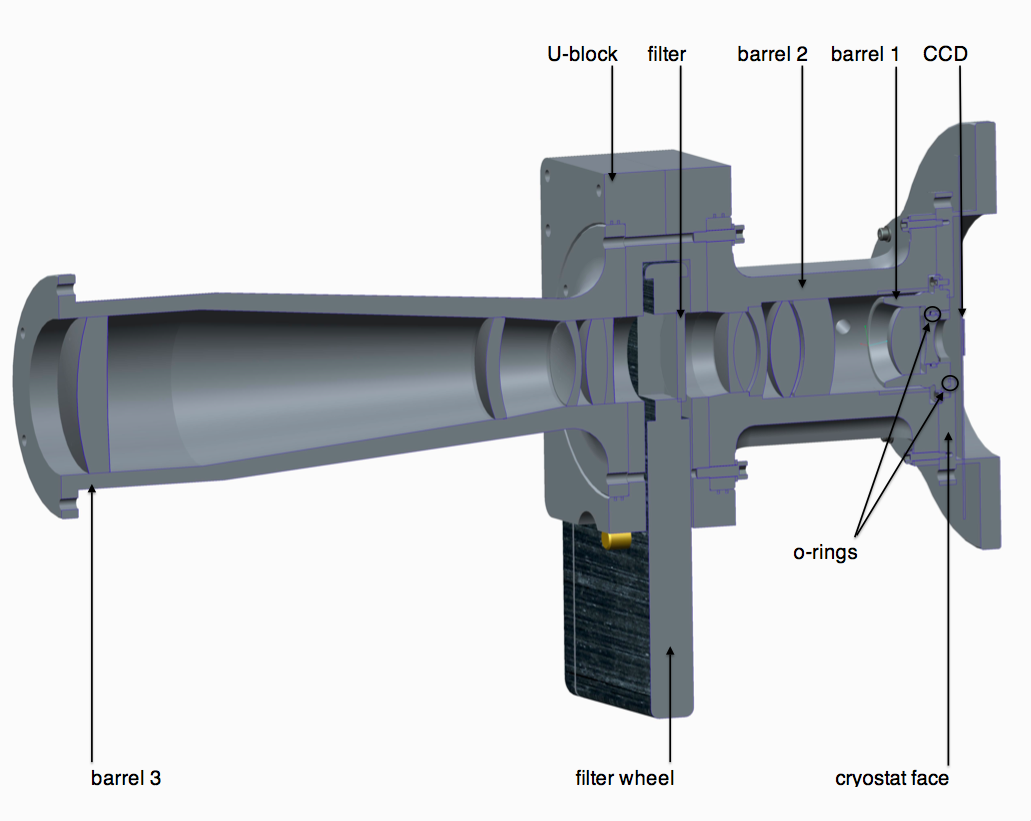
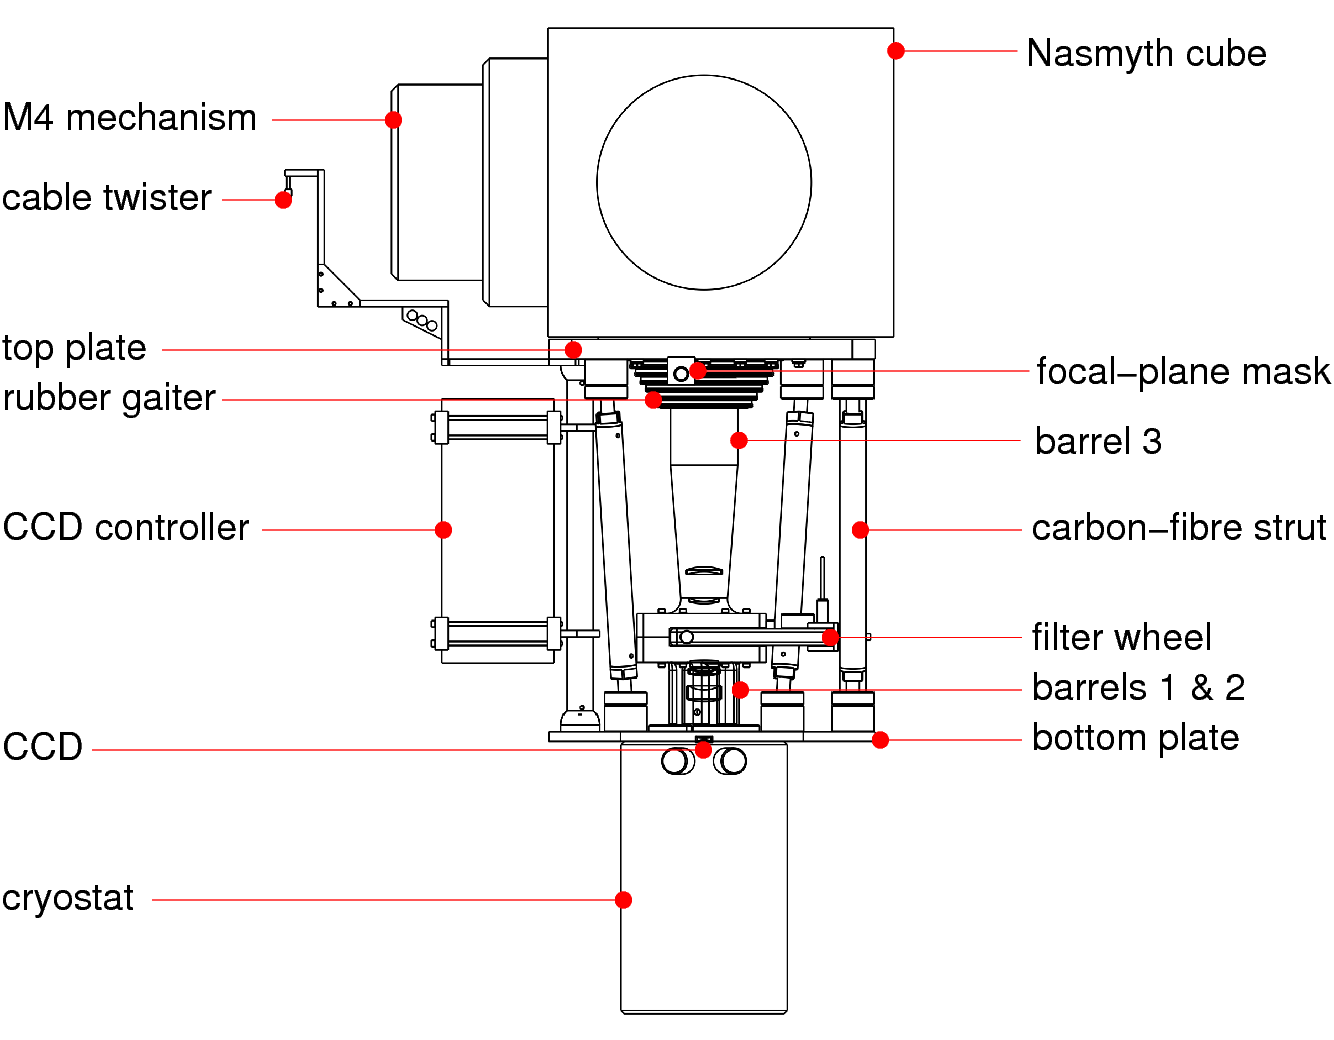
The mechanical structure of ULTRASPEC, which meets all of the requirements described above, is shown in Fig. 4. Two aluminium plates are held parallel with respect to each other via a set of 10 carbon-fibre struts. The top plate attaches to the Nasmyth cube and the bottom plate has the cryostat attached to it. To ensure that the three optics barrels do not take the weight of the instrument, they are mounted on the front face of the cryostat (see also Fig. 2) and do not touch any other part of the instrument – a rubber gaiter between the optics and top plate provides a light and dust-proof seal. This way, any flexure in the mechanical structure does not cause corresponding flexure in the optics barrels, minimising any degradation in image quality. In order to minimise the mass of the optics train, and hence minimise flexure within it, the filter wheel is mounted on the carbon-fibre struts. The filter wheel sits within the ‘U-block’ that mechanically couples lens barrels 2 and 3 (Fig. 2), but does not touch it. The CCD controller, which must reside as close as possible to the cryostat in order to minimise cable lengths and hence pickup noise, is also mounted on the carbon-fibre struts.
In order to maximise throughput, we decided to use an active cryostat window, i.e. instead of using a plane-parallel window, the right-most lens shown in Fig. 2 acted as the cryostat window. The difficulty with this design is that the lens then has to form a vacuum seal, and it must do this in such a way that its position with respect to the other lenses and the CCD does not change as the pressure in the cryostat changes, e.g. due to the changing compression of an o-ring. We met this requirement by polishing the rim of the lens, and then placing an o-ring between the rim of the lens and the inner wall of the aluminium lens barrel, as shown in Fig. 2. A second o-ring was then used to seal the gap between the lens barrel itself and the front face of the cryostat, with suitable slots machined in the barrel to eliminate trapped volumes, which would have compromised the vacuum. Note that the amount of compression of this second o-ring was fixed to a known value by using a suitably machined slot for the o-ring. The position of the CCD within the cryostat was measured using a travelling microscope and adjusted using shims so that it is flat and at the correct depth (when cold) with respect to the optics, to an accuracy of better than 0.1 mm.
For ease of cryostat maintenance, we kept lens barrel 1 small, containing only the two lenses closest to the CCD. Lens barrel 1 fits inside lens barrel 2, which is much more bulky as it is designed to take the weight of the U-block and lens barrel 3. To prevent any condensation on the outer lens of barrel 1 in humid conditions, we blow dry nitrogen gas into the cavity between lens barrels 1 and 2.
A layer of G10/40 isolation material is placed between the cube and the top plate of ULTRASPEC to provide electrical isolation from the telescope. The top plate also has a motorised focal-plane mask mounted on it. This is an aluminium blade that can be moved into the focal plane to prevent light from falling on regions of the CCD chip outside the user-defined windows typically used for observing. Without this mask, light from bright stars falling on the active area of the chip above the CCD windows would cause vertical streaks in the windows – see Fig. 1 of Dhillon et al. (2005) for an example. The mask also prevents photons from the sky from contaminating the background in drift-mode windows (see Sect. 3.8). The mechanical structure incorporates a cable twister, composed of an aluminium arm along which all of the ULTRASPEC cables are routed to a point lying on the rotation axis of the instrument. The cables are clamped at this point, and then run horizontally for approximately 1 m to another attachment point on the dome, which is slaved to the telescope, where they are also clamped. This freely-suspended 1 m cable bundle is then able to accommodate any twisting imposed by the Nasmyth rotator.
3.4 Detector
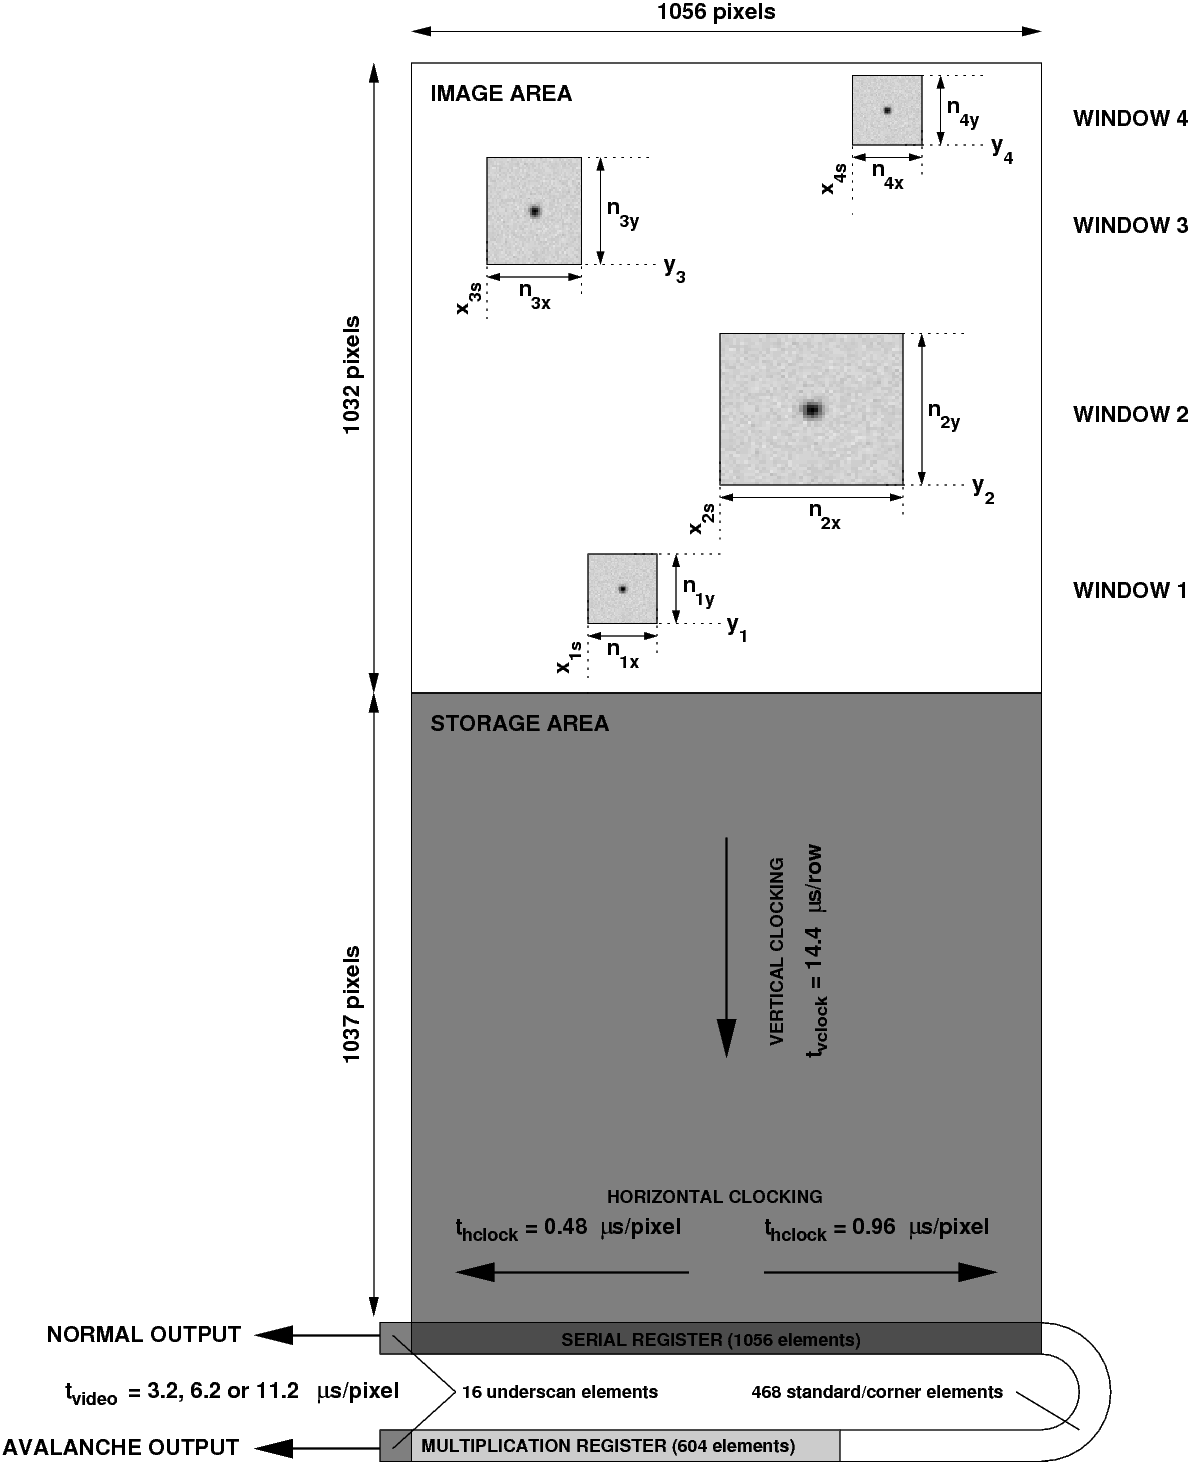
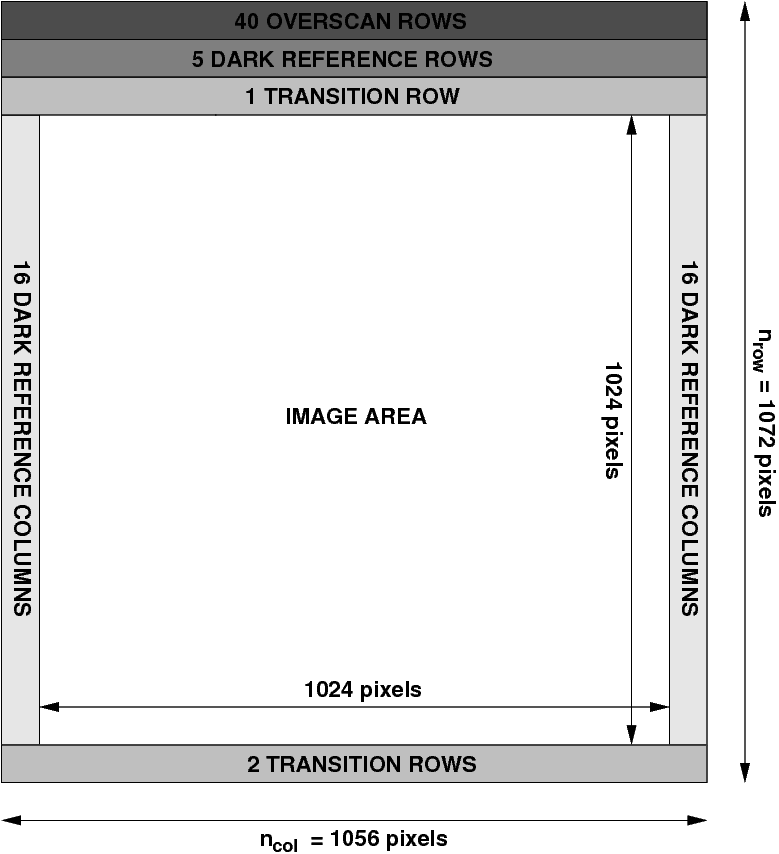
ULTRASPEC uses an e2v CCD 201-20 as its detector. This is a frame-transfer EMCCD with an image area of 10241024 pixels, each of size 13 m – see Fig. 5. The chip is thinned, back-illuminated and coated with e2v’s standard midband anti-reflection coating, providing a maximum quantum efficiency (QE) of approximately 96% around 600 nm – see Fig. 3. The device used in ULTRASPEC is a grade 1 device, i.e. it is of the highest cosmetic quality available. The CCD 201-20 is a two-phase device, thereby minimising the number of vertical clocks required and thus maximising the frame rate. The full well capacity of each pixel is approximately 80 000 e-, and we operate it with a system gain of e-/ADU to match the 16-bit analogue-to-digital (ADC) converter in the CCD controller (see Sect. 3.5). The CCD has been measured to be linear to within 1% up to the saturation level of the ADC.
Although it is possible to run the CCD 201-20 in inverted mode to suppress dark current at higher operating temperatures, this has been shown to increase the rate of clock-induced charge (CIC; see Tulloch & Dhillon 2011). As discussed by these authors, CIC becomes a significant source of noise when operating EMCCDs in electron-multiplying mode (see below), and so we operate the ULTRASPEC EMCCD in non-inverted mode around 160 K. This results in negligible dark current of 10 e-/pixel/hr and a clock-induced charge rate of approximately 0.02 e-/pixel/frame. To reduce conductive and convective heating, and to prevent condensation on the CCD, the cryostat is evacuated to a pressure of approximately mbar, which it is able to maintain for a period of at least 6 months without further pumping. The cryostat is cooled with liquid nitrogen, and the temperature of the CCD is regulated with a Lakeshore 331 temperature controller. The volume of the cryostat is 2.5 litres, giving a hold time of approximately 20 hours.
Fig. 5 shows that the CCD 201-20 has two outputs, which can be easily switched in software. Sending the photo-electrons to the normal output allows the CCD to operate in an identical manner to a conventional CCD, with a readout noise of 2.3 e- at a pixel rate of 89 kHz. This is the preferred option when the signal-to-noise ratio (SNR) of an observation is limited by shot noise from the object or sky. Sending the electrons to the avalanche output, on the other hand, results in on-chip amplification of the electrons in the multiplication register by a factor of , via a process known as impact ionisation. The resulting readout noise is reduced by a factor , rendering it negligible. This is the preferred option when the SNR of an observation is readout-noise limited, although it should be noted that the optimum choice of output is not quite as straight-forward as this due to the stochastic nature of the electron multiplication process, which effectively reduces the QE by a factor of 2 when not photon counting. We discuss the relative merits of the normal and avalanche outputs further in Sect. 4.3 and refer the reader to Tulloch & Dhillon (2011) and references therein for a more in-depth discussion of EMCCDs.
The various clocking and pixel rates used in ULTRASPEC are indicated in Fig. 5. The vertical clocking rate is 14.4 s/row and the storage area contains 1037 rows, resulting in a frame-transfer time of 14.9 ms. This is the dead time between exposures, unless drift mode is being used (see Sect. 3.8). Three readout speeds are currently available with ULTRASPEC: slow (11.2 s/pixel), medium (6.2 s/pixel) and fast (3.2 s/pixel), giving full-frame cycle times of 12.8, 7.2 and 3.8 s and readout noise of 2.3, 2.7 and 4.4 e-, respectively, from the normal output.
3.5 Data acquisition system
The key requirement for the data acquisition system for a high-speed imaging photometer is that it must be detector limited, i.e. the throughput of data from the output of the CCD to the hard disk on which it is eventually archived is always greater than the rate at which the data comes off the CCD. The ULTRASPEC data acquisition system meets this requirement, and hence is capable of running continuously all night without having to pause for archiving of data. It is very similar to the data acquisition system of ULTRACAM, differing primarily in the requirement to operate a single EMCCD as opposed to three conventional frame-transfer CCDs. In this section we provide a brief overview of the ULTRASPEC data acquisition system – a much more detailed description can be found in Beard et al. (2002), Ives et al. (2008) and McLay et al. (2010).
3.5.1 Hardware
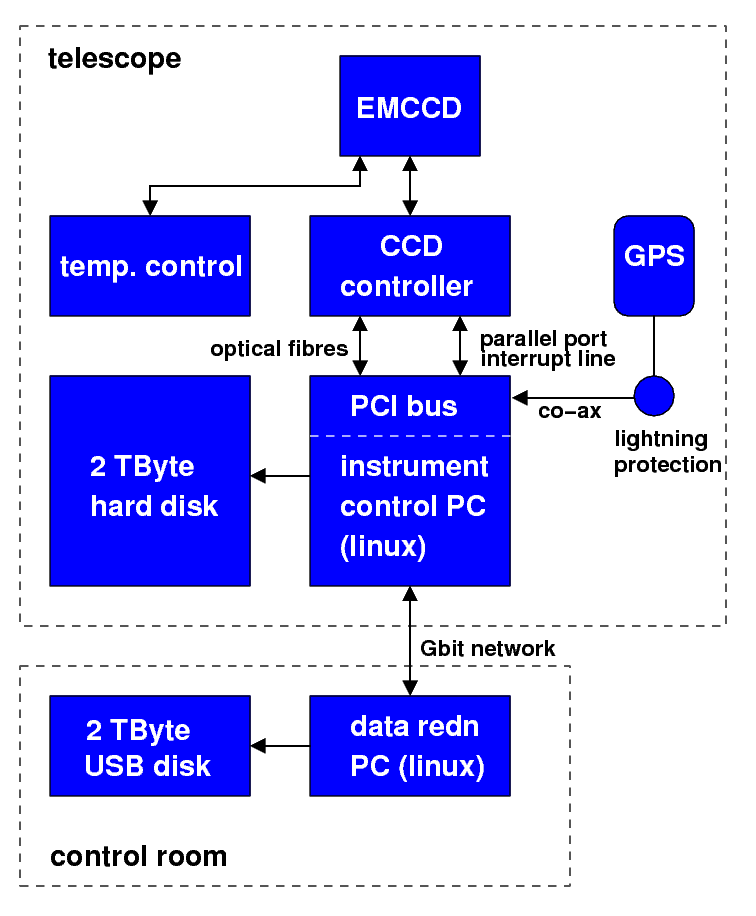
Fig. 6 shows the data acquisition hardware used in ULTRASPEC. Data from the EMCCD is read out by an Astronomical Research Cameras (ARC) Generation III CCD controller, also known as a San Diego State University (SDSU) controller (Leach & Low, 2000). The SDSU controller is hosted by a rack-mounted, quad-core PC running Linux patched with RealTime Application Interface (RTAI) extensions. RTAI is used to provide strict control over one of the processor cores, so as to obtain accurate timestamps from the Global Positioning System (GPS) antenna connected to the PC (see Sect. 3.6 for details). Note that the GPS antenna is located inside the TNT dome, as the fibre-glass skin is transparent to GPS frequencies.
The instrument control PC communicates with the SDSU controller via a Peripheral Component Interconnect (PCI) card and two 250 MHz optical fibres. As well as communicating through the fibres, the SDSU controller has the ability to interrupt the PC using its parallel port interrupt line, which is required to perform accurate timestamping (see Sect. 3.6). Data from the CCD is passed from the SDSU PCI card to the PC memory by Direct Memory Access (DMA), from where the data is written to a high-capacity hard disk. All of the work in reading out the CCD is performed by the SDSU controller; the PCI card merely forwards commands and data between the instrument control PC and the SDSU controller.
To enable electron-multiplication operation, we designed a high-voltage clock board for the SDSU controller. This provides the 40 V clock swings required for impact ionisation to occur in the multiplication register. The voltage output by the board is very stable and user-adjustable in 9 steps, providing electron-multiplication factors of up to (see Ives et al. (2008) for details). In practice, unless we are worried about saturating the multiplication register (see Sect. 4.3), we only use the highest electron-multiplication setting as this gives the lowest effective readout noise.
3.5.2 Software
The SDSU controller and PCI card both have on-board digital signal processors (DSPs) which can be programmed by downloading assembler code from the instrument control PC. An ULTRASPEC user wishing to take a sequence of windowed images, for example, would load the relevant DSP application onto the SDSU controller (to control the CCD) and PCI card (to handle the data). The user can also modify certain parameters, such as the exposure time, readout speed, window sizes/positions and binning factors, by writing the new values directly to the DSP’s memory.
All communication within the ULTRASPEC data acquisition system, including the loading of DSP applications on the SDSU controller, is via Extensible Markup Language (XML) documents transmitted using the Hyper Text Transfer Protocol (HTTP) protocol. This is an international communications standard, making the ULTRASPEC data acquisition system highly portable and enabling users to operate the instrument using any interface able to send XML documents via HTTP, e.g. web browser, Python script, Java graphical user interface (GUI). In the latest version of the ULTRASPEC data acquisition system, a Python GUI runs on the Linux data reduction PC in the control room. This allows the astronomer to set the various CCD parameters, and the GUI then automatically writes and sends an XML document to execute the observations.
3.6 Timestamping
ULTRASPEC can image at rates of up to 200 Hz, hence it is critical that each frame is timestamped to an accuracy of a millisecond or better. Whenever a new exposure is started, as denoted by a frame-transfer operation, the SDSU controller sends an interrupt, in the form of a voltage step sent down a co-axial cable, to the instrument control PC. Owing to the use of RTAI, the PC then instantaneously (i.e. within s) reads the current time from a GPS-synchronised clock on board a Meinberg GPS170PEX PCI Express card and writes the current time to a First-In First-Out (FIFO) buffer. The data handling software then reads the timestamp from the FIFO and writes it to the header of the next buffer of raw data written to the PC memory. In this way, the timestamps and raw data always remain synchronised.
Theoretically, the absolute accuracy of the ULTRASPEC timestamping should be of order tens of microseconds. In order to measure this, we observed with ULTRASPEC an LED triggered by the pulse-per-second (PPS) output of the Meinberg GPS card. The PPS output is accurate to better than 250 ns and the rise time of the LED is of a similar order, hence these are both negligible sources of error. We measured an LED turn-on time of s in both drift mode and one-window mode, verifying that the absolute timestamping accuracy of ULTRASPEC is better than 1 ms. This test is obviously insensitive to timestamping errors equal to an integer number of seconds, but it is very difficult to imagine how such an error could arise in the ULTRASPEC data acquisition system, and is sufficiently large that we would have spotted it via our white-dwarf eclipse monitoring, e.g. Marsh et al. (2014).
3.7 Pipeline data reduction system
ULTRASPEC can generate up to 0.6 MB of data per second. In the course
of a typical night, therefore, it is possible to accumulate up to 25
GB of data, and up to 0.25 TB of data in the course of a typical
observing run. To handle these data rates, ULTRASPEC uses the same
dedicated pipeline reduction system used by
ULTRACAM111Available for download at
http://deneb.astro.warwick.ac.uk/
phsaap/software/ultracam/html/index.html., written in C++, which
runs on a Linux PC or Mac located in the telescope control room and
connected to the instrument control PC via a dedicated Gbit local area
network (see Fig. 6).
As with ULTRACAM, ULTRASPEC data are stored in two files, one an XML file containing a description of the data format, and the other a single, large unformatted binary file containing all the raw data and timestamps from a particular run on an object. This latter file may contain thousands of individual data frames, each with its own timestamp. The data reduction pipeline grabs these frames from the hard disk by sending HTTP requests to a file server running on the instrument control PC.
The data reduction pipeline has been designed to serve two apparently conflicting purposes. Whilst observing, it acts as a quick-look data reduction facility, with the ability to display images and generate light curves in real time, even when running at the highest data rates or frame rates. After observing, the pipeline acts as a fully-featured photometry reduction package, including optimal extraction (Naylor, 1998). To enable quick-look reduction whilst observing, the pipeline keeps many of its parameters hidden to the user and allows the few remaining parameters to be quickly skipped over to generate images and light curves in as short a time as possible. Conversely, when carefully reducing the data after a run, every single parameter can be tweaked in order to maximise the SNR of the final data.
3.8 Readout modes
ULTRASPEC can be read out in a number of different modes, as illustrated in Fig. 5: full-frame mode, one-window, two-windows, three-windows and four-windows, with each mode available from both the normal and avalanche outputs. By adjusting the position of the telescope, the angle of the Nasmyth rotator, and the positions/sizes of the CCD windows, it is possible to select multiple comparison stars for differential photometry. The only restriction on the window positions and sizes is that they must not overlap in the vertical direction. On-chip binning factors ranging from 1 to 8 pixels are also available.
Standard frame-transfer operation proceeds as follows. Once an exposure is complete, the entire image area is shifted into the storage area. This frame-transfer process is rapid, taking only 14.9 ms. As soon as the image area has been shifted in this way, the next exposure begins. Whilst exposing, the previous image in the storage area is shifted row-by-row onto the serial register, dumping any unwanted rows between windows, and then horizontally clocked to one of the two outputs where it is digitised222For the purposes of this paper, the word digitisation shall refer to both the process of determining the charge content of a pixel via correlated double sampling and the subsequent digitisation of the charge using an analogue-to-digital converter., dumping any unwanted pixels lying outside the defined windows. In other words, the previous frame is being read out whilst the next frame is exposing, thereby reducing the dead time between exposures to the time it takes to shift the image into the storage area, i.e. 14.9 ms.
It is important to note that ULTRASPEC has no shutter – the fast shifting of data from the image area to the storage area acts like an electronic shutter, and is far faster than conventional mechanical shutters. This does cause some problems, however, such as vertical trails of star-light from bright stars, but these can be overcome in some situations by the use of a focal-plane mask (see Sect. 3.3).
Setting an exposure time with ULTRASPEC is a more difficult procedure than with a conventional non-frame-transfer CCD. This is because ULTRASPEC attempts to frame as fast as it possibly can, i.e. it will shift the image area into the storage area as soon as there is room in the storage area to do so. Hence, the fastest exposure time is given by the fastest time it takes to clear sufficient room in the storage area, which in turn depends on the number, location, size and binning factors of the windows in the image area, as well as the digitisation speed (slow/medium/fast), all of which are variables in the ULTRASPEC data acquisition system. To obtain an arbitrarily long exposure time with ULTRASPEC, therefore, an exposure delay is added prior to the frame transfer to allow photons to accumulate in the image area for the required amount of time. Conversely, to obtain an arbitrarily short exposure time with ULTRASPEC, it is necessary to set the exposure delay to zero and adjust the window, binning and digitisation parameters so that the system can frame at the required rate. As it takes 14.9 ms to vertically clock the entire image area into the storage area, this provides a hard limit to the maximum frame rate of 68 Hz, which results in essentially zero exposure time on source. If we instead set the maximum frame rate to the value which results in a duty cycle (given by the exposure time divided by the sum of the exposure and dead times) of 75%, the maximum frame rate is approximately 20 Hz.
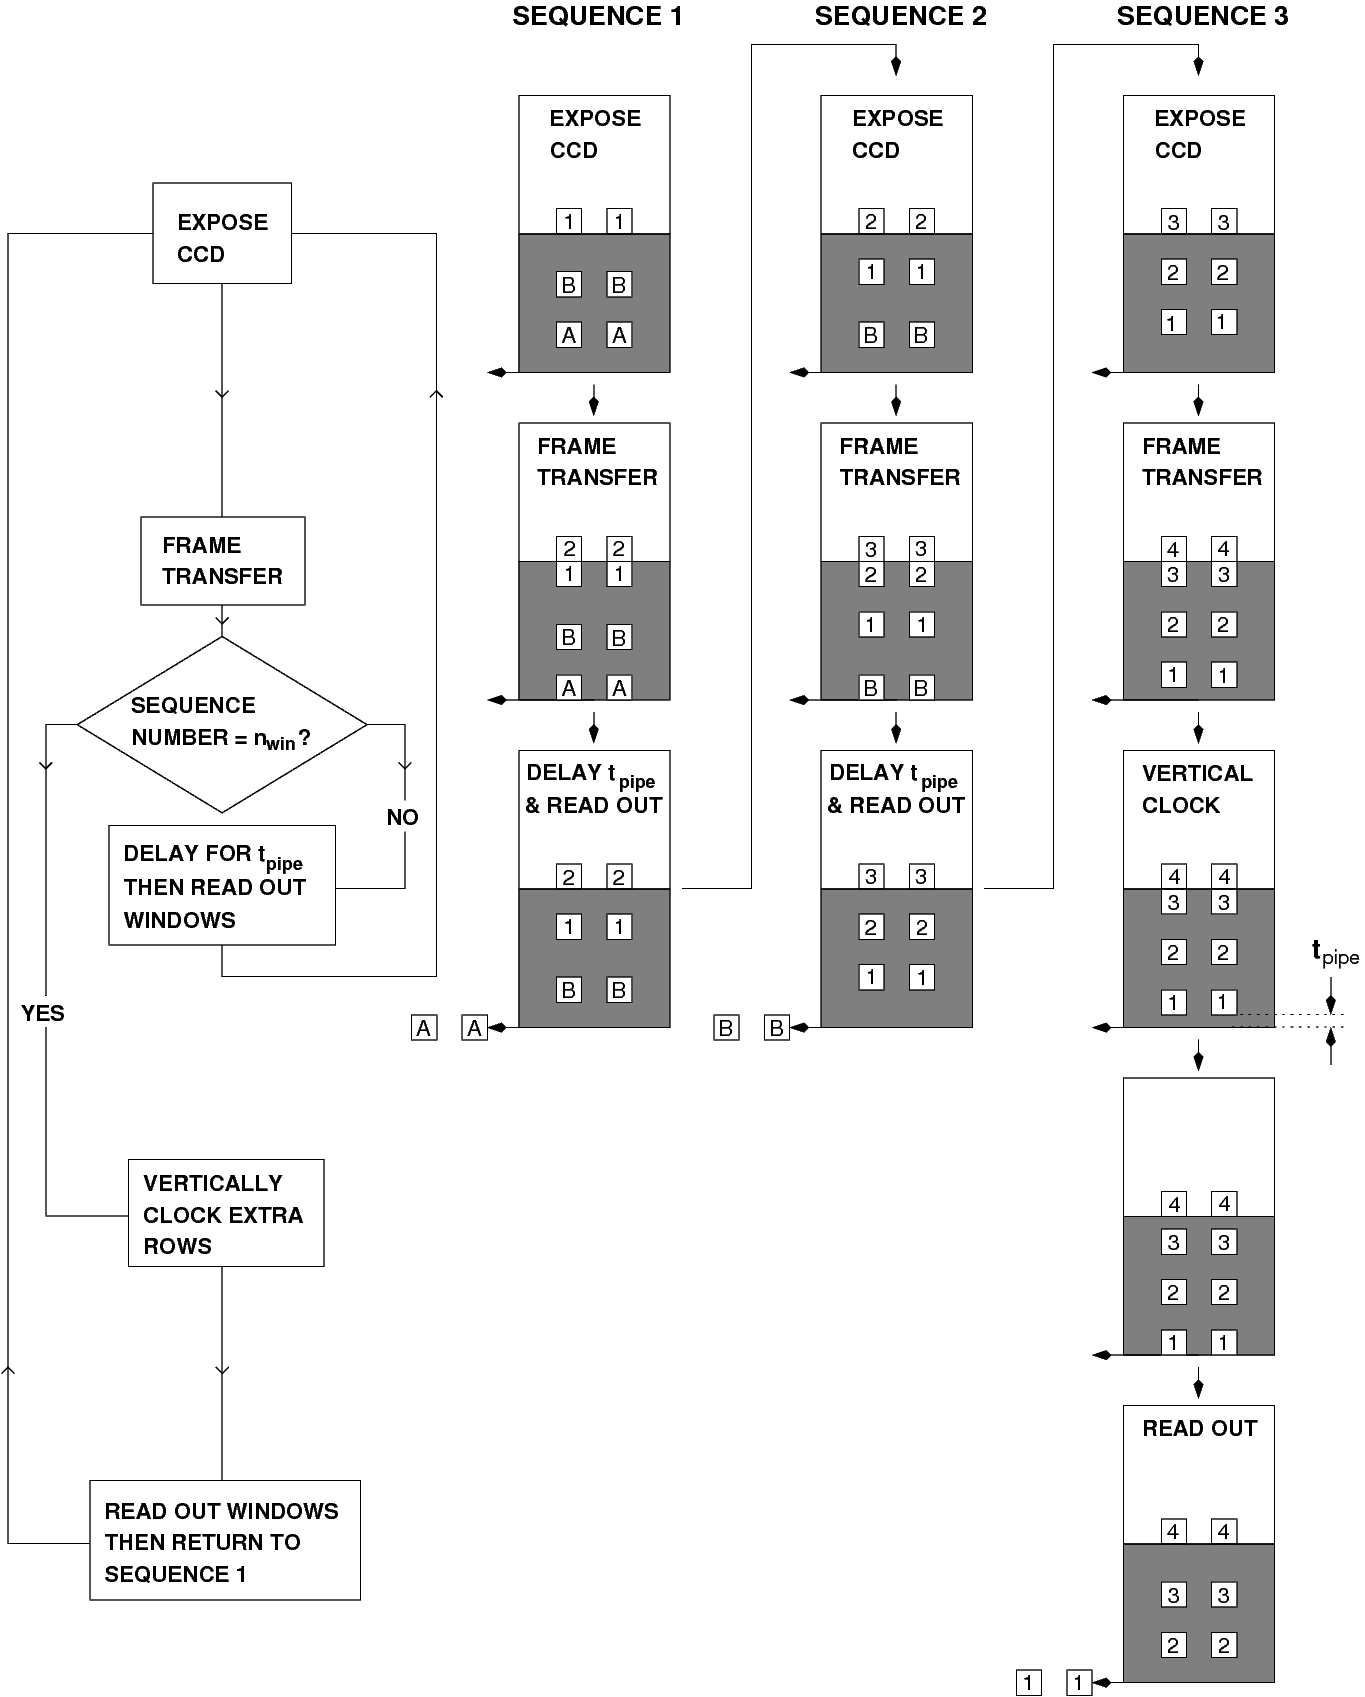
If frame rates faster than about 20 Hz are required, a completely different readout strategy to that described above is required. For this purpose, we developed drift mode for ULTRACAM, and we have implemented it in ULTRASPEC. The readout sequence in drift mode is shown pictorially in Fig. 7 and described in detail in Appendix A of Dhillon et al. (2007b). Briefly, in drift mode the windows are positioned on the border between the image and storage areas and, instead of vertically clocking the entire image area into the storage area, only the window is clocked into the (top of) the storage area. A number of such windows are hence present in the storage area at any one time. This dramatically reduces the dead time, as now the dead time between exposures is limited to the time it takes to clock only a small window into the storage area, not the full frame. For example, in the case of two windows of size 2020 pixels and binned 44, it only takes 0.3 ms to move into the storage area, reducing the dead time by a factor of 50 and providing a frame rate of 200 Hz with a duty cycle of 94%. It is worth noting that at these high frame rates it is the speed at which charge can be shifted along the serial register (currently limited by the SDSU controller to 0.48 s/pixel for the normal output), rather than the digitisation time, that limits the frame rate. With larger windows and hence lower frame rates, the reverse is true. Drift mode has the disadvantage that only two windows, instead of up to four, are available. In addition, drift mode windows spend longer on the CCD, thereby accumulating more dark current (albeit negligible in ULTRASPEC) and, without the use of the focal plane mask, more sky photons. Hence drift mode should only be used when the duty cycle in non-drift mode becomes unacceptable, which typically occurs when frame rates in excess of about 20 Hz are required. For example, we recently used drift mode when performing lunar occultations with ULTRASPEC at the TNT (Richichi et al., 2014).
Due to its complexity, drift mode only offers the possibility of two windows, with no clearing between frames. In contrast to the standard two-window mode shown in Fig. 5, the two drift-mode windows shown in Fig. 7 must have the same vertical position and size, although they can have different horizontal sizes. The only difference between the drift mode implementation in ULTRASPEC and ULTRACAM is that both windows must be read through the same output (either normal or avalanche) in ULTRASPEC, whereas in ULTRACAM there are two normal outputs which each read one drift-mode window.
For some applications, e.g. when taking flat fields or observing bright standard stars, it is desirable to use a full frame or one large window and yet have short exposure times. To enable exposures times of arbitrarily short length, therefore, ULTRASPEC also offers users the option of turning CCD clearing on or off. When clearing is turned on, the data in the image area is dumped prior to exposing for the requested amount of time. This means that any photo-electrons collected in the image area whilst the previous exposure is reading out are discarded. The disadvantage of this mode is that the duty cycle becomes very poor (1% in the case of a 0.1 s full-frame exposure in slow readout mode).
4 Performance on the TNT
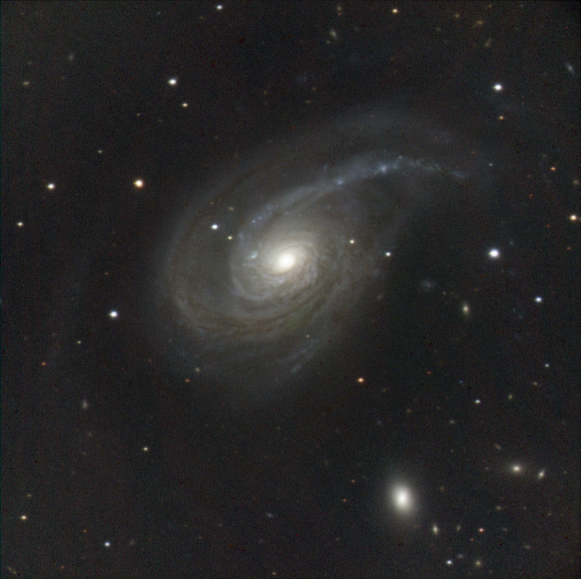

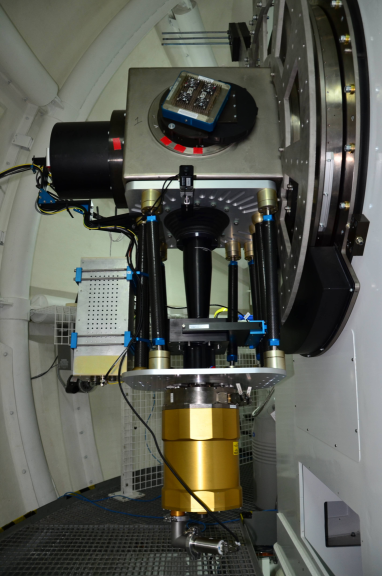
ULTRASPEC saw first light on the TNT on 2013 November 5 (see Fig. 8) and the first scientific paper, reporting on the drift-mode observation of lunar occultations, has recently been accepted for publication (Richichi et al., 2014). In this section, we detail the performance of ULTRASPEC on the TNT.
4.1 Image quality
In order to assess the image quality of ULTRASPEC on the TNT, we observed the open cluster NGC 6940. After carefully focussing the telescope in each filter, we rapidly cycled through the , , , , filters, taking images of the cluster in each filter.
We astrometrically calibrated the images using Astrometry.net (Lang et al., 2010) and then determined the platescale in each filter, finding the same value in all five filters: ”, as designed. This meets one of the original requirements of the optical design – a plate scale independent of wavelength in the 330–1000 nm range. Moreover, we found no evidence for image shift as a function of wavelength, with the stars occupying identical pixel positions in each filter.
We then measured the FWHM of all of the stars in each image and produced a map of image quality in each band. The seeing was approximately 1.2” during the tests, and we were able to confirm that the FWHM of the stars in the central arcminute of the field of view were , , , , pixels in , , , , , respectively, degrading by no more than 10% at the edge of the 7.7’ field of view in each filter. With the exception of the band, therefore, the image quality is a relatively insensitive function of wavelength and field angle, as designed. Moreover, we regularly observed stellar FWHM below 2 pixels, i.e. seeing of below 0.9”, verifying that the ULTRASPEC optics meet the requirement of providing seeing-limited stellar images in median seeing conditions (0.9”) at the TNT.
Next, we investigated the level of vignetting by moving the cluster in 20 steps across the field of view, taking an image at each position. We then measured the change in brightness of a number of stars as a function of their position on the chip and found them to be stable to within 2% across the entire field of view, indicating that there is no serious vignetting in our optics.
4.2 Flexure
Whilst still observing the open cluster NGC 6940, we rotated the Nasmyth rotator through 360∘ and determined the rotator centre, which we found lay (, ) pixels from the chip centre, verifying the excellent mechanical alignment of ULTRASPEC.
We could not see any evidence for flexure of the ULTRASPEC mechanical structure in the tracks of the stars whilst rotating, and a star placed at the rotator centre moved by no more than 3 pixels, indicating mechanical flexure of less than 39 m at the detector, as designed.
4.3 Sensitivity
By observing SDSS standard stars (Smith et al., 2002) during commissioning we were able to derive the zero points given in Tab. 3, defined as the magnitude of a star above the atmosphere that gives 1 electron per second with ULTRASPEC on the TNT. We also measured the atmospheric extinction at Doi Inthanon using observations of comparison stars obtained during multi-hour runs on variable stars. We found values of and , only % worse than the extinction measured on the best nights at the Observatorio del Roque de los Muchachos on La Palma (García-Gil et al., 2010), for example. The above figures allow us to estimate the throughput of the ULTRASPEC optics, i.e. just the lenses, and not including the atmosphere, telescope, filter and CCD. The throughputs are given in Tab. 3, and to calculate them we have assumed that the atmospheric extinction at Doi Inthanon is 10% worse than on La Palma at all optical wavelengths.
| Zero point | 22.16 | 25.28 | 25.25 | 24.55 | 23.46 |
|---|---|---|---|---|---|
| Throughput (%) | 12 | 51 | 61 | 45 | 37 |
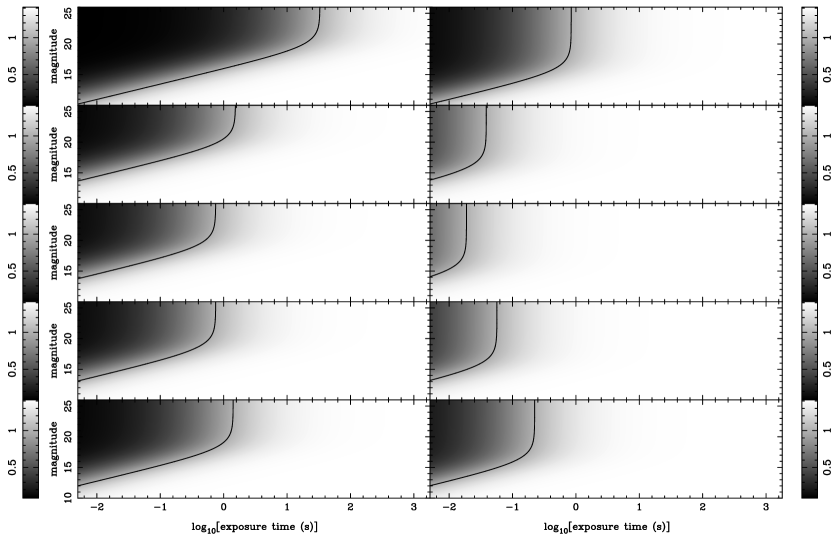
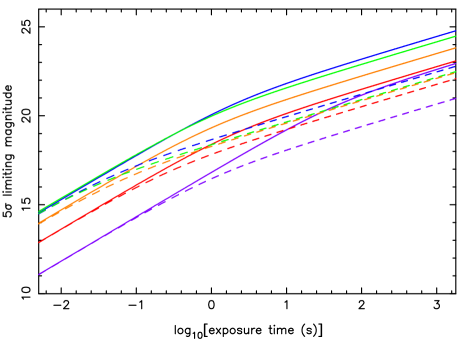
Fig. 9 shows the 5 limiting magnitudes achievable with ULTRASPEC as a function of exposure time and moon brightness, calculated using the above zero points. The curves are calculated assuming the normal output of the EMCCD is used, with a readout noise 2.3 e-. As expected, and are by far the most sensitive ULTRASPEC bands, able to achieve a limiting magnitude of nearly 15 in 0.005 s exposure times, and nearly magnitude 25 in 1800 s exposure times.
Fig. 10 shows the ratio of the SNR obtained with the normal output to that obtained with the avalanche output of ULTRASPEC on the TNT, as a function of exposure time and object magnitude. Values greater than unity lie to the right of the curved line in each panel, and indicate where it is better to use the normal output. Values less than unity lie to the left and indicate that the avalanche output would be advantageous. It can be seen that in dark time (left-hand panels), it is never worth using the avalanche output for exposure times of longer than s unless one is using the filter. This cut-off moves to s in bright time. The maximum benefit from using the avalanche output is obtained when observing the faintest targets (magnitude ) at the highest frame rates ( Hz) in dark time, when SNR gains of up to a factor of 10 are available. Note that if the avalanche output is erroneously used in the region lying to the right of the curved lines in Fig. 10, one loses a factor of in SNR due to the multiplication noise.
In practice, we almost never use the avalanche output of ULTRASPEC when imaging on the TNT. There are a number of reasons for this. First, the region of parameter space in which it is really advantageous to use the avalanche output is quite small, as shown by Fig. 10, and it is extremely rare that we require very fast observations of very faint targets (one exception being observations of pulsars). Second, it is very easy to saturate the multiplication register, which not only ruins the data but also significantly reduces the life of the EMCCD (e.g. Evagora et al. 2012). Since we often observe bright comparison stars simultaneously with faint target stars, great caution is required. The CCD 201-20 device used in ULTRASPEC has a full-well capacity in the multiplication register of approximately 80 000 e-. With an EM gain of , this means that it only requires 80 e-/pixel entering the multiplication register to saturate it. Moreover, since is a mean value and some pixels experience much higher amplification, it is safest to stay below a much lower incident light level of, say, 20 e-/pixel. Even using windows to mask out all but the faintest comparison stars does not guarantee safety, as any bright stars outside these windows that fall on the same CCD rows as the windows will pass through the multiplication register, saturating it and reducing its lifetime.
4.4 Reliability
ULTRASPEC has only two moving parts – the focal-plane slide and the filter wheel. This makes it an extremely reliable instrument. In the observing season running from the start of November 2013 to the end of April 2014 we estimate that we lost no more than 2% of the time due to technical problems with ULTRASPEC.
4.5 Outstanding issues
There are two main outstanding issues with ULTRASPEC on the TNT that we hope to fix in time for the start of the 2014/2015 observing season. The first is variable, high readout noise in the CCD, typically up to 5 e- instead of the 2.3 e- we measured in the lab. We believe this is due to the poor electrical earth of the telescope, which is due to be improved during the summer of 2014 by digging additional holes for copper earthing rods in the ground surrounding the observatory. The second is scattered light in the central arcminute of ULTRASPEC, evident as a diffuse spot of emission lying 5–10% above the sky level in CCD images. We believe this is due to poor telescope baffling around the M3 and M4 mirrors and we hope to install better baffles to cure this problem during the summer of 2014.
5 Conclusions
We have described the design and performance of ULTRASPEC, which has just successfully completed its first observing season on the TNT. The permanent presence of a high-speed imaging photometer on a telescope of this size, and in this geographical location, provides us with a powerful new tool to study compact objects of all classes, and to perform rapid follow-up observations of transient astrophysical events. It is our intention to continue operating ULTRASPEC on the TNT for many years to come.
Acknowledgments
We thank Edward Dunham for his referee’s report, which improved the clarity and usefulness of this paper. We would also like to thank the staff of the Mechanical Workshop in the Department of Physics and Astronomy at the University of Sheffield, the UK Astronomy Technology Centre in Edinburgh, the National Astronomical Research Institute of Thailand, and the European Southern Observatory at La Silla for their valuable contributions to the ULTRASPEC project. We are grateful to the European Commission (OPTICON), STFC, the Department of Physics of the University of Warwick, the Faculty of Science at the University of Sheffield, the Royal Society and the Leverhulme Trust for providing the funds to build, operate and exploit ULTRASPEC.
References
- Antoniadis et al. (2013) Antoniadis J. et al., 2013, Sci, 340, 448
- Beard et al. (2002) Beard S. M., Vick A. J. A., Atkinson D., Dhillon V. S., Marsh T. R., McLay S., Stevenson M. J., Tierney C., 2002, Proc SPIE, 4848, 218
- Della Valle et al. (2010) Della Valle A., Maruccia Y., Ortolani S., Zitelli V., 2010, MNRAS, 401, 1904
- Dhillon et al. (2007a) Dhillon V. S., Marsh T. R., Copperwheat C., Bezawada N., Ives D., Vick A., O’Brien K., 2007a, ESO Messenger, 127, 41
- Dhillon et al. (2008) Dhillon V. S., Marsh T. R., Copperwheat C., Bezawada N., Ives D. J., Vick A., O’Brien K., 2008, in American Institute of Physics Conference Series, Vol. 984, High Time Resolution Astrophysics: The Universe at Sub-Second Timescales, Phelan D., Ryan O., Shearer A., eds., p. 132
- Dhillon et al. (2005) Dhillon V. S., Marsh T. R., Hulleman F., van Kerkwijk M. H., Shearer A., Littlefair S. P., Gavriil F. P., Kaspi V. M., 2005, MNRAS, 363, 609
- Dhillon et al. (2007b) Dhillon V. S. et al., 2007b, MNRAS, 378, 825
- Evagora et al. (2012) Evagora A. M., Murray N. J., Holland A. D., Burt D., Endicott J., 2012, Journal of Instrumentation, 7, C01023
- Fukugita et al. (1996) Fukugita M., Ichikawa T., Gunn J. E., Doi M., Shimasaku K., Schneider D. P., 1996, AJ, 111, 1748
- Gandhi et al. (2010) Gandhi P. et al., 2010, MNRAS, 407, 2166
- García-Gil et al. (2010) García-Gil A., Muñoz-Tuñón C., Varela A. M., 2010, PASP, 122, 1109
- Ives et al. (2008) Ives D. J., Bezawada N., Dhillon V. S., Marsh T. R., 2008, Proc SPIE, 7021, 10
- Lang et al. (2010) Lang D., Hogg D. W., Mierle K., Blanton M., Roweis S., 2010, AJ, 139, 1782
- Leach & Low (2000) Leach R. W., Low F. J., 2000, Proc SPIE, 4008, 337
- Littlefair et al. (2006) Littlefair S. P., Dhillon V. S., Marsh T. R., Gänsicke B. T., Southworth J., Watson C. A., 2006, Sci, 314, 1578
- Marsh et al. (2014) Marsh T. R. et al., 2014, MNRAS, 437, 475
- McLay et al. (2010) McLay S. A., Bezawada N. N., Atkinson D. C., Ives D. J., 2010, Proc SPIE, 7740, 12
- Naylor (1998) Naylor T., 1998, MNRAS, 296, 339
- Ortiz et al. (2012) Ortiz J. L. et al., 2012, Nat, 491, 566
- Parsons et al. (2010) Parsons S. G., Marsh T. R., Copperwheat C. M., Dhillon V. S., Littlefair S. P., Gänsicke B. T., Hickman R., 2010, MNRAS, 402, 2591
- Richichi et al. (2014) Richichi A., Irawati P., Soonthornthum B., Dhillon V. S., Marsh T. R., 2014, AJ, in press (arXiv:1408.0073)
- Simons (1995) Simons D. A., 1995. Technical note no. 30, Gemini Observatory
- Smith et al. (2002) Smith J. A. et al., 2002, AJ, 123, 2121
- Tulloch & Dhillon (2011) Tulloch S. M., Dhillon V. S., 2011, MNRAS, 411, 211
- Zalucha et al. (2007) Zalucha A. et al., 2007, Icarus, 192, 503