The Anomalous Compressibility and Metallization of Deuterium under Shock-Wave Compression
Abstract
High values of deuterium compressibility under shock-wave compression, recently discovered in several experiments, are explained by an unusual dielectric-metal phase transition from a dense molecular gas into a liquid-metal atomic gas. This phase transition recently described by authors was named the dissociative phase transition (DPT). The same phase transition describes a significant scattering of experimentally measured densities within an area of anomalous compressibility.
pacs:
64.10+h, 64.70.pm, 64.75.CdI I. Introduction
The experiments on liquid deuterium shock-wave compression were widely discussed recently Fortov . The first experiments DaSilva discovered high (even abnormally high) compressibility, but their results had significant uncertainties. The further experiments that used different methods did not reveal such an anomalous compressibility Knudson ; Nellis ; Trunin . A possibility that the first experiments were not correct were discussed, however the authors of DaSilva did not denounce their results. The discussion of experiments together with numerous theoretical models can be found in the review Fortov and in the original papers. It is important to note that all theoretical calculations gave a continuous density dependence of pressure on Hugoniot curves in the experimentally studied areas Knudson ; Trunin ; Nellis . Only one rather exotic model of ”linear mix” by M. Ross Ross features the anomalous compressibility in agreement with the results of DaSilva . The deuterium free energy in this model is a linear mixture of molar fractions of atomic-molecular and metallic components. The Ross model describes the atomic-molecular component in a usual way, within the frame of perturbation theory of liquid mixture of atoms and molecules. The liquid metal component is described in the approximation of amount of degenerated electrons and classical ions. In this model, the shock adiabatic curve is a continuous function of the volume (specific density) like in all other models Fortov , but the curve demonstrates high compressibility values owing to dominance of the liquid-metal component at high densities. Thus, the Ross model explains certain correlation between the high values of compressibility and deuterium metallization.
In Khomkin , we suggested a new model for hydrogen molecule dissociation related with metallization of an atomic component of molecular hydrogen under compression. The conversion of a dense molecular liquid into an atomic metallized liquid is the first-order phase transition, DPT. The model assumes that, owing to the appearance of conductivity electrons (cohesion), the interaction of free (dissociated) atoms in dense molecular hydrogen turns into a collective interaction. Such interaction is well known in the theory of liquid alkali metals, and the binding energy is known as the cohesion energy. In Khomkin , we calculated the cohesion energy for all densities in the frame of Wigner-Seitz-Bardeen theory. The collective binding energy grows comparable with the binding energy of an atom in a molecule (half of the dissociation energy) thus increasing the dissociation rate. The estimate of the critical transition point made in Khomkin indicates that the transition occurs in the anomaly area of Hugoniot curve for deuterium.
In the present work, we calculate the shock-wave Hugoniot curve for deuterium in the low-temperature branch (T 12000 K) on the basis of the model Khomkin . The calculated Hugoniot curve demonstrates anomalous behavior: the Rankine-Hugoniot equation has one, two, three, and again two and one solutions in the certain pressure interval (in the anomaly area). The third solution is unstable and corresponds to the unstable part of the curve. In this case, one can consider a break of the adiabatic curve in the area of the anomaly. This area coincides with the area of experimental data with high uncertainties DaSilva ; Knudson ; Nellis ; Trunin . Therefore, there is a correlation of the anomaly area with the two-phase state on the adiabatic curve, where the molecular fluid (gas with a density of a liquid) and atomic metallized liquid coexist. In this area, the density is not a well-defined parameter, which results in the scattering of experimental data on density values.
II II. Chemical model for atomic-molecular deuterium
The free energy of dissociated atomic-molecular mixture of molecules and atoms in volume at temperature in the liquid perturbation theory suggested in Khomkin has the following form:
| (1) |
where and are the de Broglie wave lengths of an atom (a molecule) and their statistical weights, respectively, is the partition function of a molecule. is the collective cohesive energy in dense atomic hydrogen as a function of the dimensionless Wigner-Seitz cell radius in Bohr units , calculated in Khomkin , where , is the density of number of atoms. For hydrogen and deuterium, these values coincide. is the total packing parameter expressed in terms of atomic and molecular radii and , respectively. The first three terms in (1) describe the mixture of atoms and molecules in Carnahan-Starling approximation for amounts of molecules and atoms of the hard core mixture. The fourth term describes the cohesive energy.
III III. DPT binodal
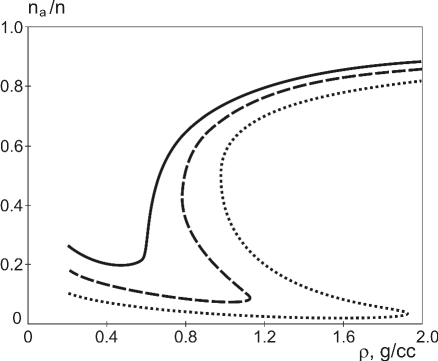
Figure 1 displays the calculated isotherms of dissociation ratio , , is the density of number of molecules, as functions of density for temperatures , , and K.
At low densities (atomic gas), the dissociative equilibrium curve tends to unity. As density increases, the value of decreases and formation of molecules appears. Then, very rapidly, the dissociation with formation of liquid atomic phase occurs, which is the DPT.
[b]
[b]
[b]
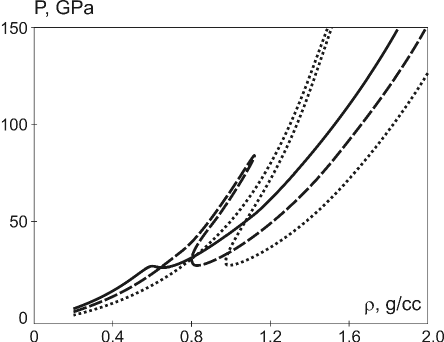
Figure 2 shows the isotherms for the same values of temperature that in Fig. 1. The curves clearly demonstrate presence of the unusually shaped van der Waals’ loops. We calculated the DPT binodal using the Maxwell’s equal area rule. The following table presents the calculation results, where and are densities of gas and liquid components, respectively.
| T (K) | P (GPa) | (g/cm3) | (g/cm3) |
|---|---|---|---|
| 12000 | 30 | 0.6 | 0.6 |
| 10500 | 36 | 0.72 | 0.96 |
| 10000 | 39 | 0.78 | 1.04 |
| 9000 | 45 | 0.9 | 1.2 |
| 8000 | 55 | 1.02 | 1.4 |
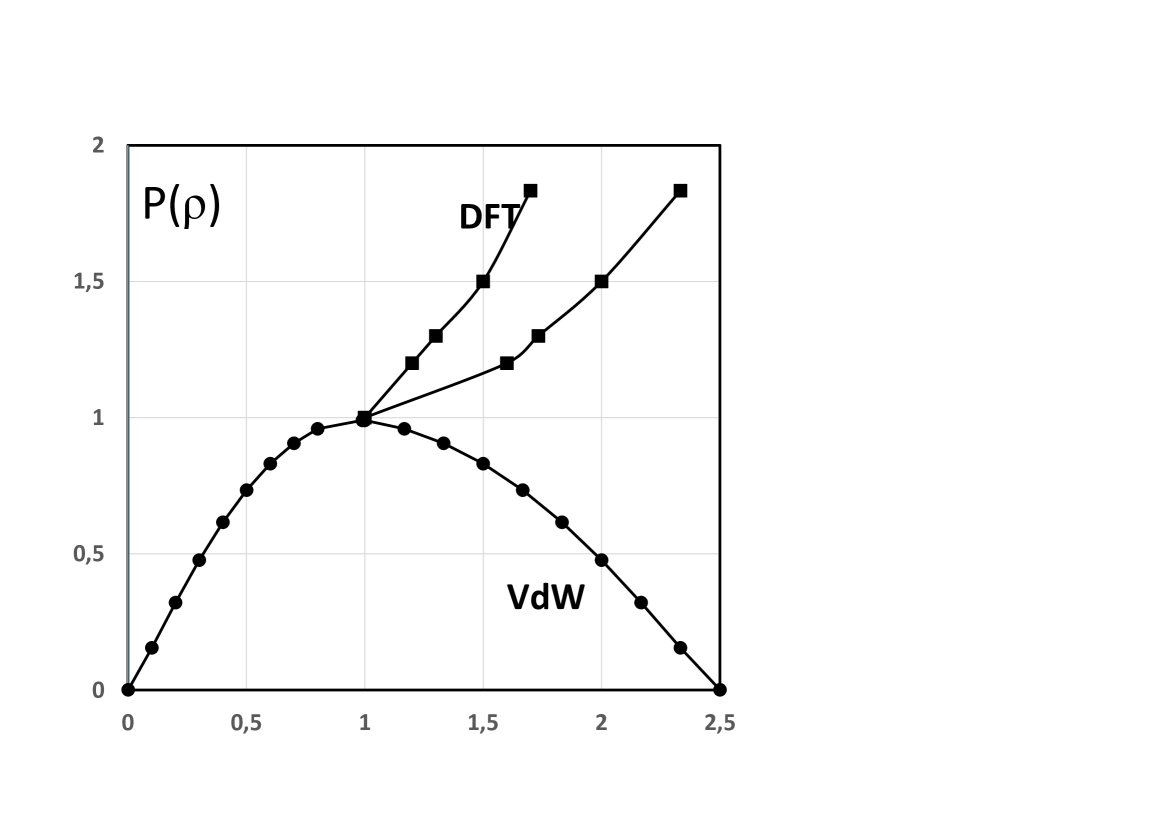
Figure 3 displays the DPT binodal in terms of the dimensionless units and defined as the ratios of each thermodynamic quantity to its critical value. Such presentation facilitates a comparison with the van der Waals (VdW) binodal. The figure clearly visualizes the difference between two phase transitions under consideration.
The delocalization degree of the bound electron in the critical point is close to while the compression delocalization degree tends to unity (see more details in Khomkin ). The metallization occurs owing to the existence of the conductivity electrons and to the collective binding energy.
IV IV. Hugoniot curve and discussion
The initial conditions in the solution of Rankine-Hugoniot equation for compression adiabatic curve are g/cm3, MPa. The DPT for free energy (1) shows certain peculiarities on the adiabatic curve. The Rankine-Hugoniot equation in the temperature interval K has three solutions for density. The first and the second solutions are stable, while the third one is unstable.
Figure 4 shows the solutions for Hugoniot adiabatic curve where the molecular and the atomic radii are taken from Redmer and Khomkin , respectively.
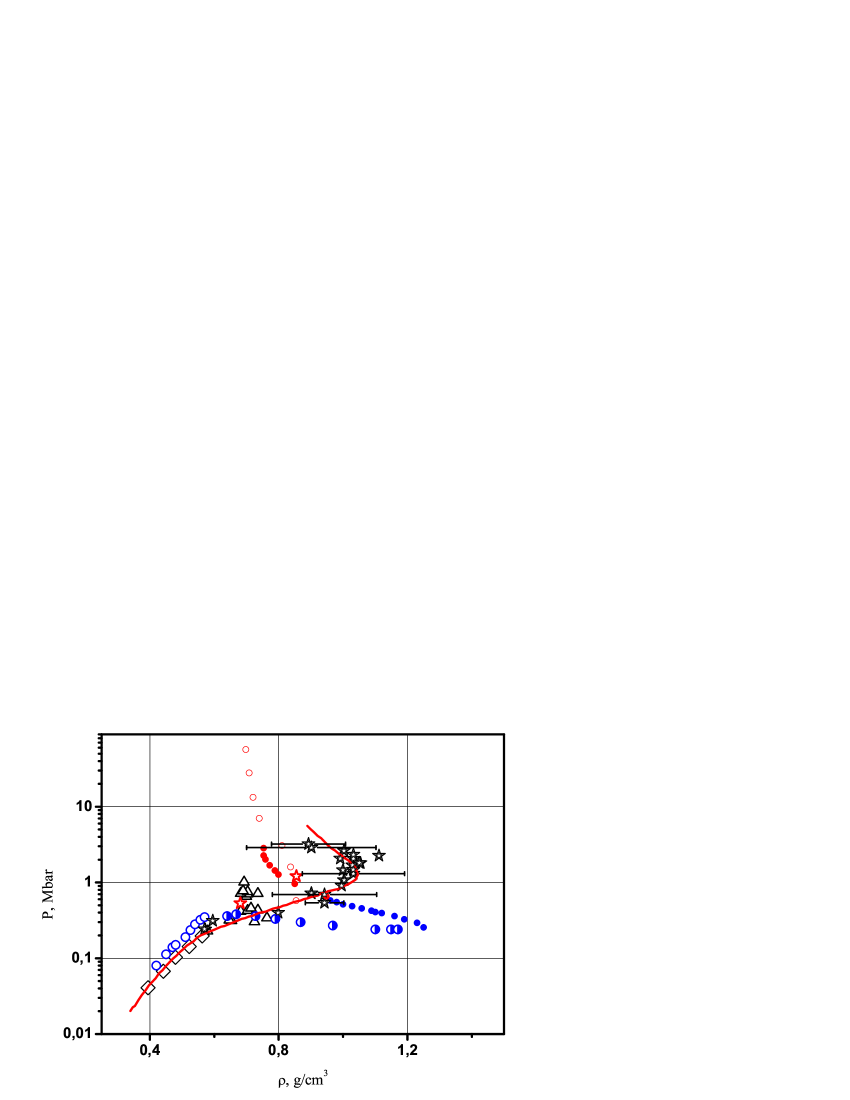
The curves and scatters in Fig. 4 correspond to the experimental data, our results, and results of the most adequate models of other authors. The latter include the Ross model Ross . Also, we show the results of calculations in a cell approximation for the system of electrons and ions Vorobiev , and the results of the Monte-Carlo calculations Levashov for the same system. These results confirm our conclusion on molecular deuterium metallization under compression. The main qualitative result is the appearance of the area with ill-defined density. This unusual phenomenon provides the new interpretation of the experimental results for deuterium compression. The discrepancy of the results of this experiment and results obtained in other works Knudson ; Nellis ; Trunin appears in result of the existence of an area with undetermined density (like the two-phase liquid-vapor state) rather than owing to the uncertainties of the first experiment DaSilva . The anomaly area revealed by our calculations corresponds to somewhat lower pressure than the experimental observations. However, we consider the presence of anomaly area in our model as the most important result of our work.
V V. Conclusions
In the frame of our model, we found the DPT binodal for dense dissociating molecular hydrogen. The DPT binodal is significantly different from traditional binodal of gas-liquid phase transition described by the van der Waals equation. The Hugoniot adiabatic curve calculated in the frame of our model has an anomaly in the area of the most scattered experimental data. We suggested a new interpretation of the experimental data DaSilva ; Knudson ; Nellis ; Trunin . The anomaly area appears owing to the presence of two coexisting phases: a molecular fluid (gas with a density of a liquid) and an atomic metallized liquid. Thus, density is an ill-defined quantity in this area.
References
- (1) V. E. Fortov, A. G. Khrapak and I. T. Yakubov, Physics of Strongly Coupled Plasmas, (Oxford University Press, New York, 2005)
- (2) L. B. Da Silva, P. Celliers, G. W. Collins et al, Phys. Rev. Lett. 7̱8, 483 (1997).
- (3) M. D. Knudson, D. L. Hanson, J. E. Bailey et al, Phys. Rev. Lett. 8̱7, 225501 (2001).
- (4) N. C. Holmes, M. Ross, and W. J. Nellis, Phys. Rev. B 5̱2, 15835 (1995).
- (5) R. F. Trunin, V. D. Urlin, V. E. Fortov et al, JETP letters 7̱6, No. 7, 433 (2002).
- (6) M. Ross, Phys. Rev. B 5̱8, 669 (1998).
- (7) A. L. Khomkin and A. S. Shumikhin, JETP 1̱41, 89 (2012).
- (8) H. Juranek and R. Redmer, J. Chem. Phys. 1̱12, 3780 (2000).
- (9) V. S. Vorob’ev and V. G. Novikov, J. Chem. Phys. 1̱34, 114509 (2011).
- (10) V. S. Filinov, P. R. Levashov, A. V. Botan et al, J. Phys. A: Math. Theor. 4̱2, 214002 (2009).