A Study of Dust and Gas at Mars from Comet C/2013 A1 (Siding Spring)
Abstract
Although the nucleus of comet C/2013 A1 (Siding Spring) will safely pass Mars in October 2014, the dust in the coma and tail will more closely approach the planet. Using a dynamical model of comet dust, we estimate the impact fluence. Based on our nominal model no impacts are expected at Mars. Relaxing our nominal model’s parameters, the fluence is no greater than grains m-2 for grain radii larger than 10 µm. Mars orbiting spacecraft are unlikely to be impacted by large dust grains, but Mars may receive as many as grains, or kg of total dust. We also estimate the flux of impacting gas molecules commonly observed in comet comae.
Subject headings:
celestial mechanics — comets: individual (C/2013 A1 (Siding Spring) (catalog )) — meteorites, meteors, meteoroids — methods: numerical1. INTRODUCTION
Comet C/2013 A1 (Siding Spring) will pass Mars with a close approach distance of km, and a relative speed of 55.96 km s-1 on 2014 Oct 19 at 18:29:03 UTC (3- uncertainties; Farnocchia et al., 2014). The nucleus will miss the planet, its moons, and orbiting spacecraft. However, given the right combination of ejection velocity, ejection time, and response to radiation pressure, dust grains from the comet can reach the planet. Farnocchia et al. (2014) predict that Mars will miss the comet’s orbit by km at 20:10 UTC. This second close approach potentially reduces the energy required to place dust grains on impacting orbits. We present models of the dust and gas based on the summary of the comet’s activity by Farnham et al. (in preparation) and estimate the impact hazard for Mars and its satellites as well as the comet gas flux at Mars.
2. SIMULATIONS
2.1. Dust Dynamics
To assess the impact hazard, we generated two simulations of particles each, picked from broad parameter ranges. These raw simulations act as guides to determine which combinations of size, ejection speed, and ejection time may result in impacts. Next, we define more limited parameter sets that are carefully chosen to match known parameters of the comet. We select and weight particles from the raw simulations that match those sets, and use them to estimate the fluence at Mars. Below we describe our dynamical model, the raw simulations, and four parameter sets used to estimate the impact hazard.
The circumstances of the encounter are simulated with the dynamical model of Kelley (2006). For this study we use the JPL ephemeris solution #46 (Farnocchia et al., 2014). In order to reduce the required computational time, we modified the model to use the two-body (Keplerian) propagation functions from NASA’s Navigation and Ancillary Information Facility SPICE toolkit. Dust grains are parameterized by , the ratio of the force from solar radiation pressure to the force from solar gravity: , where is the radiation pressure efficiency, is the grain density in units of g cm-3, and is the grain radius in units of µm (Burns et al., 1979). In the Keplerian solution, the gravitational force from the Sun is reduced by the factor .
The magnitude of the error introduced by neglecting planetary perturbations can be estimated by comparing zero-ejection velocity syndynes (lines of constant with variable ejection times; Finson & Probstein, 1968) generated using the Keplerian solution to those generated using the original code. The distances between the syndynes define the error. For grains ejected up to 4 years before the closest approach, the error is at most 300 km for dust found within km from the nucleus. We also considered whether the gravitational pull of Mars is significant. Ignoring the atmosphere, particles grazing the surface are displaced km at closest approach, and the cross-section enhancement factor from gravitational focusing by Mars is 1.008 (Jones & Poole, 2007). The Keplerian solution is sufficient for our purposes.
Simulation 1 contains particles selected from the following parameters, based on observations of the comet with a generous conservative margin: ages range uniformly from 0 to 4 yr (out to AU); expansion speeds range uniformly from 0 to , where m s-1 is the expansion speed of 1 mm grains ejected at 5 AU from the Sun; ejection velocities are radial and isotropically distributed around the nucleus; and, radii are selected from a distribution uniform in log-space () ranging from 10 to µm. The logarithmic distribution ensures our final results will have a statistically uniform representation of each size decade. For the conversion from radius to we assume a grain density of 1 g cm-3, and . J.-Y. Li et al. (in preparation) imaged Siding Spring at 4.6, 3.8, and 3.3 AU from the Sun with the Hubble Space Telescope WFC3 instrument. The high spatial resolution of the images (40 mas per pixel, corresponding to km per pixel) resolve the inner coma, and allow investigations of the dust grain expansion velocities. Farnham et al. (in preparation) analyzed those images and found that the dust that comprises the bulk of the coma and tail has speeds best matched by , for m s-1. Grains with these speeds are a subset of simulation 1.
For an alternative scenario we consider the analysis of the Hubble images by Li et al.. Using the distance from the nucleus to the outer edge of the coma in the sunward direction, they find that the heliocentric distance dependence of the resulting speeds follow m s-1 for AU, assuming grains ( m s-1). Speeds based on this relationship for AU exceed those in simulation 1. Therefore, we ran a second particle simulation (simulation 2) with speeds picked uniformly from 0 to for m s-1. However, we note that these speeds, derived from some of the fastest moving grains in the coma, are much higher than the Farnham et al. results, derived from the coma and tail morphologies. Analyses based on the Li et al. speeds will serve as upper-limit cases for fast moving grains not accounted for in the Farnham et al. approach.
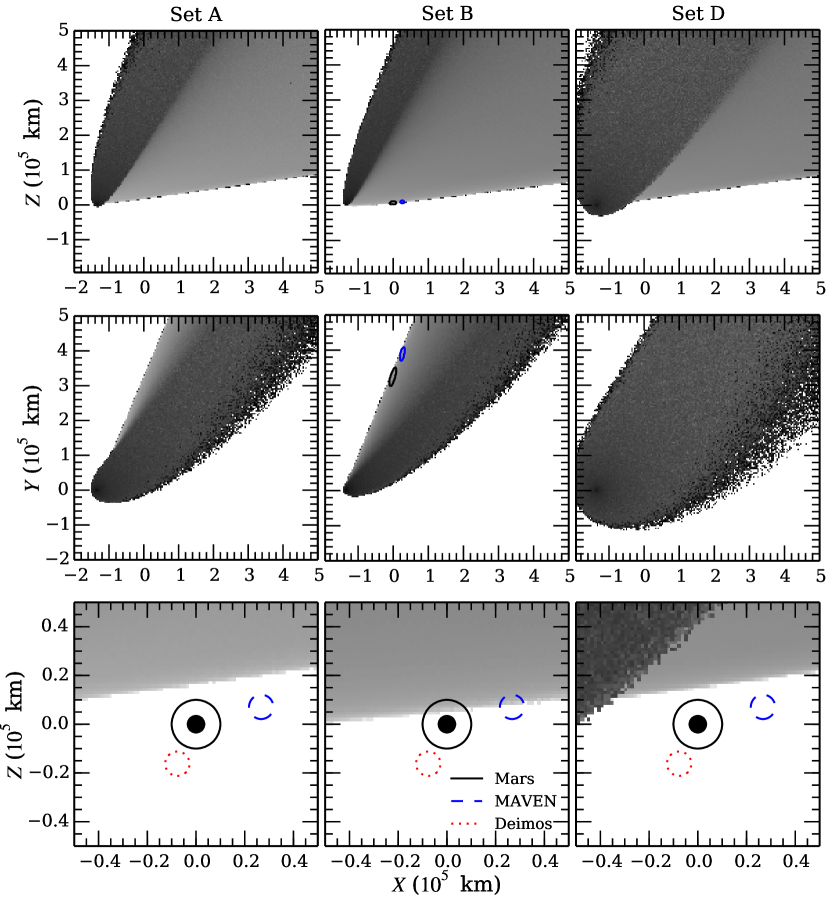
In order to transform the simulations into an impact hazard at Mars, we first rotate the position vectors from the ecliptic J2000 coordinate frame into a reference frame defined at closest approach: the x-axis is given by the comet-Mars position vector, the y-axis by the comet-Mars velocity vector, and the z-axis by the right-hand rule. Simulations 1 and 2 projected into this reference frame is shown in Fig. 1. The relative timing of grains arriving at Mars is based on their y-axis position; km corresponds to a time difference of 29.8 min. We then weight each particle to remove the bias introduced by our raw simulation’s grain size distribution, and to provide a real estimate of the grain’s frequency of occurrence in the comet coma. The particle weights are based on the parameter sets in Table 1.
Set A is the nominal case, directly based on the results of Farnham et al. (in preparation). Sets B, C, and D are variations chosen to provide upper-limit estimates on the impacting dust. First, consider that the tail analysis of Farnham et al. best describes the smallest grains ( µm) and closest heliocentric distances (3 AU 5 AU), and is extrapolated to larger and . Therefore, as an alternative scenario, we have defined set B using a radius and heliocentric distance dependence in closer agreement to theoretical predictions: (cf. Whipple, 1951; Crifo & Rodionov, 1997). The speeds follow m s-1, corresponding to for ( µm).
Set C has the same parameters as set B, but the dust is shifted closer to Mars according to the ephemeris’s 3- error ellipse (Farnocchia et al., 2014). In our closest approach reference frame described above, the dust is displaced by km, km.
Set D is based on our nominal case, but uses simulation 2 and the ejection speeds found by Li et al. (in preparation). As described above, these speeds are representative of the fastest moving grains, and not the whole coma.
| Parameter | Set A | Set B | Set C | Set D |
|---|---|---|---|---|
| Gas production rate at 3.1 AU, (kg s-1) | 25.7 | |||
| heliocentric dependence for AU | ||||
| heliocentric dependence for AU | ||||
| Dust-to-gas mass ratio | 1.0 | |||
| Reference expansion speed,aaExpansion speed of 1 mm-radius grains at 5 AU. (m s-1) | ||||
| Expansion speed dependence on | ||||
| Expansion speed dependence on | ||||
| Minimum grain radius (µm) | 0.1 | |||
| Maximum grain radius (µm) | ||||
| Grain size distribution, | ||||
| Comet-Mars closest-approach distance (km) | ||||
| Raw (unweighted) number of particlesbbAfter removing particles that do not meet the ejection speed criteria. Fluence and times are given at Mars. Times were calculated using 5-min bins, where “NA” indicates the time cannot be computed. | ||||
| Raw (unweighted) number of impacting grainsbbAfter removing particles that do not meet the ejection speed criteria. Fluence and times are given at Mars. Times were calculated using 5-min bins, where “NA” indicates the time cannot be computed. | 0 | 0 | ||
| Total fluenceb,cb,cfootnotemark: ( grains m-2) | 0 | 0 | ||
| Total fluenceb,cb,cfootnotemark: ( kg m-2) | 0 | 0 | ||
| Time of impactsbbAfter removing particles that do not meet the ejection speed criteria. Fluence and times are given at Mars. Times were calculated using 5-min bins, where “NA” indicates the time cannot be computed. (UTC) | NA | 19:57–20:17 | 19:52–20:11 | NA |
Note. — Ellipses indicate the parameter is unchanged from set A.
2.2. Gas
The future activity of comet Siding Spring is challenging to predict, but must be based on our present set of observations. The gas production rates, molecules s-1 at AU, and molecules s-1 at AU, were measured by Farnham et al. (in preparation) and Bodewits et al. (2014), respectively, based on photometric imaging of the comet with the Spitzer Space Telescope and the Swift satellite. We make two predictions of the gas production rate at Mars, based on these measurements of CO2 and H2O.
First, we propagate the measured CO2 production rate from 3.1 AU to 1.4 AU, then compute the water production rate using an assumed CO2-to-H2O mixing ratio. The mean mixing ratio, based on Table 1 of A’Hearn et al. (2012) is . Based on pre-perihelion observations of 14 dynamically new comets, Whipple (1978) found that, on average, their lightcurves grow as , suggesting activity grows as . We adopt and to derive a range of possible values at 1.4 AU: molecules s-1 and molecules s-1. Repeating the exercise, but instead starting with the water measurement at 2.5 AU, we find molecules s-1 and molecules s-1. Altogether, we adopt molecules s-1 and molecules s-1.
To estimate the gas fluence and peak volume density at the top of the Martian atmosphere, we modeled the coma with a modified three-generation Haser model (Festou, 1981; Combi et al., 2004; Bodewits et al., 2011), considering H2O, CO2, CO, and CN. The relative abundances of CO and CN are based on the mean CO-to-H2O mixing ratio (0.07) from A’Hearn et al. (2012), and the “typical” composition of dynamically new comets from A’Hearn et al. (1995). We also include OH, H, and O as photodissociation products of H2O. Our results are given in Table 2.
| Gas | Production Rate | Relative Abundance | ||
|---|---|---|---|---|
| ( s-1) | ( m-2) | ( m-2 s-1) | ||
| H2O | 4.0 | 100 | 1.9 | 4.4 |
| OH | 0 | 0 | 2.8 | 4.4 |
| O | 0 | 0 | 2.0 | 1.7 |
| H | 0 | 0 | 0.94 | 0.88 |
| CO2 | 0.50 | 13 | 8.2 | 14. |
| CO | 0.28 | 7 | 0.38 | 0.70 |
| CN | 0.012 | 0.3 | 0.0098 | 0.019 |
Note. — OH is a photodissociation product of H2O. Only photodissociation of H2O and OH are considered for the H and O abundances.
3. RESULTS
3.1. Raw Simulations
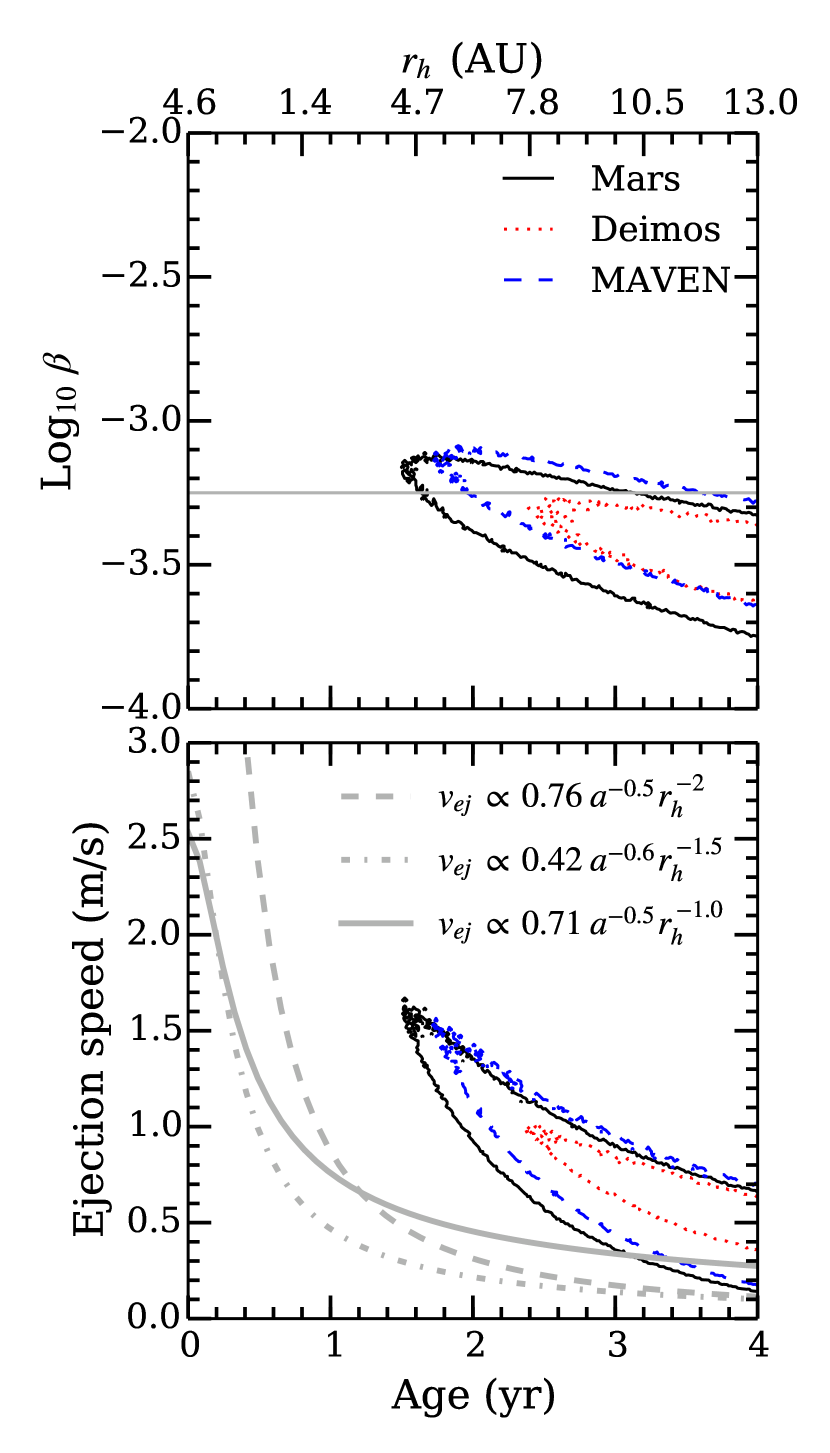
The raw simulations provide a guide to understanding what combination of grain size, ejection velocity, and age results in an impact hazard at Mars. We define impacts at Mars as any particle found within a distance of 10,000 km from the center of the planet. This distance includes the orbit of Phobos (9400 km semi-major axis), and the apoapsis of the MAVEN spacecraft’s nominal science orbit (6000 km; provided by NASA JPL). We also investigate a 5000 km region centered on the position of Deimos (23,000 km semi-major axis) at the time of closest approach. A third region of interest is based on the 48,000 km apoapsis of MAVEN’s orbit, assuming a 5-week delay in science operations. Given these criteria, the grain parameters that yield impacts are presented in Fig. 2. The only particles in simulation 1 that reach the Martian system are those ejected with speeds of a few meters per second, have radii of 0.7–3.6 mm, and are ejected at least 1.5 yr prior to the encounter.
3.2. Impact Hazard
For each parameter set, the impact hazards are computed by taking the set of particles found in each region of interest, removing those speeds outside the set’s range, and weighting remaining particles according to the set’s total production rate, grain size distribution, etc. Table 1 lists, for Mars, the raw number of impacting grains (i.e., before particle weighting), the impact fluence (i.e., after particle weighting), and the start and stop times of the hazard. No impacts are expected based on our nominal model, nor the model (sets A and D) because the ejection speeds of dust grains at AU are too low to place particles within the vicinity of Mars (Fig. 2). In addition, displacing the comet dust in these two models according to the ephemeris 3- uncertainty ellipse does not result in any impacts.
In order to attain impacting particle trajectories, higher ejection speeds are needed at AU. This requirement is accomplished with the size--speed relationship of parameter set B, resulting in a total fluence of grains m-2. Based on the comet’s current predicted closest approach time, the grains arrive between 19:57 and 20:17 UTC (time at Mars), nearly centered on the epoch at which Mars crosses the comet’s orbital plane (Farnocchia et al., 2014). Note that non-gravitational forces frequently act upon comet nuclei, but we can neglect these effects because the dust is ejected at heliocentric distances where activity and resulting non-gravitational forces were low (see Fig. 5 of Farnocchia et al., 2014). However, the current nucleus ephemeris uncertainty is still valid for the dust. Displacing the dust in parameter set B closer to Mars (set C) shifts the arrival time 5 min earlier and increases the fluence by a factor of 4.
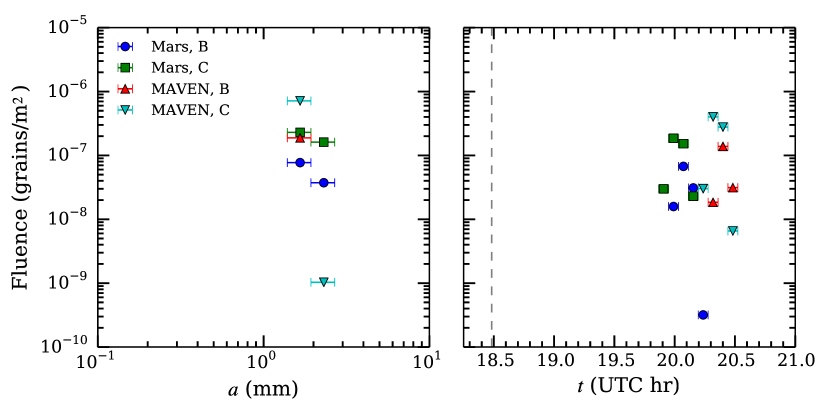
The fluence results are summarized for Mars and MAVEN in Fig. 3. The grains are limited to 1 to 3 mm in radius, due to the combined effects of radiation pressure, grain age, and ejection speed. The timing of the hazard at MAVEN’s distant apoapsis is 25 min later than the hazard at Mars, and the fluences are a factor of 2 higher. In all simulations, the Deimos region of interest remained dust free.
Gas outflow and nucleus gravity limits the size of dust grains that can be placed into heliocentric orbit. Meech & Svoren̆ (2004) present the critical dust radius, , that can be lifted off a spherical nucleus by estimating the drag force on a spherical grain, and integrating the resulting equation of motion,
| (1) |
where is the atmoic weight of the driving gas, is the mass of hydrogen, is the gas production rate (molecules s-1), is the expansion speed of the gas, and are the grain and nucleus densities, is the nucleus radius, and is the gravitation constant. Let km s-1 to be consistent with Farnham et al. (in preparation), and let the nucleus density be 0.3 g cm-3. The radius of the nucleus has not been measured, but Bodewits et al. (2014) estimate km based on water projection rates from Swift photometry. Therefore we consider two values: 0.5 and 2.0 km. For our adopted parameters, CO2 can lift grains larger than 100 µm at heliocentric distances inside of 14 and 8 AU for and 2.0 km, respectively. However, our parameter set ejection speeds only place particles on impacting trajectories for AU (Fig. 2). Thus, given this simplistic model, an impact hazard may not be expected if the nucleus radius is km or larger.
Overall, we do not expect any impacts on Mars-orbiting spacecraft. Based on the cross-sectional area of Mars and our 10,000 km average fluence, the planet may receive up to grain impacts from 1- to 3-mm-radius grains, totaling kg, based on our models. At most, a few impacts may be expected on Phobos (), and no impacts at Deimos.
3.3. Comparison with Other Results
Moorhead et al. (2014) and Vaubaillon et al. (2014) predict a significantly larger impact hazard, with fluences of 0.1 grains m-2 and larger. Their large fluences appear to be primarily due to their choice of ejection speeds. Moorhead et al. (2014) use m s-1 (A. Moorhead, private communication), and Vaubaillon et al. (2014) use up to 20 m s-1 (J. Vaubaillon, private communication). Unfortunately, few observations that could constrain the dust expansion speeds, if any, were available to these investigators.
In contrast, Ye & Hui (2014) and Tricarico et al. (2014) constrain their fluence estimates using observations of the comet. Tricarico et al. (2014) base their methods on the Farnham et al. (in preparation) and Li et al. (in preparation) data, the same as our investigation, but with slightly different interpretations. They both predict little to no risk of impacts for the Mars-orbiting spacecraft, despite their independent approaches. In particular, Ye & Hui (2014) used observations of Siding Spring and the similarly bright comet C/2012 S1 (ISON) to derive the dependence of ejection speed on size and :
| (2) |
best matched their data, assuming a 2.5-km-radius nucleus and 0.3-g cm-3 dust, resulting in no impacts for mm, and a fluence of grains m-2 for grains down to 10 µm in radius. In our parameterization, these speeds correspond to m s-1, higher than our set B. Using their speeds and our production rate history, we find the same fluence, grains m-2, but all impacts are millimeter sized.
Finally, we compare our results to the natural background of meteoroids estimated for the Mars Reconnaissance Orbiter. Over a 5-year period, the total fluence for meteoroids with mm is 0.0021 grains m-2, and for mm, it is 3.1 grains m-2 (Newell, 2005). Our predicted fluences from comet Siding Spring are orders of magnitude smaller than these values, and we conclude the comet poses little additional hazard to the spacecraft.
3.4. Comet Gases at Mars
The neutral coma gases will enter the atmosphere with a relative velocity of 56 km s-1. The kinetic energies of these molecules greatly exceeds their dissociation energies, e.g., for H2O, the kinetic energy is 293 eV, and the dissociation energy (H2O OH + H) is 5 eV (Darwent, 1970). The upper atmosphere of Mars consists of CO2, with few percent contributions from N2 and Ar, and trace amounts of several other species (Krasnopolsky, 2002). The comet gases will collide with the Mars gases, and quickly dissociate into atoms, erasing any molecular trace of the comet in the Martian atmosphere. The peak total particle and kinetic energy fluxes in Table 2 are m-2 s-1 and W m-2, respectively, comparable to the solar wind at Mars: m-2 s-1 and W m-2 for 4.4 protons cm-3 moving at 400 km s-1. Effects in the Martian atmosphere caused by the impacting comet gases are discussed by Yelle et al. (2014).
3.5. Summary
Based on the observations of Farnham et al. (in preparation) and Li et al. (in preparation), we simulated the coma and tail of comet Siding Spring for grains with radii between 10 µm and 1 cm ( g cm-3), and particle ages out to 4 years (13 AU) before closest approach to Mars. We predict no dust impacts at Mars from the close flyby of the comet in October 2014. Variations of our nominal comet model suggest a total fluence of grains m-2 is possible, with radii ranging from 1 to 3 mm, and encounter times between 19:52 and 20:17 UTC (time at Mars). Mars orbiting spacecraft are unlikely to be impacted by any large dust grains, but Mars may receive as many as grains ( kg). Following Vaubaillon et al. (2014), the meteor shower at Mars is an Earth-equivalent zenith hourly rate h-1 (assuming a human perception correction factor of 3 given our meteor size range; Koschack & Rendtel, 1990). The gas coma will reach the upper atmosphere of Mars with peak fluxes of order molecules m-2 s-1, and the molecules will be quickly dissociated, due to the high impact speeds.
References
- A’Hearn et al. (1995) A’Hearn, M. F., Millis, R. L., Schleicher, D. G., Osip, D. J., & Birch, P. V. 1995, Icarus, 118, 223
- A’Hearn et al. (2012) A’Hearn, M. F., Feaga, L. M., Keller, H. U., et al. 2012, ApJ, 758, 29
- Astropy Collaboration et al. (2013) Astropy Collaboration, Robitaille, T. P., Tollerud, E. J., et al. 2013, A&A, 558, A33
- Bodewits et al. (2014) Bodewits, D., Farnham, T., & A’Hearn, M. F. 2014, Cent. Bur. Electron. Telegrams, 3888, 1
- Bodewits et al. (2011) Bodewits, D., Villanueva, G. L., Mumma, M. J., et al. 2011, AJ, 141, 12
- Burns et al. (1979) Burns, J. A., Lamy, P. L., & Soter, S. 1979, Icarus, 40, 1
- Combi et al. (2004) Combi, M. R., Harris, W. M., & Smyth, W. H. 2004, in Comets II, ed. M. C. Festou, H. U. Keller, & H. A. Weaver (Tucson: The University of Arizona Press), 523–552
- Crifo & Rodionov (1997) Crifo, J. F., & Rodionov, A. V. 1997, Icarus, 127, 319
- Darwent (1970) Darwent, B. 1970, Bond Dissociation Energies in Simple Molecules, NSRDS-NBS (U.S. National Bureau of Standards)
- Farnocchia et al. (2014) Farnocchia, D., Chesley, S. R., Chodas, P. W., et al. 2014, ApJ, 790, 114
- Festou (1981) Festou, M. C. 1981, A&A, 95, 69
- Finson & Probstein (1968) Finson, M. L., & Probstein, R. F. 1968, ApJ, 154, 327
- Jones & Poole (2007) Jones, J., & Poole, L. M. G. 2007, MNRAS, 375, 925
- Kelley (2006) Kelley, M. S. 2006, PhD thesis, University of Minnesota, Minneapolis
- Koschack & Rendtel (1990) Koschack, R., & Rendtel, J. 1990, WGN, Journal of the International Meteor Organization, 18, 44
- Krasnopolsky (2002) Krasnopolsky, V. A. 2002, J. Geophys. Res. (Planet.), 107, 5128
- Meech & Svoren̆ (2004) Meech, K. J., & Svoren̆, J. 2004, in Comets II, ed. M. C. Festou, H. U. Keller, & H. A. Weaver (Tucson: The University of Arizona Press), 317–335
- Moorhead et al. (2014) Moorhead, A. V., Wiegert, P. A., & Cooke, W. J. 2014, Icarus, 231, 13
- Newell (2005) Newell, D. T. 2005, Mars Reconnaissance Orbiter Environments Requirement Document, Tech. Rep. D-24446, Rev G, NASA Jet Propulsion Lab.
- Tricarico et al. (2014) Tricarico, P., Samarasinha, N. H., Sykes, M. V., et al. 2014, ApJ, 787, L35
- Vaubaillon et al. (2014) Vaubaillon, J., Maquet, L., & Soja, R. 2014, MNRAS, 439, 3294
- Whipple (1951) Whipple, F. L. 1951, ApJ, 113, 464
- Whipple (1978) —. 1978, Moon and Planets, 18, 343
- Ye & Hui (2014) Ye, Q.-Z., & Hui, M.-T. 2014, ApJ, 787, 115
- Yelle et al. (2014) Yelle, R. V., Mahieux, A., Morrison, S., Vuitton, V., & Hörst, S. M. 2014, Icarus, 237, 202