Stability boundaries for massive stars in the sHR diagram
Abstract
Stability boundaries of radial pulsations in massive stars are compared with positions of variable and non-variable blue-supergiants in the spectroscopic HR (sHR) diagram (Langer & Kudritzki 2014), whose vertical axis is . Observational data indicate that variables tend to have higher than non-variables in agreement with the theoretical prediction. However, many variable blue-supergiants are found to have values of below the theoretical stability boundary; i.e., surface gravities seem to be too high by around 0.2-0.3 dex.
keywords:
stars: evolution, stars: oscillations, stars: mass loss, Hertzsprung-Russell diagramRecently, a spectroscopic HR (sHR) diagram was introduced by Langer & Kudritzki (2014). Its horizontal axis is , common to the ordinary HR diagram, while the vertical axis is (in solar units). One of the differences from the ordinary HRD is that no distance information is needed for plotting stars in the sHRD, although accurate estimates of the surface gravity are needed. Theoretically, the vertical axis is equal to (in solar units), which is affected by mass loss in the post-main-sequence evolution more sensitively than in the ordinary HRD. Because of these properties, sHRD is useful, in addition for the properties discussed by Langer & Kudritzki (2014), for comparing pulsational stability boundaries with observed positions of blue supergiants (BSG).
A massive star becomes a BSG (BSG1) after the main-sequence evolution, and evolves to the red supergiant (RSG) stage. After losing significant mass in the RSG stage, the star becomes BSG again (BSG2) (Ekström et al. 2012). Saio et al. (2013) found that radial pulsations in the BSG region are excited (by the strange mode instability) only in BSG2 but not in BSG1 (Fig. 1). Since the luminosity is not very different between BSG1 and BSG2 for a given mass, the distributions of BSG1s and BSG2s, and hence the variable and non-variable BSGs in the HR diagram are similar and mixed. In the sHRD diagram, however, the evolutionary track is affected more strongly by mass loss, and BSG2 is located significantly higher than BSG1, so that the pulsational instability region, which is governed mainly by , is separated roughly irrespective to the mass (right panel of Fig.1).
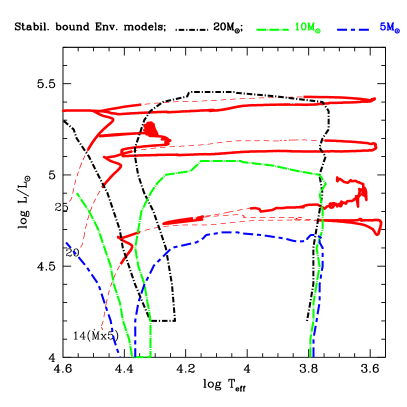
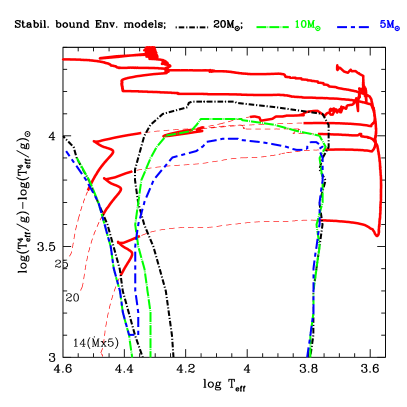
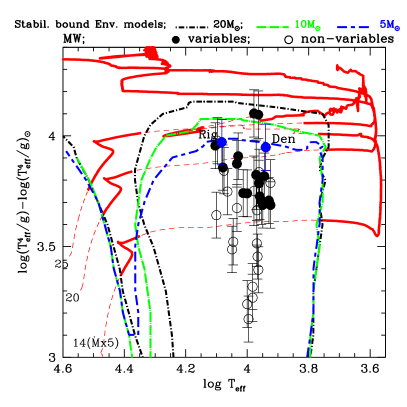
Fig. 2 compares BSGs in NGC 300 (left panel) and BSGs in the Milky Way (right panel) with theoretical stability boundaries in the sHRD. Generally, variable BSGs are located above the non-variable BSGs (with some exceptions) consistent with the theoretical prediction. However, observational non-variable/variable boundary (for MW) seems lower than the theoretical stability boundary of pulsation; i.e., observational values of seem somewhat too high. The reason for the discrepancy is not clear at present.

References
- Bresolin et al. (2004) Bresolin, F., Pietrzyński, G., Gieren, W., et al. 2004, ApJ 600, 182
- Ekström et al. (2012) Ekström, S., Georgy, C., Eggenberger, P., et al. 2012, A&A 537, A146
- Firnstein & Przybilla (2012) Firnstein, M. & Przybilla, N. 2012, A&A 543, A80
- Kudritzki et al. (2008) Kudritzki, R.-P., Urbaneja, M. A., Bresolin, F., et al. 2008, ApJ 681, 269
- Langer & Kudritzki (2014) Langer, N. & Kudritzki, R. P. 2014, A&A 564, A52
- Saio et al. (2013) Saio, H., Georgy, C., & Meynet, G. 2013, MNRAS 433, 1246