Inhomogeneous superconductors and superconducting systems, including electronic inhomogeneities Theories and models of superconducting state Effects of disorder Phase separation and segregation in nanoscale systems
Charge disorder and variations of in Zn-doped cuprate superconductors
Abstract
Impurity doping like Zn atoms in cuprates were systematically studied to provide important information on the pseudogap phase because this process substantially reduces without effect on . Despite many important results and advances, the normal phase of these superconductors is still subject of a great debate. We show that the observed Zn-doped data can be reproduced by constructing a nanoscale granular superconductor whose resistivity transition is achieved by Josephson coupling, what provides also a simple interpretation to the pseudogap phase.
pacs:
74.81.-gpacs:
74.20.-zpacs:
74.62.Enpacs:
64.75.Jk1 Introduction
The effect of non-magnetic Zn impurity doping substituting planar Cu was studied in several cuprate superconductors. It was shown that it induces a local magnetic moment in the four neighboring Cu sites by suppressing local antiferromagnetic correlation[1] acting as a stronger carrier scatterer, which causes pair breaking that substantially reduces[2] and the onset of Nernst signal .[3] On the other hand, Zn does not significantly modify the pseudogap temperature .[3, 4, 5, 6] In this paper we show that these results, even in different systems like YBa2Cu3O7-δ (YBCO) and La2-xSrxCuO4 (LASCO), are consistent with a granular superconductor formed by electronic grains.
Some years ago scanning tunneling microscopy (STM) experiments detected nanoscale spatial variations in the electronic density of states in agreement with a granular structure.[7, 8, 9, 10, 11] More recently, incommensurate electronic distributions have been measured by many different experiments. [12, 13, 14, 15, 16, 17, 18] Resonant elastic X-ray scattering (REXS) experiments in underdoped YBCO reported incommensurate scattering vectors along the Cu-O planes and a corresponding temperature dependent correlation length.[13, 14] Combined REXS and scanning tunneling microscopy (STM) on BSCCO found similar results but, with an increasing incommensurate periodicity with doping and a larger onset temperature of K.[18] Recently, TF-SR experiments have also provided evidences for an intrinsic source of electronic inhomogeneity in superconducting cuprates at temperatures much larger than .[19, 20]
To model this charge inhomogeneity we perform simulations of a nanoscale phase separation transition with an onset temperature (K used here for YBCO) slightly above the pseudogap temperature .[21, 22] A natural way to simulate an electronic phase separation is through the Cahn-Hilliard (CH) differential equation.[23, 24] Solving numerically the CH equation it is possible to follow the time evolution of a conserved order parameter that yields the local charge density distribution into nanoscale patches or puddles of low and high local density. This scenario, originally proposed to phase separation of alloys, is in agreement with the observed charge inhomogeneities mentioned above, in particular with the work of Ref. [12]. We have also shown that these patches occurs at the minima of the the free energy and are separated barriers that confine the charges, favoring the formation of ”local” Cooper pairs at low temperatures.[25] On the other hand, we compare the Zn doped effect with that of site or bond dilution ferromagnet.[26] Comparing the effect of Zn concentration with the relative decrease of the average free energy barrier between the patches, we can estimate the average effect of Zn doping in the local -wave superconducting gap, as observed before by STM for the case of Ni doping.[7] Using a simplified expression for Josephson coupling between the patches, we obtain as function of Zn concentration in good agreement with the experimental results.[3, 4, 5, 6]
2 Simulations of Charge Inhomogeneities
Following earlier indications of charge disorder in cuprates[27] and STM results on gap inhomogeneities[7] we have proposed an electronic phase separation described by the time dependent non-linear CH differential equation that breaks spatial invariance. In this way we can follow the time evolution of the local charge density as the conserved order parameter.[21, 22, 24] The simulations show the formation of isolated domains similar to a system quenched from high to low temperatures through the phase separation transition. [28] This is a technical way to study a phase segregation that leads to a nanoscale charge inhomogeneity similar to those measured earlier,[27] and also in recent experiments.[12, 13, 14, 15, 16, 17, 18, 19, 20]
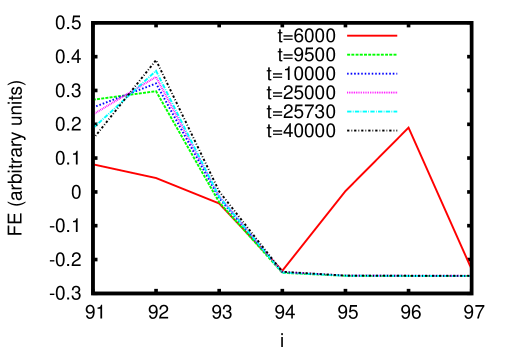
The local order parameter yields the GL free-energy and we can follow the formation of free-energy “wells” surrounded by barriers, with alternate regions of low and high density.[25, 29, 30, 31] In this segregation process the charges loose part of their kinetic energy what favors the formation of local Cooper pairs. This is the mechanism by which cuprates form electronic granular superconductors, with local pair amplitudes above without long range order.[25]
This approach was successful to relate the time of phase separation boosted by X-ray irradiation and the respective variations of in the La2CuO4-y system.[29] Here we adopt a similar approach and relate the presence of Zn concentration with the specific time of phase separation. This is done in analogy with a dilute ferromagnet which the (site or bond) dilution is related with the Curie temperature or the average coupling.[26] Then the Zn concentration is relate with the time evolution of the height of the free energy barrier between the patches or localization degree. In fact, since each Zn atom affects five Cu atoms, the one it substitutes and the four neighbors, we relate the percentage of Zn with a decrease of % of the GL free-energy barriers. The change of strength with the time evolution of a single barrier is shown in Fig.(1). A similar figure involving the time evolution of two free-energy barriers between two patches is shown in Ref. [29].
3 Calculations of Local Pairing
The electronic clustering or localization process described above provides an average hole-hole attraction.[25] This pair-potential is used in the Bogoliubov-deGennes (BdG) self-consistent calculations. Such calculations were done on simulated charge disordered systems of sites in a square lattice with a hopping integral eV. The Zn doping system is known to have an average meV from many experiments[32] and this is simulated by an attractive pair potential at of .
In the simulations, the phase separation is essentially completed with 40000 time steps and this is taken as equivalent to . As the Zn concentration increases, we assume the phase separation is diminished and we decrease the pair-potential in the same proportion, as the free energy barrier depicted in Fig.(1) diminishes. With this procedure and the BdG calculations, we obtain the -dependent . The results for zero and finite are summarized in Table.1
4 Calculations of by Phase Coherence
We now apply the formalism of a granular superconductor and the assumption that the Zn atoms weaken the -wave pair potential to calculate the variation of . At low temperatures the patches form independent SC small grains interacting with one another via Josephson coupling,[25] exactly as a granular superconductor.[33]
Detailed studies of the -wave weak links between superconductors have shown that the tunneling currents depends mainly on the maximum lobe amplitude and qualitatively resembles that of a -wave superconductor.[34, 35] Under this approximation we assume the average Josephson coupling energy between the puddles to be the simple analytical expression derived for coupling between two similar -wave superconductors [36]
| (1) |
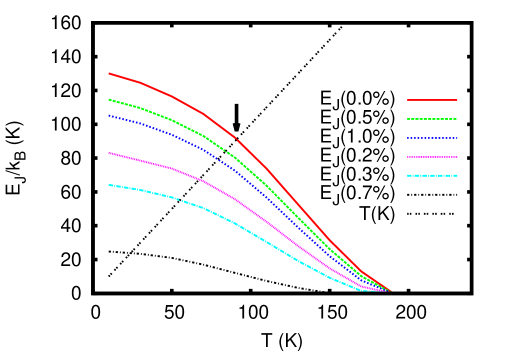
where is the average energy gap of all regions of Cooper pairing, and is the average normal resistance between neighboring patches at a temperature just above the phase coherence temperature . is proportional to the normal state in-plane resistivity just above measured in the experiments.[3, 4, 5] As explained previously, when the temperature is lowered, thermal fluctuations diminish, and long-range phase coherence is achieved when at . The Josephson coupling of Eq.(1) and are plotted in Fig.(2).
The transport properties of Zn-doped materials were studied by many groups.[1, 3, 4, 5] We take their values of and use their data of in Eq.(1). We summarize the experimental and theoretical results to optimum YBCO in Table 1.
| Zn() | Step | ||||
|---|---|---|---|---|---|
| 0 | 91 K | 7.0 | 40000 | 42.8 meV | 91.0 K |
| 0.5 | 84 K | 7.7 | 26000 | 41.5 meV | 84.0 K |
| 1.0 | 79 K | 8.0 | 25730 | 39.4 meV | 79.0 K |
| 2.0 | 67 K | 9.4 | 20000 | 36.4 meV | 67.2 K |
| 3.0 | 56 K | 11.0 | 9500 | 33.2 meV | 55.0 K |
| 7.0 | 25 K | 19.0 | 6000 | 22.0 meV | 24.0 K |
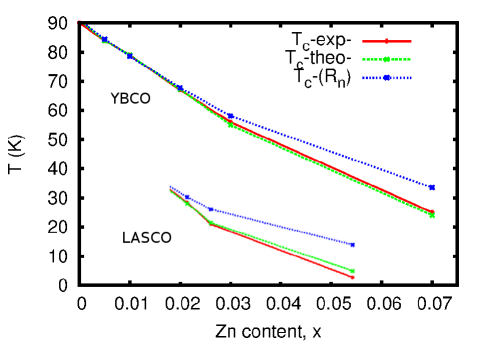
In Fig.(3) we plot our main results; the theoretical values of extracted from Eq.(1) and Fig.(2) with the experimental data listed in Table 1. We also plot a “pair-breaking” estimation, i.e., . This linear approximation works well only for . At the bottom of Fig.(2) we show results for a film of LASCO with K with experimental data from Ref. [4] and similar calculations but with K.
In our approach, the measured onset of Nernst signal[3] occurs due to the vortex motion between the patches with higher electronic density that have the larger local -wave amplitude. The Zn doping effect on is the same of that on because both depend on the superconducting properties. Concerning the behavior of , we do not have a way to calculate this temperature but, if its origin is related to the phase separation, recalling that we use only one single value of K for Zn doped optimum YBCO, it should be independent of , as it is measured[1, 3]. On the other hand, if it depends on the superconducting properties it should also decrease, like and the onset of Nernst temperature .[3, 5, 6] A more accurate way than resistivity measurements to resolve between these two possibilities is to perform TF-SR, similar to what was done on cuprate,[20] to determine if the onset of diamagnetic response depends on the Zn concentration.
5 Conclusion
We have proposed that cuprate superconductors undergo a phase separation transition that leads to the formation of incommensurate charge disorder breaking spatial invariance. In this scenario, the Fermi surface rather than being globally defined, changes on nanometer length scales, as observed in some experiments.[7, 12, 18] Contrary to current ideas of competing orders, the charge segregation transition favors the formation of local Cooper pairs and may be the origin of the superconducting state. The electronic regions of low and high density play the hole of grains in a granular superconductor on which is reached by Josephson coupling. This approach explains the STM tunneling asymmetry of cuprates,[18] and several important experiments reporting some sort of inhomogeneous responses. In particular, we show here to be a key ingredient to reproduce the Zn-doped data on different systems. In the light of the recent incommensurate charge inhomogeneities found in many different cuprate systems, our work furnishes strong evidence of this universal behavior and provides also a simple interpretation to the pseudogap phase above .
Acknowledgements.
We acknowledges partial financial aid from the Brazilian agencies FAPERJ and CNPq and CAPES.References
- [1] \NameAlloul H., Bobroff J.,Gabay M., Hirschfeld P.J. \REVIEWRev. Mod. Phys.8145(2009).
- [2] \NameBernhard C., Tallon J.L., Bucci C.,DeRenzi R., Guidi G., Williams G.V.M., Niedermayer Ch. \REVIEWPhys. Rev. Lett772304(1996).
- [3] \NameXu Z.A., Shen J.Q., Zhao S.R., Zhang Y.J., Ong C.K. \REVIEWPhys. Rev. B72144527(2005).
- [4] \NameCieplak Marta Z., et. al. \REVIEWApp. Phys. Lett.732823(1998).
- [5] \NameWalker D.J.C., Mackenzie A.P., Cooper J.R. \REVIEWPhys. Rev. B5115653(1995).
- [6] \NameAbe Y., Segawa K., Ando Y. \REVIEWPhys. Rev. B60R15055(1999).
- [7] \NameMadhavan V., Hoffman J.E., Hudson E.W., Eisaki H., Uchida S., Davis J.C. \REVIEWNature415412(2002).
- [8] \NameGomes Kenjiro K., Pasupathy Abhay N., Pushp Aakash, Ono Shimpei, Ando Yoichi, Yazdani Ali \REVIEWNature447569(2007).
- [9] \NameMcElroy K., Lee D.H., Hoffman J. E., Lang K. M, Hudson E. W., Eisaki H., Uchida S., Lee J., Davis J.C. \REVIEWPhys. Rev. Lett.94197005(2005).
- [10] \NamePasupathy Abhay N., Gomes Kenjiro K., Parker Colin V., Wen Jinsheng, Xu Zhijun, Gu Genda, Ono Shimpei, Ando Yoichi, Yazdani Ali \REVIEWScience320196(2008).
- [11] \NameKato T., Maruyama T., Okitsu S., Sakata H. \REVIEWJ. Phys. Soc. Jpn.77054710(2008).
- [12] \NameWise W. D., Boyer M. C., Chatterjee Kamalesh, Kondo Takeshi, Takeuchi T., Ikuta H., Wang Yayu Hudson E.W. \REVIEWNature Physics4696(2008).
- [13] \NameGhiringhelli G., Le Tacon M., Minola M., Blanco-Canosa S., Mazzoli C, Brookes N.B., De Luca G.M., Frano A., Hawthorn D.G., He F., Loew T., Moretti Sala M., Peets D.C., Salluzzo M., Sutarto R., Sawatzky G.A., Weschke E., Keimer B. Braicovich L. \REVIEWScience337821(2012).
- [14] \NameChang J., Blackburn E., Holmes A.T., Christensen N.B., Larsen J., Mesot J., Liang R., Bonn D.A., Hardy W.N., Watenphul A., Zimmermann M.V., Forgan E.M. Hayden S.M. \REVIEWNature Physics8871(2012).
- [15] \NameTorchinsky D.H., Mahmood F., Bollinger A.T., Boz̀ović I. Gedik N. \REVIEWNature Materials12387(2014).
- [16] \NameLe Tacon M., Bosak A., Souliou S.M., Dellea G., Loew T., Heid R., Bohnen K.P., Ghiringhelli G., Krisch K. Keimer B. \REVIEWNature Physics1052(2014).
- [17] \NameFrano A., Yee M.M., Yoshida Y., Eisaki H., Schierle E., Weschke E., Sutarto R., He F., Soumya-narayanan A., He Y., Le Tacon M., Elfimov I.S., Hoffman J.E., Sawatzky G.A., Keimer B. Damascelli A. \REVIEWScience343390(2014).
- [18] \NameAynajian P., Frano A., Comin R., Schierle E., Weschke E., Gyenis A., Wen J., Schneeloch J., Xu Z., Ono S., Gu G., Le Tacon M. Yazdani A. \REVIEWScience343393(2014).
- [19] \NameSonier J.E., Ilton M., Pacradouni V., Kaiser C.V., Sabok-Sayr S.A., Ando Y., Komiya S., Hardy W.N., Bonn D.A., Liang R. Atkinson W.A. \REVIEWPhys. Rev. Lett.101117001(2008).
- [20] \NameMahyari Z.L., Cannell A., de Mello E.V.L., Ishikado M., Eisaki H., Liang R., Bonn D.A., Hardy W.N. Sonier J.E. \REVIEWPhys. Rev. B88144504(2013).
- [21] \Namede Mello E.V.L. Caixeiro E.S. \REVIEWPhys. Rev. B70224517(2004).
- [22] \Namede Mello E.V.L., Kasal R.B. Passos C.A.C. \REVIEWJ. Phys. C.M.21235701(2009).
- [23] \NameCahn J.W. Hilliard J.E. \REVIEWJ. Chem. Phys.28258(1958).
- [24] \Namede Mello E.V.L. Silveira Filho O.T. \REVIEWPhysica A347429(2005).
- [25] \Namede Mello E.V.L. Kasal R.B. \REVIEWPhysica C47260(2012).
- [26] \NameBrooks Harris A. \REVIEWJ. Phys. C: Solid State71671(1974).
- [27] \NameSigmund E. Müller K.A. \REVIEW”Phase Separation in Cuprate Superconductors”(1993).
- [28] \NameBray A.J. \REVIEWAdv. Phys.43347(1994).
- [29] \Namede Mello E.V.L. \REVIEWEurophys. Lett.9857008(2012).
- [30] \Namede Mello E.V.L. \REVIEWEurophys. Lett.9937003(2012).
- [31] \Namede Mello E.V.L. Möckli D. \REVIEWEurophys. Lett.10217008(2013).
- [32] \NameHüfer S., Hossain M.A., Damascelli A. Sawatzky G.A. \REVIEWRep. Prog. Phys.71062501(2008).
- [33] \NameKetterson J.B. Song S.N. \REVIEW”Superconductivity”(1999).
- [34] \NameBarash Y.S., Galaktionov A.V. Zaikin A.D. \REVIEWPhys. Rev. B52665(1995).
- [35] \NameBruder C., van Otterlo A. Zimanyi G.T. \REVIEWPhys. Rev. B51R12904(1995).
- [36] \NameAmbeogakar V. Baratoff A. \REVIEWPhys. Rev. Lett.10486(1963).