Ranking the spreading influence in complex networks
Abstract
Identifying the node spreading influence in networks is an important task to optimally use the network structure and ensure the more efficient spreading in information. In this paper, by taking into account the shortest distance between a target node and the node set with the highest -core value, we present an improved method to generate the ranking list to evaluate the node spreading influence. Comparing with the epidemic process results for four real networks and the Barabási-Albert network, the parameterless method could identify the node spreading influence more accurately than the ones generated by the degree , closeness centrality, -shell and mixed degree decomposition methods. This work would be helpful for deeply understanding the node importance of a network.
keywords:
Network science , Spreading influence , K-shell decomposition.PACS:
89.75.Hc, 87.23.Ge, 05.70.Ln, ,
1 Introduction
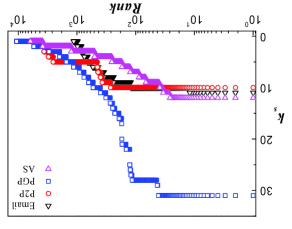
Spreading is an ubiquitous process in nature, which describes many important activities in society [1, 2, 3, 4], such as the virus spreading [5, 6], reaction diffusion processes [7, 8], pandemics [9], cascading failures [10] and so on. The knowledge of the spreading pathways through the network of interactions is crucial for developing effective methods to either hinder the disease spreading, or accelerate the information dissemination spreading. So far, a lot of works focus on identifying the most influential spreaders in a network [11, 12, 13], for example, the most connected nodes (hubs) are supposed to be the key spreaders, being responsible for the largest scale of the spreading process [14, 15, 16]. Recently, Kitsak et al. [1] argued that the node spreading influence is determined by its location in a network. By decomposing a network with the -shell decomposition method, they found that the most influential nodes, namely the network core, could be identified by the largest -core values. It should be noticed that the -shell method assigns many nodes with the the same -core value even though they perform entirely difference in the spreading process. Figure 1 shows that, for some real networks, there are lots of nodes whose -core values, denoted as , are equal. By taking into the number of removed and existed links in the decomposition process, Zeng et al. [17] proposed an improved method, named mixed degree decomposition (MDD) method, to distinguish the node spreading influence within the node set with the same value. To different networks, the optimal parameters of the MDD method are determined by the statistical properties of the networks, which hinder its application. By investigating the effects of privileged spreaders on social networks, Borge et al. [12, 13] found that the node spreading influence does not depend on their -core values, which instead determines whether or not a given node prevents the diffusion process. These literatures suggest that, besides the network core, it is also very important to generate a ranking list to identify all nodes’ spreading influences. In this paper, we argue that, for the node set with same -core values, the nodes whose locations are close to the network core have larger spreading influences. Inspired by the idea, we present an improved -shell method to generate the global influential ranking list. Comparing with the susceptible-infection-recovered (SIR) spreading process [18, 19] for four real networks and the Barabási-Albert network [20], the experimental results show that our method could generate the ranking list more accurately than the ones generated by the degree , closeness centrality(CC)[21], -shell and MDD decomposition methods respectively.
2 Method
Normally, a network with nodes and links could be described by an adjacent matrix , where if node is connected by node , and otherwise. The node degree is defined as the number of neighbors for node . The closeness centrality(CC) of node is defined as the reciprocal of the sum of the shortest distances to all other nodes of N[21].The -shell decomposition method [22, 23] could be implemented in the following way to identify the network core. Firstly, remove all nodes with degree one, and then keep pruning the existed nodes until all nodes’ degrees are larger than one. The removed nodes would form a node set whose -core value equals to one. Then, repeat the pruning process in the same way for the rest nodes. Finally, the -shell method decomposes a network into different node set with different -core values. Implementing the SIR spreading process for one network, one can find that the nodes with the same values always have different number of infected nodes, namely spreading influence. This phenomena suggests that the -shell decomposition method is not appropriate for ranking the global spreading influence of a network. In terms of the distance from a target node to the network core, the spreading influences of the nodes with the same -core values could be distinguished in the following way
| (1) |
where is the largest -core value of a network, the shortest distance is measured by the shortest distance from the node to the node , is denoted as the network core node set, and is denoted as the node set whose -core values equal to .
3 How to evaluate the performance
To check the performance of the improved method, four real networks are introduced in this paper, which include (i) Email network [24]. the Email network of University Rovira i Virgili (URV) of Spain contains faculty, researchers, technicians, managers, administrators, and graduate students. (ii) Peer-To-Peer (P2P) network [25]. A sequence of snapshots of the Gnutella peer-to-peer file sharing network from August 2002. Each node represents a host in the Gnutella network and each link represents the connection between each pair of Gnutella hosts. (iii) Pretty-Good-Privacy (PGP) network [26]. Pretty-Good-Privacy algorithm have been developed in order to maintain privacy between peers, wherefore, it is also called web of trust of PGP. (iv)Autonomous Systems (AS) network [27]. The data was collected from University of Oregon Route Views Project - Online data and reports. The network of routers comprising the Internet can be organized into sub-graphs called Autonomous Systems. Each AS exchanges traffic flows with some neighbors. The statistical properties include the number of nodes and links of the network, the average degree, the second-order average degree, and the spreading threshold are given in Table I.
| Networks | |||||
|---|---|---|---|---|---|
| 1133 | 5451 | 9.60 | 180 | 0.053 | |
| P2P | 6301 | 20778 | 7.00 | 116 | 0.060 |
| PGP | 10680 | 24316 | 4.60 | 86 | 0.053 |
| AS | 6202 | 12170 | 3.92 | 618 | 0.006 |
To evaluate the performance of the improved method, the Kendall’s tau [29, 30] is introduced to measure the accuracy of the method. By using the degree , -shell and MDD methods, we could obtain different ranking lists in terms of the network structure. In principle, the ranking lists generated by an effective structure-based ranking method should be as close as possible to the ranking list generated by the real spreading process. In this paper, we employ the SIR model [1] to simulate the spreading process on networks. In the SIR model, we denote that all nodes are initially susceptible except the only one infectious node . In each time step, the infected nodes will infect their susceptible neighbors with the spreading rate , and infected nodes would recover in two time steps [1]. The number of infections generated by the initially-infected node is denoted as its spreading influence, where is the spreading rate in the SIR model. Ranking the node spreading influence in terms of its spreading influence , one could obtain the ranking list of the SIR-model-based spreading influence. We therefore use the Kendall’s tau coefficient to measure the correlation between one topology-based ranking list and the one generated by the SIR model. The higher the Kendall’s tau value is, the more accurate result the method could generate. The most ideal case, , indicates that the method uniquely identify the real influence ranking list.
4 Numerical results
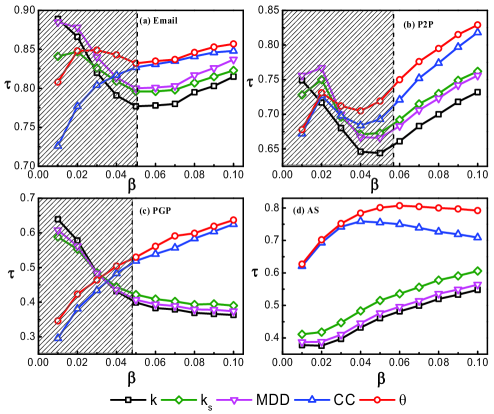
For Email, P2P, PGP, and AS networks, the Kendall’s tau values for the degree , CC, -core and MDD indices are shown in Fig. 2, from which one can find that, when the spreading rates is higher than the epidemic threshold (the dot line), the Kendall’s tau value of the improved method would be much better than the other indices. When the spreading rate is much smaller than the epidemic threshold , the SIR process would stop in a few first infection steps, therefore the node with large degree would infect more nodes, which may be the reason why the of the degree is very large when the spreading rate is much smaller than . The comparisons between the SIR model and the improved method show that the nodes who are closer to the network core have more large spreading influences, which is consistent with the main idea.
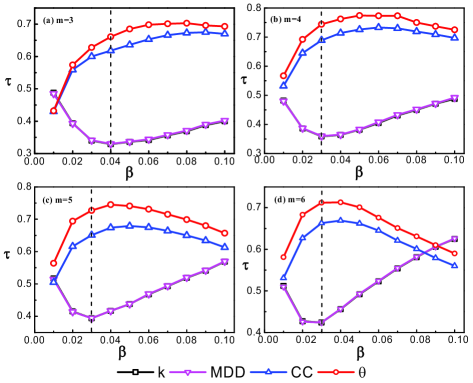
Besides the real networks, we also investigate the performance of the improved method for the Babási-Albert network [20, 31], namely BA network. In the BA network, there are nodes in initial condition. In each time step, a new node with links would connect the existed nodes according to the preferential attachment mechanism. By using the -shell decomposition method for a BA network, one can find that all nodes have the same values except the initial nodes, which indicates that the traditional -shell method could not be used to analyze this kind of networks. By implementing our improved method, one can find that the node spreading influence could be ranked more accurately than the degree and MDD methods. Figure 3 shows that the Kendall’s tau values generated by the degree and MDD methods are equal for different spreading rate for the BA networks, which indicates that the MDD method would degenerate to the degree index for the BA network. One also could find that, when the spreading rate is larger than the spreading threshold , the Kendall’s tau values would increase accordingly. It should be emphasized that when is very large, there would be a crossover for the Kendall’s tau values generated by the and the ones generated by the degree , MDD methods. The reason may be lie in the fact when the spreading rate is very large, the network core would be very easy to be infected by the nodes with largest degrees, and then the infections would be spread to the entire network very quickly.
In order to investigate the capability of the method to distinguish the spreading influences of the nodes with same -core values, we define the distinct metric as follows
| (2) |
where and denote the minimum and maximum -core values of a network. For the nodes belongs to the node set , the number of distinct elements could be used to measure the improvement of the method to the traditional -shell decomposition method. For example, for a node set whose degrees are 5,2,5, one can find that there are two distinct degree values , therefore, the number of distinct elements for equals to two. The largest value indicates that all nodes of each node set () could be identically distinguished, while the minimum value means that all nodes are assigned the same value.
Table II shows the results of the distinct for four real networks, which indicate that, comparing with the degree and MDD methods, our improved method could have much better ability of distinguishing the node spreading influences for the nodes with same value.
| Index | P2P | PGP | AS | |
|---|---|---|---|---|
| 12.27% | 2.57% | 3.76% | 3.58% | |
| MDD | 20.92% | 5.33% | 3.57% | 2.95% |
| 42.81% | 28.92% | 13.55% | 4.60% |
5 Conclusions an discussions
In summary, we propose a parameterless method to rank the node spreading influence in terms of the node distance to the network core which is defined as the node set with highest values. The -shell decomposition method could identify the most influential spreaders of a network, and also assign some nodes with the the same value regardless their characters in the spreading process. According to the SIR spreading process results, one can find that the nodes with the same value have far different spreading influences. The nodes whose locations are close to the network core play more significant role in the spreading process. Taking into account the values and the shortest distance between the target node and the network core, we propose an improved method to rank the node spreading influence. The simulation results for four real networks and the BA network show that, comparing with the SIR spreading process results, this method could identify the node spreading influence more accurately than the degree , closeness centrality, -shell and MDD decomposition methods. Our method is parameterless and only depends on the value and the distance from the target node to the network core, which is very helpful for the widely application in real systems.
Being great value to practice and theory, several methods are proposed to rank the node spreading influence. However, presented methods so far mainly focus on the node degrees or positions. We here turn to a new perspective to understand the relationship between not only the -shell location, but the nodes’ shortest distance to the network core. Up to now, although the distance-based method could shed some light on how the position and distance to the network core affect the node spreading influence, we still lack systematic comparison and understanding of the performances of these measures, which is set as our future work. Klemm et al. [2] argued that the importance of a node in a network is not uniquely determined by the system structure, but it is a result of the interplay between dynamics and network structure. Empirical analysis on more known and proposed indices as well as more dynamic models [32, 33] is very valuable for deeply understanding the spreading dynamic and building up knowledge and experience. A clear picture of this issue can be completed by putting together of many fragments from respective empirical studies. Besides the empirical results, an alternative way is to build artificial network models with controllable topological features. In this way, we could have a clear picture on the unknown and uncontrollable ingredients which are always mixed together in real networks.
acknowledgments
This work is partially supported by NSFC (91024026, 71071098 and 71171136), the Innovation Program of Shanghai Municipal Education Commission (11ZZ135, 11YZ110), JGL is supported by the Shanghai Rising-Star Program (11QA1404500) and Key Project of Chinese Ministry of Education (211057).
References
- [1] M. Kitsak, L. K. Gallos, S. Havlin, F. Liljeros, L. Muchnik, H. E. Stanley and H. A.Makse, Identification of influential spreaders in complex networks. Nature Physics 6(11) (2010) 888-893.
- [2] K.Klemm, M.Serrano, V. Eguiluz and M. Miguel, A measure of individual role in collective dynamics. Scientific reports 2 (2012) 292.
- [3] C. Castellano and R. Pastor-Satorras, Competing activation mechanisms in epidemics on networks. Scientific reports 2(2012) 371.
- [4] T. Zhou, J.-G. Liu, W.-J. Bai, G. Chen and B.-H. Wang, Behaviors of susceptible-infected epidemics on scale-free networks with identical infectivity. Physical Review E 74(5) (2006) 056109.
- [5] F. B. Cohen A Short Course on Computer Viruses. John Wiley & Sons, New York, (1994).
- [6] J. O. Kephart, G. B. Sorkin, D. M. Chess and S. R. White, Fighting computer viruses. Scientific American, 277(5) (1997) 56-61.
- [7] V. Colizza, R. Pastor-Satorras and A. Vespignani, Reaction diffusion processes and metapopulation models in heterogeneous networks. Nature Physics 3(4) (2007) 276-282.
- [8] J.-G. Liu, Z.-X. Wu and F. Wang, Opinion Spreading and Consensus Formation on Square Lattice. International Journal of Modern Physics C, 18(07) (2007) 1087-1094.
- [9] R. Pastor-Satorras and A. Vespignani, Dynamical and correlation properties of the Internet. Physical review letters 87(25) (2001) 258701.
- [10] A. E. Motter, Cascade control and defense in complex networks. Physical Review Letters 93(9) (2004) 098701.
- [11] G. Ghoshal, A. L. Barabási, Ranking stability and super-stable nodes in complex networks. Nature communications 2 (2011) 394.
- [12] J. Borge-Holthoefer and Y. Moreno, Absence of influential spreaders in rumor dynamics. Physical Review E 85(2) (2012) 026116.
- [13] J. Borge-Holthoefer, A. Rivero and Y. Moreno, Locating privileged spreaders on an online social network. Physical Review E 85(6) (2012) 066123.
- [14] R. Albert, H. Jeong and A.L. Barabási, Error and attack tolerance of complex networks. Nature 406(6794) (2000) 378-382.
- [15] R. Cohen, K. Erez, D. Ben-Avraham and S. Havlin, Breakdown of the Internet under intentional attack. Physical Review Letters 86(16) (2001) 3682-3685.
- [16] J.P. Gleeson and D.J. Cahalane, Seed size strongly affects cascades on random networks. Physical Review E 75(5) (2007) 056103.
- [17] A. Zeng and C. J. Zhang, Ranking spreaders by decomposing complex networks. Physics Letters A 377(14) (2013) 1031-1035.
- [18] A. Barrat, M. Barthlemy and A. Vespignani, Dynamical processes on complex networks. Cambridge Univ. (2008).
- [19] M. E. J. Newman, Spread of epidemic disease on networks. Physical review E 66(1) (2002) 016128.
- [20] A. L. Barabási and R. Albert, Emergence of scaling in random networks. science 286(5439) (1999) 509-512.
- [21] G. Sabidussi, The centrality index of a graph. Psychometrika 31(4) (1966) 581-603.
- [22] S. N. Dorogovtsev, A. V. Goltsev and J. F. F. Mendes, K-core organization of complex networks. Physical review letters 96(4) (2006) 040601.
- [23] S. Carmi, S. Havlin, S. Kirkpatrick, S Y. havitt and E. Shir, A model of Internet topology using k-shell decomposition. Proceedings of the National Academy of Sciences 104(27) (2007) 11150-11154.
- [24] R. Guimera, L. Danon, A. Diaz-Guilera, F. Giralt and A. Arenas, Self-similar community structure in a network of human interactions. Physical review E 68(6) (2003) 065103.
- [25] J. Leskovec, J. Kleinberg and C. Faloutsos, Graph evolution: Densification and shrinking diameters. ACM Transactions on Knowledge Discovery from Data (TKDD)1(1) (2007) 2.
- [26] M. Boguna, R. Pastor-Satorras, A. Daz-Guilera and A. Arenas, Models of social networks based on social distance attachment. Physical Review E 70(5) (2004) 056122.
- [27] J.Leskovec, J. Kleinberg and C. Faloutsos, Graphs over time: densification laws, shrinking diameters and possible explanations. Proceedings of the eleventh ACM SIGKDD international conference on Knowledge discovery in data mining. ACM (2005) 177-187.
- [28] C. Castellano and R. Pastor-Satorras, Thresholds for epidemic spreading in networks. Physical review letters 105(21) (2010) 218701.
- [29] R. B. Nelsen, Kendall tau metric. Springer, Michiel, (2001).
- [30] Let be a set of joint observations from two random variables and respectively, If one has and or and , the observations and are said to be concordant. If and or if both and , the ranks for both elements are said to be discordant. If and , the pair is neither concordant nor discordant. Then Kendall’s tau could be defined as where , , , and are the number of concordant and discordant pairs, and are the number of tied values in the th and th group of ties respectively.
- [31] R. Albert and A. L. Barabási, Statistical mechanics of complex networks. Reviews of modern physics 74(1) (2002) 47.
- [32] Y. C. Zhang, M. Blattner and Y. K. Yu, Heat conduction process on community networks as a recommendation model. Physical review letters 99(15) (2007) 154301.
- [33] J.-G. Liu, T. Zhou and Q. Guo, Information filtering via biased heat conduction. Physical Review E 84(3) (2011) 037101.