Measuring cohesion between macromolecular filaments, one pair at a time:
Depletion-induced
microtubule bundling
Abstract
In presence of non-adsorbing polymers, colloidal particles experience ubiquitous attractive interactions induced by depletion forces. Here, we measure the depletion interaction between a pair of microtubule filaments using a method that combines single filament imaging with optical trapping. By quantifying the dependence of filament cohesion on both polymer concentration and solution ionic strength, we demonstrate that the minimal model of depletion, based on the Asakura-Oosawa theory, fails to quantitatively describe the experimental data. By measuring the cohesion strength in two- and three- filament bundles we verify pairwise additivity of depletion interactions for the specific experimental conditions. The described experimental technique can be used to measure pairwise interactions between various biological or synthetic filaments and complements information extracted from bulk osmotic stress experiments.
Ranging from elastic nanopillar arrays Pokroy et al. (2009) to ropes of carbon nanotubes Vigolo et al. (2000) to dense chromatin structures Bednar et al. (1998), numerous materials of synthetic or biological origin are assembled from filamentous building blocks. The macroscopic properties of such filamentous materials are governed not only by the mechanical properties of the constituents, but also by the interactions between them. These interactions are traditionally measured using bulk osmotic stress experiments in which one applies an external pressure of known magnitude while simultaneously measuring the filament spacing using X-ray scattering Parsegian et al. (1995); Rau et al. (1984); Leneveu et al. (1976). Here we describe a complementary single-filament technique that directly measures cohesive interactions between a pair of filamentous macromolecules. This approach allows us to assemble bundles in a controlled fashion, with predetermined filament number and binding geometry, yielding information that cannot be accessed by bulk methods. It extends microscopy-based methods developed for measurement of interactions between isotropic, colloidal particles Crocker and Grier (1994); Verma et al. (1998) to the case of extreme particle anisotropy (e.g. macromolecular filaments).
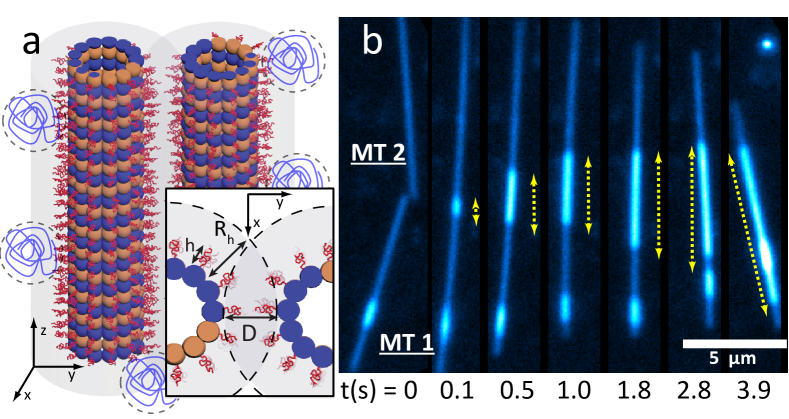
We study cohesive interactions between microtubules (MTs), cytoskeletal filaments that are assembled from tubulin heterodimers to form rigid tubular structures with an outer diameter of 25 nm, a contour length that can reach tens of microns, and a persistence length of a few millimeters Gittes et al. (1993). MTs carry significant negative charge at physiological pH van den Heuvel et al. (2007). To assemble bundles, MT filaments were placed in a suspension of non-adsorbing polymers, which induce attractive interactions by the depletion mechanism. We used either Poly(ethylene glycol) (PEG, MW=20 kDa) or Dextran (MW=500 kDa) as a depletant. The radius of gyration () of 20k PEG is 7 nm Devanand and Selser (1991), Dextran 500k has nm Senti et al. (1955). The depleting polymers were in the dilute regime for all measurements. As two MTs form a bundle, an additional free volume becomes available to polymer coils, thus increasing the overall system entropy and resulting in an effective attraction between the rods (Fig. 1(a)). Its strength and range can be tuned by changing the polymer concentration and size, respectively Asakura and Oosawa (1954). Bundle formation requires high ionic strength in order to screen the repulsive electrostatic interactions between the filaments Needleman et al. (2004).
We directly visualized multi-step formation of bundled MTs in the presence of the depleting agent (Fig. 1(b)). First, two diffusing MTs encountered each other and formed a bundle with a random overlap. Subsequently, the bundle maximized the MT overlap. To understand such a process, consider the free energy of a bundle given by , where is the cohesive free energy per unit length and is the filament overlap length. The magnitude of the retraction force is given by . Therefore, measuring the retraction force directly quantifies the depletion interaction as characterized by the cohesion energy per unit length, .
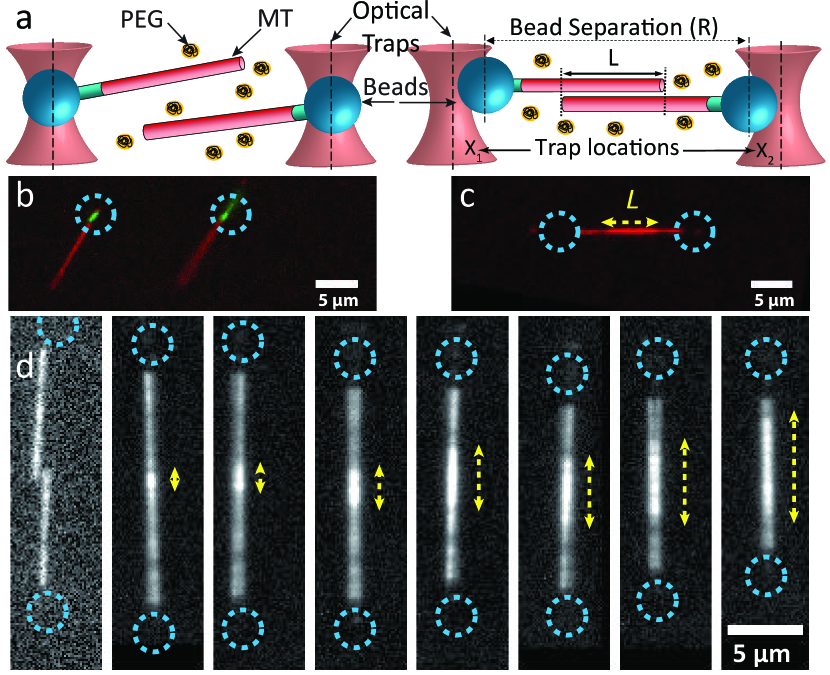
The experimental system used to directly measure and determine is illustrated in Fig. 2. Briefly, we prepared segmented MTs in which only a short portion (seed) is labeled with biotin. The biotinylated seeds and the biotin-free elongated segments of MTs were labeled with different fluorescent dyes 111See Supplemental Material for materials and methods. The entire MTs were stabilized with GMPCPP, a non-hydrolysable analog of GTP, thus ensuring that there is no dynamic instability. Optically trapped Neutravidin coated silica beads were manually attached to biotin labeled MT seeds (Fig. 2(a, b)). Subsequently, the two MTs, each attached to a single bead, were brought into close proximity to facilitate bundling 222See Supplemental Material for Supplemental Videos 1,2. Once the MT bundle formed (Fig. 2(c)), we verified that the MTs overlapped only along the biotin-free elongated segments. This ensured that Neutravidin, which desorbs from beads, did not crosslink biotinylated parts of both filaments. Our experimental setup allowed for control of the MT overlap length with nanometer accuracy (Fig. 2(d)).
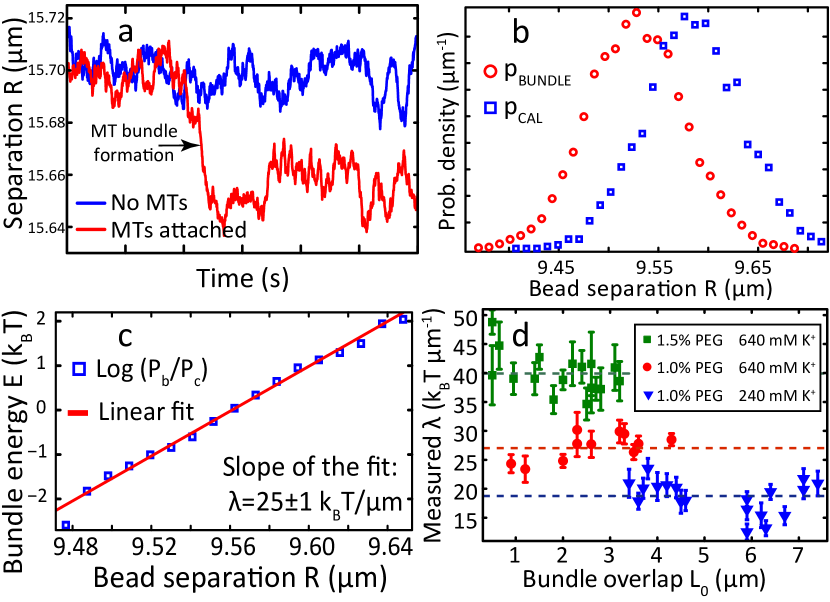
Before bundle formation, each bead with an attached MT fluctuated around the minimum of the harmonic potential imposed by the optical traps. Upon bundle formation, the average bead separation, , decreased due to the retraction force (Fig. 3(a)). While measurement of the reduction in average spacing for known trap stiffness directly yields the magnitude of the retraction force , we improved statistics by incorporating the fluctuations around the equilibrium position. Specifically, we experimentally implemented a form of umbrella sampling to measure the free energy, , of the bundle as a function of Torrie and Valleau (1977); Huang et al. (2009). As beads fluctuated in the optical traps 333Supplemental Video 3, we measured their center-to-center separation and constructed normalized probability distributions: and for the bundled and unbundled configurations, respectively (Fig. 3(b)). Both distributions had Gaussian shapes of equal width, which was determined by the stiffness of the optical traps alone. Presence of the bundle reduced the mean bead separation. Since the separation and the overlap length are simply related 444, where and are the length of the bundled filaments, the bundle free energy as a function of the overlap length, , is given by:
| (1) |
We extracted by using the measured distributions in Eq. 1. The cohesion energy per unit length is given by , which was calculated from the slope of the weighted linear fit to the experimental points (Fig. 3(c)). For example, the probability distributions depicted in Fig. 3(b) yielded T/m, which is equal to the retraction force of 0.1 pN. A single experiment samples only a small region of the bundle overlap nm) that is accessible by thermal fluctuations. To extend this range, we manually changed the overlap length and repeated the measurement. We found to be independent of the MT bundle overlap, , in agreement with our initial assumptions (Fig. 3(d)).
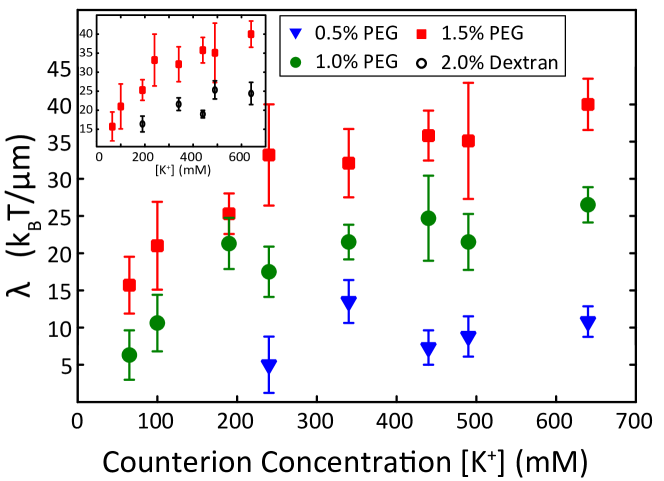
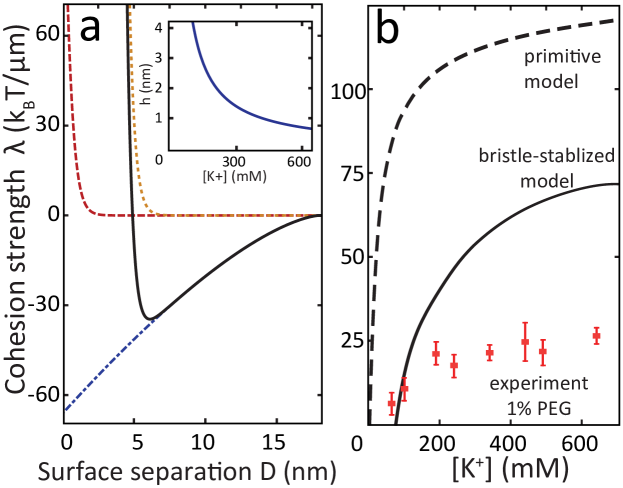
We measured how the cohesion strength depends on both the suspension ionic strength and depleting polymer concentration. For a fixed ionic strength, increased linearly with increasing polymer concentration. For a fixed polymer concentration, decreased with decreasing ionic strength (Fig. 4). These results can be qualitatively understood by considering that the cohesive potential between aligned MTs is governed by a combination of the attractive depletion interaction and electrostatic repulsion (Fig. 5(a)). In the Asakura-Oosawa (AO) model, the depletion strength depends linearly on the depletant concentration, in agreement with the experimental findings. Upon decreasing ionic strength, the range of the electrostatic repulsion increases, thus leading to decreased cohesion strength as observed in the experiments. When the ionic strength is sufficiently low, the depletion attraction is unable to overcome repulsion between the negatively charged filaments, thus suppressing bundling.
To quantitatively assess the relationship between measured MT cohesion and physical and structural features of MTs, we developed two theoretical models. In the simplest primitive model, MTs were treated as uniformly-charged, hollow cylinders of radius nm with surface charge density = -0.23 e/nm2 (-23e per tubulin dimer) van den Heuvel et al. (2007). Electrostatic repulsion was computed via the linearized Poisson-Boltzmann theory, and the depletion-induced attraction was computed by modeling polymer coils as effective hard spheres with radius Lekkerkerker and Tuinier (2011). The binding free energy predicted by the minimal-energy separation of the primitive model overestimates the measured cohesion strength by a factor of , implying an overestimation of depletion attraction and/or an underestimation of repulsions. To explore the possibility that repulsive forces generated by negatively charged, flexible ”bristle-like” c-terminal tails of tubulin Nogales et al. (1998); Tuszynski et al. (2005) contribute to this discrepancy, we developed a bristle-stabilized MT model, which includes additional salt-dependent electrostatic forces between c-terminal bristles anchored to MT surfaces (Fig 1(a, inset)). Salt-dependent longer-range repulsive forces generated by the c-terminus bristles have been implicated in previous experimental measurements of inter-MT spacing and tubulin interactions Needleman et al. (2005); Serrano et al. (1984). Here, we adopted the electrostatic brush model of Pincus et al. Tamashiro et al. (2001) to calculate the dependence of bristle height, , on the ionic strength. Treating the bristles as 13-segment chains Redeker et al. (1992) (segment size 0.5 nm) with charge e per bristle as (an approximately) flat brush of areal density of one bristle per tubulin monomer nm-2, we predicted bristle heights to vary from 2.6 nm to 4.8 nm over the range of salt concentrations measured, scaling roughly as in the high-salt limit (Fig. 5(a, inset)). We assumed uniformly stretched bristles with the bristle charge density at radial distance from the MT center given by . Electrostatic repulsion in the bristle-stabilized model was computed from the linearized-PB interaction between superposed “bare” surface charge of MTs and bristle charge density, , while depletion was treated as before, such that polymers were assumed to penetrate the bristles freely. These interactions increase filament separation by roughly twice the bristle height at the expense of decreasing depletion attractions. While calculated binding energies were closer to the experimental values, they still overestimated the measured by a factor of 2-3 (Fig. 5(b)). Comparing the primitive and bristle-stabilized model predictions suggests that the larger surface separation due to charged c-terminus bristles is fundamental to MT-MT interactions. However, in light of apparent overestimation of the polymer-induced depletion by the AO theory, a more detailed representation of polymer interactions with the MT geometry is needed to quantitatively recapitulate measured cohesion strengths.
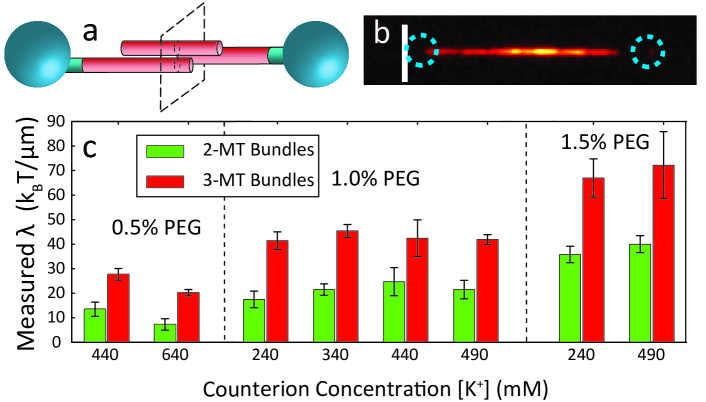
Depletion interactions between spherical colloids and polymers are pairwise additive as long as the depleting polymer is significantly smaller than the spherical colloid Meijer and Frenkel (1991, 1994). To investigate the additivity of the depletion between rod-like particles, we characterized properties of multi-filament bundles. We induced the formation of a three-MT bundle by bringing a third filament near an existing two-MT bundle. Once adsorbed, the third MT always migrated to the existing two-filament overlap region, since such configurations minimize the depletant excluded volume (Fig. 6(a, b)). The cohesion strength, , for the 3-MT bundles was consistently twice the value measured for the 2-MT bundles (Fig. 6(c)). These experiments indicate that depletion interactions with a 7 nm range are still pairwise additive for the filaments with hardcore diameters of 25 nm. The electrostatic interactions decrease the range of the depletion attraction and thus likely further reduce the importance of many-body overlap configurations.
Polymer-induced depletion interactions with nanometer range have been extensively studied between micron-sized colloidal particles Verma et al. (1998); Rudhardt et al. (1998); Sharma and Walz (1996). Here we have measured the depletion interactions in the protein limit Tuinier et al. (2000); Odijk (1996), in which the size of the non-adsorbing polymer () approaches the size of the colloidal object (MT filament diameter). We found significant discrepancies between our measurements and predictions of a simplified AO model. These were only partially reconciled by a more refined microscopic description of MT structure. To ultimately discern the source of this discrepancy, several other effects, beyond the scope of this manuscript, need to be investigated. For example, the AO model is only accurate when polymer coils are significantly smaller than colloidal particles Tuinier et al. (2000). Though the accuracy of the AO model has been studied for spherically symmetric particles, there are few equivalent studies for rod-like colloids Dogic et al. (2004). Furthermore, bending degrees of freedom are severely constrained in a bundle, corresponding to an additional entropic cost of bundling for finite-persistence length filaments. This entropy loss was important for understanding depletion-induced bundling of actin filaments Lau et al. (2009); since the bending entropy loss scales inversely with the fourth root of the bending stiffness, it could yield significant corrections even for stiff MTs. Finally, we have treated the depletant as ideal non-adsorbing polymers; excluded volume interactions could affect the magnitude of the depletion attraction Aarts et al. (2002).
In general, depletion-induced filamentous bundles can exist in two distinct states - dynamical, where the sliding friction of constituent filaments is governed by hydrodynamic interactions, and static, where solid-like friction dominates Ward et al. .Our technique measures cohesion strength for dynamical bundles, whose filaments are freely sliding with respect to each other and thus minimize the free energy on experimental timescales. For MT filaments, transition between the two regimes is governed by the concentrations of both depletant and counterions as well as by some structural modifications of tubulin (for example, removal of the c-terminus brush) Ward et al. .
In conclusion, we have developed a technique to measure attractive depletion interactions between filamentous structures, and applied it to reveal intriguing properties of the depletion-driven MT bundles. Most materials obey Hooke’s law, so that the deformation energy scales with square of the applied strain. In comparison, the free energy of MT bundles scales linearly with the applied strain, indicating that such assemblages behave as a constant force transducer with effectively zero-stiffness. Our results are relevant for biological or synthetic systems where depletion forces due to globular polymers or other non-adsorbing particles play an important role Zhou et al. (2008); Ellis (2001). They are also important in materials science, where the depletion effect is used to engineer interactions between colloids and to drive self-assembly Dogic et al. (2004); Gast et al. (1983); Ilett et al. (1995); Dinsmore et al. (1996); Sacanna et al. (2010); Barry and Dogic (2010); Sanchez et al. (2012, 2011). The methods described here can be used in studies of MT-associated motor enzymes and cross-linking proteins (MAPs) Bieling et al. (2010); Forth et al. (2014); Lansky et al. (2015) and extended to other filamentous systems and alternative interactions such as counterion-induced bundling of polyelectrolyte filaments Streichfuss et al. (2011); Bathe et al. (2008); Grønbech-Jensen et al. (1997); Ha and Liu (1997); Tang and Janmey (1996).
Acknowledgements.
FH and ZD were supported by Department of Energy, Office of Basic Energy Sciences under Award DE-SC0010432TDD. AW acquired preliminary data with support of NSF-MRI-0923057. MFH developed the theoretical model with support of NSF-CMMI-1068566 and NSF-MCB-0820492. Theoretical work of LC and GG was supported by NSF-CMMI-1068852. We also acknowledge use of MRSEC optical microscopy facility which is supported by NSF-MRSEC-0820492.References
- Pokroy et al. (2009) B. Pokroy, S. H. Kang, L. Mahadevan, and J. Aizenberg, Science 323, 237 (2009).
- Vigolo et al. (2000) B. Vigolo, A. Penicaud, C. Coulon, C. Sauder, R. Pailler, C. Journet, P. Bernier, and P. Poulin, Science 290, 1331 (2000).
- Bednar et al. (1998) J. Bednar, R. A. Horowitz, S. A. Grigoryev, L. M. Carruthers, J. C. Hansen, A. J. Koster, and C. L. Woodcock, Proc. Natl. Acad. Sci. U. S. A. 95, 14173 (1998).
- Parsegian et al. (1995) V. A. Parsegian, R. P. Rand, and D. C. Rau, Energetics of Biological Macromolecules 259, 43 (1995).
- Rau et al. (1984) D. C. Rau, B. Lee, and V. A. Parsegian, Proceedings of the National Academy of Sciences of the United States of America-Biological Sciences 81, 2621 (1984).
- Leneveu et al. (1976) D. M. Leneveu, R. P. Rand, and V. A. Parsegian, Nature 259, 601 (1976).
- Crocker and Grier (1994) J. C. Crocker and D. G. Grier, Phys. Rev. Lett. 73, 352 (1994).
- Verma et al. (1998) R. Verma, J. C. Crocker, T. C. Lubensky, and A. G. Yodh, Phys. Rev. Lett. 81, 4004 (1998).
- Gittes et al. (1993) F. Gittes, B. Mickey, J. Nettleton, and J. Howard, J. Cell Biol. 120, 923 (1993).
- van den Heuvel et al. (2007) M. G. van den Heuvel, M. P. de Graaff, S. G. Lemay, and C. Dekker, Proc. Natl. Acad. Sci. U. S. A. 104, 7770 (2007).
- Devanand and Selser (1991) K. Devanand and J. C. Selser, Macromolecules 24, 5943 (1991).
- Senti et al. (1955) F. R. Senti, N. N. Hellman, N. H. Ludwig, G. E. Babcock, R. Tobin, C. A. Glass, and B. L. Lamberts, Journal of Polymer Science 17, 527 (1955).
- Asakura and Oosawa (1954) S. Asakura and F. Oosawa, The Journal of Chemical Physics 22, 1255 (1954).
- Needleman et al. (2004) D. J. Needleman, M. A. Ojeda-Lopez, U. Raviv, K. Ewert, J. B. Jones, H. P. Miller, L. Wilson, and C. R. Safinya, Phys. Rev. Lett. 93, 198104 (2004).
- Note (1) See Supplemental Material for materials and methods.
- Note (2) See Supplemental Material for Supplemental Videos 1,2.
- Torrie and Valleau (1977) G. M. Torrie and J. P. Valleau, J. Comput. Phys. 23, 187 (1977).
- Huang et al. (2009) F. Huang, K. Addas, A. Ward, N. T. Flynn, E. Velasco, M. F. Hagan, Z. Dogic, and S. Fraden, Phys. Rev. Lett. 102, 108302 (2009).
- Note (3) Supplemental Video 3.
- Note (4) , where and are the length of the bundled filaments.
- Lekkerkerker and Tuinier (2011) H. N. W. Lekkerkerker and R. Tuinier, Colloids and the depletion interaction, Lecture notes in physics (Springer, Dordrecht ; New York, 2011) pp. xiv, 233 p.
- Nogales et al. (1998) E. Nogales, S. G. Wolf, and K. H. Downing, Nature 391, 199 (1998).
- Tuszynski et al. (2005) J. A. Tuszynski, J. A. Brown, E. Crawford, E. J. Carpenter, M. L. A. Nip, J. M. Dixon, and M. V. Sataric, Mathematical and Computer Modelling 41, 1055 (2005).
- Needleman et al. (2005) D. J. Needleman, M. A. Ojeda-Lopez, U. Raviv, K. Ewert, H. P. Miller, L. Wilson, and C. R. Safinya, Biophys. J. 89, 3410 (2005).
- Serrano et al. (1984) L. Serrano, J. de la Torre, R. B. Maccioni, and J. Avila, Proceedings of the National Academy of Sciences 81, 5989 (1984).
- Tamashiro et al. (2001) M. N. Tamashiro, E. Hernandez-Zapata, P. A. Schorr, M. Balastre, M. Tirrell, and P. Pincus, The Journal of Chemical Physics 115, 1960 (2001).
- Redeker et al. (1992) V. Redeker, R. Melki, D. Prome, J. P. Lecaer, and J. Rossier, FEBS Lett. 313, 185 (1992).
- Meijer and Frenkel (1991) E. J. Meijer and D. Frenkel, Phys. Rev. Lett. 67, 1110 (1991).
- Meijer and Frenkel (1994) E. J. Meijer and D. Frenkel, J. Chem. Phys. 100, 6873 (1994).
- Rudhardt et al. (1998) D. Rudhardt, C. Bechinger, and P. Leiderer, Phys. Rev. Lett. 81, 1330 (1998).
- Sharma and Walz (1996) A. Sharma and J. Y. Walz, Journal of the Chemical Society-Faraday Transactions 92, 4997 (1996).
- Tuinier et al. (2000) R. Tuinier, G. A. Vliegenthart, and H. N. W. Lekkerkerker, J. Chem. Phys. 113, 10768 (2000).
- Odijk (1996) T. Odijk, Macromolecules 29, 1842 (1996).
- Dogic et al. (2004) Z. Dogic, K. R. Purdy, E. Grelet, M. Adams, and S. Fraden, Phys. Rev. E 69, 051702 (2004).
- Lau et al. (2009) A. W. C. Lau, A. Prasad, and Z. Dogic, EPL (Europhysics Letters) 87, 48006 (2009).
- Aarts et al. (2002) D. Aarts, R. Tuinier, and H. N. W. Lekkerkerker, Journal of Physics-Condensed Matter 14, 7551 (2002).
- (37) A. Ward, F. Hilitski, W. Schwenger, D. Welch, A. W. C. Lau, V. Vitelli, L. Mahadevan, and Z. Dogic, Nature Materials 10.1038/NMAT4222.
- Zhou et al. (2008) H. X. Zhou, G. Rivas, and A. P. Minton, Annu Rev Biophys 37, 375 (2008).
- Ellis (2001) R. J. Ellis, Trends Biochem. Sci. 26, 597 (2001).
- Gast et al. (1983) A. P. Gast, C. K. Hall, and W. B. Russel, J. Colloid Interface Sci. 96, 251 (1983).
- Ilett et al. (1995) S. M. Ilett, A. Orrock, W. C. K. Poon, and P. N. Pusey, Physical Review E 51, 1344 (1995).
- Dinsmore et al. (1996) A. D. Dinsmore, A. G. Yodh, and D. J. Pine, Nature 383, 239 (1996).
- Sacanna et al. (2010) S. Sacanna, W. T. M. Irvine, P. M. Chaikin, and D. J. Pine, Nature 464, 575 (2010).
- Barry and Dogic (2010) E. Barry and Z. Dogic, Proc. Natl. Acad. Sci. U. S. A. 107, 10348 (2010).
- Sanchez et al. (2012) T. Sanchez, D. T. Chen, S. J. DeCamp, M. Heymann, and Z. Dogic, Nature 491, 431 (2012).
- Sanchez et al. (2011) T. Sanchez, D. Welch, D. Nicastro, and Z. Dogic, Science 333, 456 (2011).
- Bieling et al. (2010) P. Bieling, I. A. Telley, and T. Surrey, Cell 142, 420 (2010).
- Forth et al. (2014) S. Forth, K. C. Hsia, Y. Shimamoto, and T. M. Kapoor, Cell 157, 420 (2014).
- Lansky et al. (2015) Z. Lansky, M. Braun, A. L decke, M. Schlierf, P. Rein ten Wolde, M. E. Janson, and S. Diez, Cell (2015), in press, accepted.
- Streichfuss et al. (2011) M. Streichfuss, F. Erbs, K. Uhrig, R. Kurre, A. E. M. Clemen, C. H. J. Bohm, T. Haraszti, and J. P. Spatz, Nano Lett. 11, 3676 (2011).
- Bathe et al. (2008) M. Bathe, C. Heussinger, M. M. Claessens, A. R. Bausch, and E. Frey, Biophysical Journal 94, 2955 (2008).
- Grønbech-Jensen et al. (1997) N. Grønbech-Jensen, R. J. Mashl, R. F. Bruinsma, and W. M. Gelbart, Phys. Rev. Lett. 78, 2477 (1997).
- Ha and Liu (1997) B. Y. Ha and A. J. Liu, Phys. Rev. Lett. 79, 1289 (1997).
- Tang and Janmey (1996) J. X. Tang and P. A. Janmey, J. Biol. Chem. 271, 8556 (1996).