The Gas-Rich Circumbinary Disk of HR 4049.
II: A Detailed Study
of the Near-Infrared Spectrum
Abstract
HR 4049 is a peculiar evolved binary which is surrounded by a circumbinary disk. Mid-infrared observations show that the disk is rich in molecular gas and radially extended. To study the properties of this disk, we re-analyzed a set of near-infrared observations at high spectral resolution obtained with Gemini-Phoenix. These data cover absorption lines originating from the first overtone of CO and from H2O in the 2.3 m region as well as more complex emission-absorption profiles from H2O and the fundamental mode of CO near 4.6 m. By using an excitation diagram and from modeling the spectrum, we find that most of the CO overtone and H2O absorption originates from hot gas ( K) with high column densities, consistent with the mid-infrared data. The strong emission in the wavelength range of the CO fundamental furthermore suggests that there is a significant quantity of gas in the inner cavity of the disk. In addition, there is a much colder component in the line of sight to the disk. A detailed analysis of the overtone line profiles reveals variations in the line widths which are consistent with a radially extended disk in Keplerian rotation with hotter gas closer to the central star. We estimate the mass of the primary to be M☉ and discuss the implications for its evolutionary status.
Subject headings:
stars: post-AGB, stars: individual: HR 4049, circumstellar matter1. Introduction
HR 4049 (catalog ) is considered the prototype for a class of evolved binaries with peculiar properties. The effective temperatures and luminosities of the members of this class suggest that they are in the post-asymptotic giant branch (post-AGB) phase of their evolution, but their evolutionary path is thought to be severely affected by the presence of a close companion (see Van Winckel et al., 1995, for a review).
Like the other members of its class, HR 4049 shows a significant infrared (IR) excess and a time-variable optical and ultraviolet (UV) deficit (Lamers et al., 1986), which suggests the presence of a massive circumbinary disk. In addition, its photosphere shows a severe depletion in refractory elements, but it has roughly solar abundances in volatiles. This unusual depletion pattern is generally attributed to the formation of dust (incorporating refractory elements) in a circumbinary disk, followed by the re-accretion of the depleted gas onto the star (Mathis & Lamers, 1992; Waters et al., 1992).
Since the circumbinary disk plays an important role in determining the properties of HR 4049, it has been studied extensively (e.g. Waelkens et al., 1991; Dominik et al., 2003; Acke et al., 2013). While the IR excess is a clear indication of the presence of dust in a stable disk around the system, it has been difficult to determine the nature of the dust in the disk. Indeed, it is not even clear whether the dust in the disk is oxygen-rich or carbon-rich. While the IR spectrum shows the clear presence of gas that is typically associated with oxygen-rich environments (e.g. CO2, H2O, OH; Cami & Yamamura 2001; Hinkle et al. 2007; see also Malek & Cami 2014, Paper I hereafter) there is no trace of corresponding oxygen-rich dust features such as silicates or oxides. Instead, the spectral energy distribution (SED) of the disk resembles a 1150 K black body down to sub-millimeter wavelengths (Dominik et al., 2003), while also showing strong emission features due to polycyclic aromatic hydrocarbons (PAHs). This PAH emission however does not originate from the disk, but from what appear to be bipolar lobes (Acke et al., 2013).
The 1150 K black body SED can be reproduced by a “wall model”, in which the circumbinary disk is vertically extended and the dust is very optically thick, effectively producing a radiating inner wall at a temperature of K, with a scale height of 3 AU at the inner wall distance of 10 AU (Dominik et al., 2003). Because of the high opacity, the dust beyond the inner rim is cold and does not contribute to the IR excess. However, the wall model has been challenged by recent interferometric observations by Acke et al. (2013) that show a more extended distribution of material emitting strongly in the IR than the wall model can accommodate. Instead, these authors suggest emission from optically thin dust with smooth opacity profiles.
In Paper I, we present a detailed analysis of the molecular emission in the mid-IR spectrum and conclude that neither of these models is fully consistent with the properties of the molecular gas (in particular CO2, H2O and CO). Indeed, while we find that the gas originates from a radially extended disk, we also determine that it is very optically thick across most of the mid-IR. Radiative trapping by this optically thick gas then results in a warmer and more homogeneous temperature structure than previously considered for the disk.
Additional clues to the geometry and properties of the disk can be inferred from observations in the near-IR at high spectral resolution. Hinkle et al. (2007) presented such observations, examining three regions of the near-IR spectrum of HR 4049 at 2.3, 3.0 and 4.6 m. They detect many CO, OH and H2O lines and identify distinct components in the system. They propose that the absorption in the CO overtone originates from gas in Keplerian rotation along the inner rim of the disk in the wall model. Furthermore, they suggest that the gas is slowly streaming out over the edge of the wall and over the disk, causing the more complex emission-absorption line profiles in the 4.6 m region. Finally, they found evidence for a cold gas component.
Clearly, the near-IR observations contain a lot of information about the properties, geometry and kinematics of the gas disk. It is thus important to investigate whether we can reconcile these data with the disk model inferred from mid-IR observations. Therefore, we re-examine the near-IR data presented by Hinkle et al. (2007). This paper is organized as follows. In Section 2 we briefly describe the observational data. We present our analysis of the spectrum in Section 3, discuss our results in Section 4 and present our conclusions in Section 5.
2. Observations
The data we discuss in this paper are high-resolution () observations in the near-IR (m) carried out with the Phoenix spectrograph (Hinkle et al., 2003) from the National Optical Astronomy Observatory (NOAO) mounted on Gemini South. These observations primarily targeted CO fundamental and overtone lines and were described and discussed previously by Hinkle et al. (2007).
A large number of telluric lines are present in the near-IR; Fig. 1 shows an illustrative atmospheric radiance spectrum from HITRAN (Rothman et al., 2013) on the web111http://hitran.iao.ru/. Additional observations of a hot star (without stellar lines in this wavelength range) at the same airmass as HR 4049 were used to divide out these lines. This telluric correction is generally adequate; however, some residuals remain due to imperfect cancellations, especially in wavelength ranges where there are a lot of lines (e.g. near 2.319 m; see Fig. 1). In most cases though, the residuals are significantly smaller than the depth of the lines we study here. The telluric lines in the hot star spectrum were also used to achieve a very accurate wavelength calibration, with residuals of typically 0.25 km s-1. For more details about these observations or the data reduction aspects, we refer to Hinkle et al. (2007).
For each individual data segment, we then performed a heliocentric velocity correction and normalized the data to the continuum. Next, we used a weighted mean (adopting the signal-to-noise, S/N, ratios provided by Hinkle et al., 2007) to merge all the individual segments into a single, final spectrum. Finally, we rebinned the resulting spectrum onto a constant resolution wavelength grid for later comparison to our model spectra.
3. Analysis
We begin our analysis of these data with the CO overtone lines in the 2.3 m region. There are several good reasons for this. First, in this range, the spectrum reveals simple, pure absorption profiles with relatively little blending between the lines. Since they are intriniscally much weaker, these lines will furthermore have a much lower optical depth than the fundamental lines for a given column density, thus offering the best prospects to reliably determine the temperatures and column densities. Finally, since the gas in this region of the spectrum is absorbing continuum radiation, its location is constrained: it must be directly along the line of sight to the dusty disk and/or the central star; note however that the stellar continuum will only contribute 25% of the flux at this wavelength. We will then use our results from the 2.3 m range to better interpret the emission-absorption spectrum at 4.6 m.
3.1. The 2.3 m Region
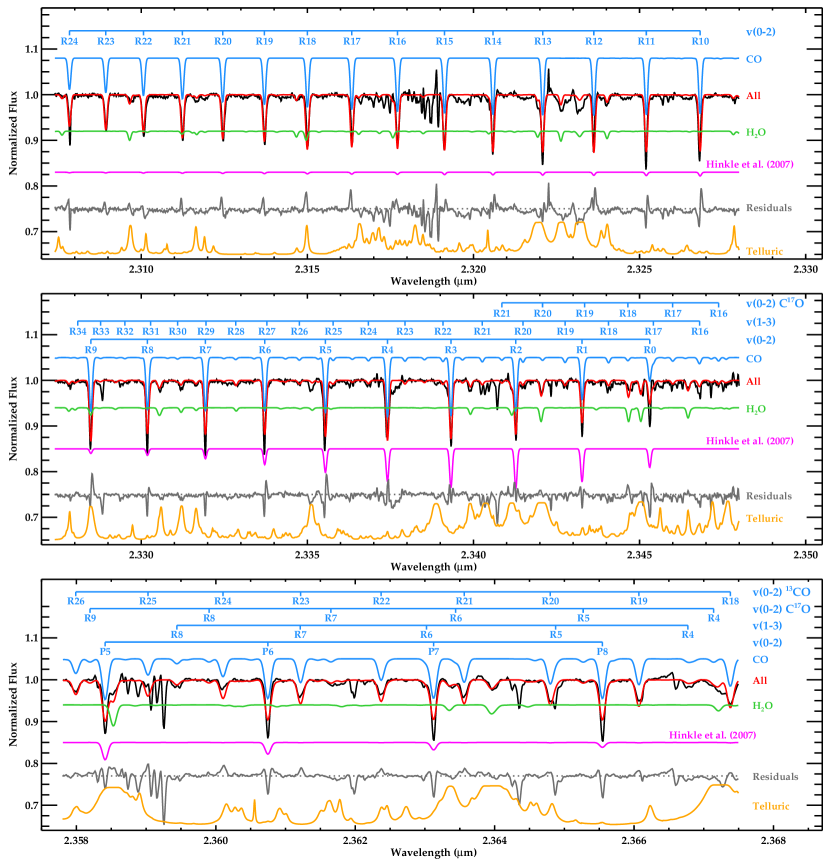
The combined spectrum of HR 4049 in the 2.3 m range is shown in Fig. 1. We remind the reader that Hinkle et al. (2007) used these data to produce an excitation diagram for CO, and found that the absorption originates from two distinct layers of CO gas in local thermodynamic equilibrium (LTE): a warm layer ( K, 1017 cm-2) and a cold one ( K, 1018 cm-2).
We first used these parameters to create a plane-parallel slab model in which 1200 K black body radiation (representing the dust) is absorbed by the warm layer of CO gas which is in turn absorbed by the cold layer of CO gas. We used the CO line list from Goorvitch (1994) and adopted a Gaussian line profile with a width of 10 km s-1. This corresponds to the measured full width at half maximum (FWHM) for the overtone lines; note that Hinkle et al. (2007) suggest 16 km s-1; however, this results in lines that are too broad (see also Sect. 3.3). When we compared this model to the observations (see Fig. 1), we found that the model reproduces neither the depths nor the relative strength ratios of the individual rovibrational lines. This discrepancy could be due to the use of a different line list; at any rate, it warrants an independent analysis.
Excitation Diagram
First, we constructed our own excitation diagram for the CO first overtone lines. We fit a Gaussian to each CO line and integrated these to determine the equivalent width (). Then we determined the population of each level using
| (1) |
where is the column density (in cm-2), is the oscillator strength for a rovibrational transition (obtained from the CO line list by Goorvitch, 1994), is the central wavelength of the transition and both and are measured in Å (Spitzer, 1978).
We present the resulting excitation diagram in Fig. 2. Qualitatively, our results are similar to those obtained by Hinkle et al. (2007), in the sense that our excitation diagram is consistent with two layers of optically thin CO in LTE—a warm and a cold one. However, we find very different values for the temperatures and column densities of the CO gas: our “hot” layer has a temperature of 970 40 K and a column density of (1.19 0.04) cm-2. The temperature we determine is nearly twice that found by Hinkle et al. (2007) and the column density is two orders of magnitude larger. For the “cold” layer, we find a temperature of 40 10 K and a column density of (6.1 0.5) cm-2. Here, the temperature and column density are relatively similar to those determined by Hinkle et al. (2007).
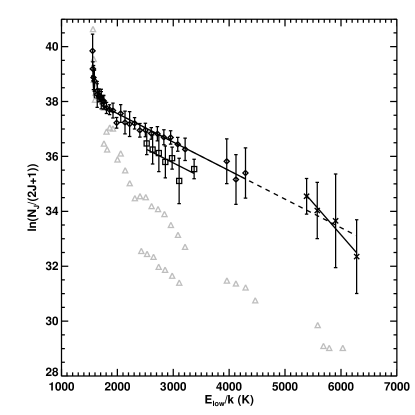
If we extrapolate the hot component to higher energies, we find that it also fits the overtone lines originating from the first vibrationally excited state (i.e. the lines) relatively well. This suggests that the CO may be in—or close to—vibrational LTE. For the 13CO lines, we find a column density of (5.5 0.6) 1018 cm-2. This yields a 12C/13C ratio of 2.1 0.9, which is a little lower the value of 6 reported by Hinkle et al. (2007).
Model Spectra
As an independent check, we modeled the CO absorption at 2.3 m using the same methods employed to build the SpectraFactory database (Cami et al., 2010). For these models, we began once again with CO line lists from Goorvitch (1994, including the 13CO, C18O and C17O isotopologues). From these, we calculated optical depth profiles assuming a population in LTE and a Gaussian intrinsic line profile with a width of 0.5 km s-1 (consistent with the value derived by Hinkle et al., 2007). Note though that since the lines are optically thin, the precise value of the intrinsic line width in our approach does not matter much as long as the line width is much smaller than a resolution element.
We tested a few different model configurations. Initially, we attempted to fit a model consisting of a single layer of LTE gas absorbing a 1200 K black body, however, we found that this model did not reproduce all of the CO absorption and found strong residuals, especially for the low lines. Thus, it seems that at least two layers of CO gas were required; this is consistent with the results from the excitation diagrams. We thus modified our model to include two layers of gas in a slab geometry absorbing a background dust continuum.
In our fit to the CO absorption, we used gas temperatures between 50 and 1000 K in increments of 100 K and column densities between 1016 and 1020 cm-2 in increments of log = 0.2 for each of the gas layers. We varied log[\isotope[12]C/\isotope[13]C] from 0 to 2; log[\isotope[16]O/\isotope[17]O] and log[\isotope[16]O/\isotope[18]O] from 0 to 3 in increments of 0.2. We also varied the radial velocity () between -30 and -40 km s-1 in increments of 1 km s-1 and smoothed our line profiles to yield lines with widths between 2 and 20 km s-1 in increments of 2 km s-1 to represent the observed line broadening (due to e.g. the rotation of material in a disk). We compared each model to the entire 2.3 m spectral region and calculated , the reduced statistic for each model.
In Table 1, we present the parameters from our best fit model and in Fig. 1, we compare this model to the spectrum. We note that this model reproduces the CO absorption very well. In addition, the resulting best-fit temperatures (50 K and 900 K) agree well with those we determined from our excitation diagram (40 K and 970 K) and also the column densities are comparable (log versus log for the cold layer and log versus log in the hot); this corresponds to a maximum optical depth of . We find a of 3.54 for our best model however, indicating significant residuals.
| Model | Excitation Diagram | |
| Gas Layer 1 | ||
| Temperature (K) | 900 50 | 970 40 |
| Log (CO) | 19.2 0.1 | 19.08 0.01 |
| Log (H2O) | 19.4 0.1 | |
| Gas Layer 2 | ||
| Temperature (K) | 50 25 | 40 10 |
| Log (CO) | 18.2 0.1 | 18.7 |
| Overall | ||
| 12CC | 1.6 | 2.1 0.9 |
| 16OO | 16 | |
| 16OO | 16 | |
| Velocity Analysis | ||
| (km s-1) | -33.0 0.5 | -32.7 0.2 |
| (km s-1) | 10 1 | 11.0 0.5 |
Note that our model does not only reproduce the ground state transitions, but also the lines (see e.g. the R18, R24 and R28 lines in Fig. 1), again suggesting that the CO gas is near vibrational LTE. Note however that the critical density for the vibrational levels of CO is cm3 (Najita et al., 1996), which is much higher than any realistic estimate of the density in this environment. However, as described in Paper I, the disk is extremely gas rich and significant radiative trapping is occurring. The gas may thus be radiatively thermalized.
3.1.1 H2O
The residual spectrum still exhibits several additional absorption features; some of these are telluric (see Fig. 1), however, others are consistent with H2O at the radial velocity of HR 4049. These features are much shallower than the CO lines which makes them much less obvious. We thus recalculated our model for this region with the addition of H2O using the line list from Partridge & Schwenke (1997, including the HO and HO isotopologues).
We began with the assumption that H2O was in the same layers as the CO (keeping the same layers reduced the number of free parameters) and varied the column density in each layer between 1016 and 1020 cm2. The best fit for these models indicated an absence of H2O in the cold molecular layer. Given the temperature of this cold layer, water may not exist in the gas phase here. Thus, we removed H2O from our cold CO layer and only included it in the hot layer. Like the hot CO, we find a high column density for H2O in this region of the spectrum (log = 19.4), but still corresponding to optically thin lines ().
3.2. The 4.6 m Region
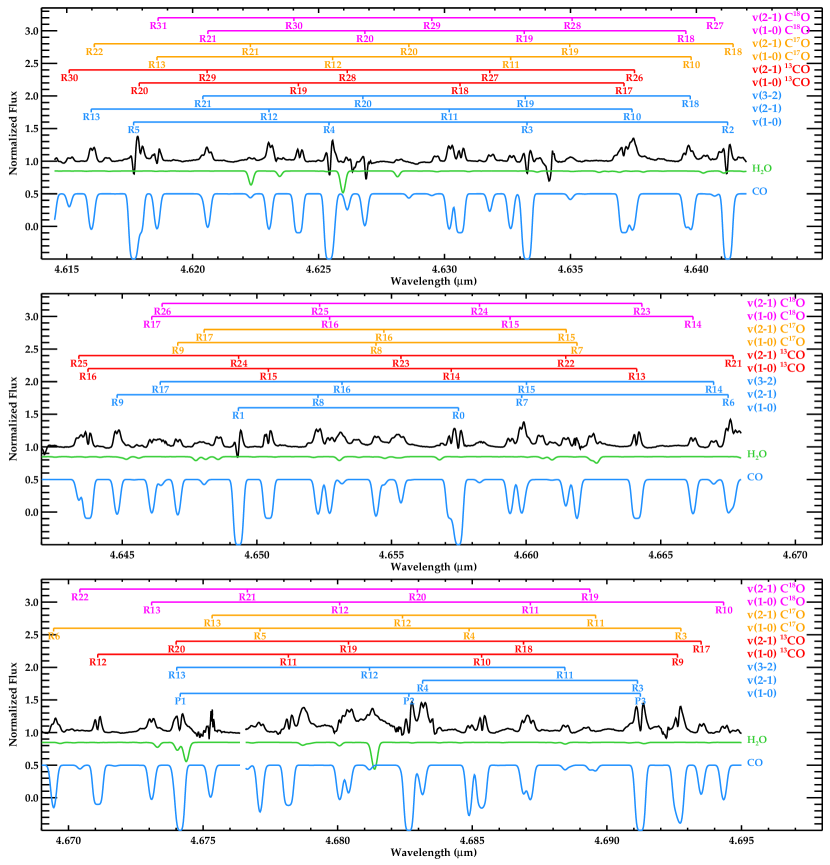
Armed with a good characterization of the absorbing gas in the 2.3 m region, we now turn our attention to the lines near 4.6 m. We show the spectrum of HR 4049 in this range in Fig. 3. In contrast to the pure absorption lines in the CO overtone region, the spectrum here is dominated by emission bands (of both CO and H2O), many of which show a superposed absorption component as well. Note that some of these absorption features are not just self-absorption of the emission lines, but actually absorb continuum radiation as well.
Such a spectrum, dominated by emission, is somewhat surprising at first sight given our results from above. The overtone lines at 2.3 m revealed the presence of a hot gas in front of the continuum emission from the star and dust disk. All other things being equal, the same gas should also produce absorption in the fundamental lines since they originate from the same (ground) state. In fact, since the fundamental lines are intrinsically 100 times stronger than the overtone lines and since the 1200 K black body dust emission is almost twice as strong at 4.6 m than it is at 2.3 m, we would expect much stronger, saturated absorption lines, as we show in Fig. 3. Using the same parameters as for the 2.3 m region, we find that in this range, both the CO and H2O lines would be very optically thick ( for CO and for H2O) and thus appear as broad, saturated lines. This is in stark contrast with the observations.
Thus, the emission must originate from gas that is not residing in the same line of sight as the gas detected in the overtone and must cover a much larger area to completely fill in the expected absorption. Hinkle et al. (2007) interpreted this in the framework of the wall model and suggested that the gas in absorption was along the inner wall of the disk, while the gas in emission originated from above the cold dust surface. However, this is not a viable explanation anymore given our current understanding of the disk from interferometric and mid-IR spectroscopic observations: the disk is radially extended, and is warm over a large radial distance (Acke et al., 2013, Paper I). Furthermore, the gas emitting in the CO fundamental must be quite warm as well, as evidenced by the high lines and the presence of and transitions.
One way to explain these observations is by considering that the line of sight that we probe at 2.3 m is such that the CO is not absorbing the dust emission, but rather the stellar continuum. Given our line depths at 2.3 m and that about 25% of the flux at those wavelengths originate from the star, this could certainly not be ruled out. The total flux we observe is then the sum of this absorbing line of sight and the total emission (gas + dust) of the disk. At the gas temperatures we determined, the gas in the disk would not emit much at 2.3 m, thus the main effect would be veiling of the absorption lines by the dust. At 4.6 m however, the starlight contributes only 5% to the continuum, so the depths of the absorption lines would be much more reduced due to veiling. At the same time, the 1000 K gas would also emit very efficiently at 4.6 m and any remaining absorption would be more easily filled in by emission from hot gas.
However, this scenario does not work. If the CO gas in the overtone lines would be absorbing only the stellar radiation, our line of sight through the disk would only probe material at a zero radial velocity since any gas motions would be perpendicular to the line of sight. A detailed analysis of the overtone line profiles (see Sect. 3.3) shows that the higher lines have much broader line profiles and thus at least a fraction of the absorption originates from gas with a significant radial velocity; thus, this gas must be absorbing non-stellar radiation.
Therefore, we must conclude that the gas in the overtone region is absorbing dust emission as well. To explain the emission in the fundamental region, there must then be a significant amount of hot gas located in lines of sight that do not intersect the dust emission. At this point, there only seem two plausible locations for that gas.
First, the gas could originate from above (and/or below) the disk mid-plane, while most of the dust providing the continuum emission would be located near the mid-plane. As noted by Dominik et al. (2003), the dust settling time for a gas-rich disk is short—typically 150 years for the case of HR 4049; thus, the dust distribution is most likely concentrated near the mid-plane. At the same time, if the disk is in hydrostatic equilibrium, the high gas temperatures imply that the disk must still have a large scale height. It is thus possible that the dust emission is predominantly originating from the mid-plane while most of the gas emission is coming from above the mid-plane. However, there must still be enough (small) dust grains mixed in with the gas at appreciable vertical distances from the mid-plane to explain the phase-dependent extinction (Waelkens et al., 1991; Acke et al., 2013). Furthermore, if the gas is being heated by the dust, the dust must be able to intercept a sufficient amount of stellar radiation, which would not be possible if all the dust is located at the mid-plane.
A second possibility is that there is hot gas located inside the dust disk, in the dust-free central cavity. Since the inner boundary of the disk is determined by the sublimation temperature of the dust and since the dissociation temperature for CO (and H2O) is much larger than the dust sublimation temperature, some gas must indeed be located inside the disk. Some support for an origin inside the disk can be found in the larger widths of the emission components compared to the absorption (by hot gas) in the overtone (see Sect. 3.3), pointing to larger velocities for the emitting component than for the absorbing gas.
Finally, we should also briefly discuss the absorption components in the emission lines. While most emission lines show some evidence for an absorption component, it is most pronounced in those lines involving the ground vibrational state. Furthermore, the low lines show the strongest absorption, including absorption of the continuum radiation. Thus, this absorption component must originate from a much cooler component (such as the cold component we observe in absorption at 2.3 m) and cannot be due to self-absorption by the gas (which would not result in continuum absorption). Since some of the absorption lines are slightly blue shifted compared to the emission component, this cold gas may be in an outflow, possibly related to the bipolar lobes.
3.3. Kinematics
We also investigate the kinematic properties of the gas. As noted in Sect. 3.1, the lines at 2.3 m appear narrower than the velocity width reported by Hinkle et al. (2007). When we fitted all the overtone lines from the ground state with Gaussians, we determined that the average full-width at half maximum velocity was km s-1 rather than their km s-1. As an additional check, we also incorporated the line width as a parameter in our full model fit which confirmed this result. Note that this also agrees with Lambert et al. (1988), who determined that the low lines were unresolved when observed with an instrumental resolution of 10 km s-1.
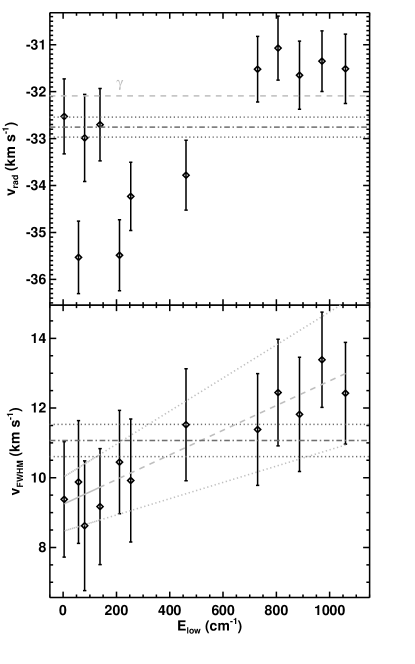
To further examine the kinematics of the gas in the disk, we fit unconstrained Gaussian profiles to only the isolated CO overtone transitions from the ground vibrational state (i.e. those that are not blended with lines from hot bands, other isotopologues or H2O lines) and examined the resulting radial velocities and line widths. We find that on average, the lines have radial velocities of -32.7 0.2 km s-1 and a range between -35.5 and -31.1 km s-1. We also find an average line width of 11.0 0.5 km s-1 and a range between 8.5 and 13.4 km s-1. Interestingly, both the radial velocity and width measurements show some clear variations as a function of the lower state energy of the lines involved (see Fig. 4).
Radial Velocities
In Fig. 4, we recover a trend previously noted by Hinkle et al. (2007, their Fig. 10, but there for the absorption component in the fundamental lines): the low lines are blue shifted compared to the higher lines which are closer to the system velocity. This was attributed to a slow outflow of gas from the system.
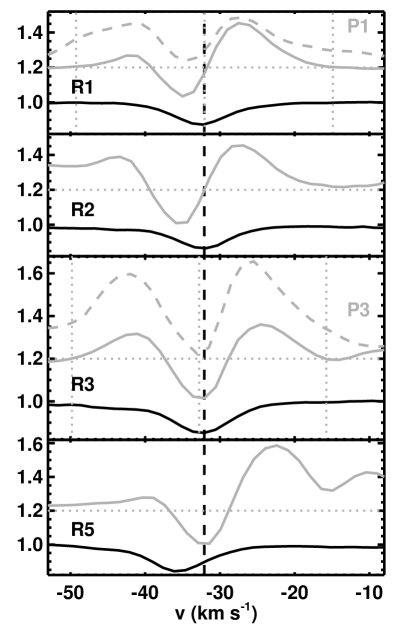
To compare both absorption characteristics, we show the profiles of the overtone and fundamental lines that exhibit absorption for lines originating from the same level in Fig. 5. Again, we selected only the lines which had relatively clean absorption profiles with as little blending as possible in both the fundamental and the overtone.
It is clear that the centers of the absorption lines do not correspond well to each other; the lines are the only ones with a clear overlap. In addition, the variations in the fundamental lines are different from the overtone: for the overtone, the low lines are at the system velocity and the largest deviations from the system velocity are found for the R5 and R10 lines; for the fundamental, it is only the lowest lines that are blue shifted.
These observations are hard to explain consistently. For instance, the absorption in the fundamental could on first sight be explained by a cold outflow from the system. Indeed, with the deepest absorption (the R2 line) originating from the level, this blue shifted gas must have . However, at such temperatures, there would still be a significant population in the state and we would expect to also see the same blue shifted absorption quite strongly in the R3 line—but this is not the case. That points to a low-density gas that is not even in rotational LTE and may be more characteristic of interstellar gas than circumstellar gas.
In the overtone lines, the case for a systematic effect is even less clear (see Fig. 4), with some low lines at the system velocity and others blue shifted. It is thus not clear whether this represents a true effect (e.g. we underestimate blending by other lines) or rather points to instrumental or calibration issues.
For completeness, we note that these shifts are only seen in the CO fundamental of the main isotopologue; there are no discernible trends in the radial velocities of the absorption components of the hot bands and other isotopologues of CO.
Line Widths
An interesting trend becomes obvious when looking at the widths of the lines as a function of the lower state energy (bottom panel of Fig. 4): overtone absorption lines originating from higher energies are broader than the lower energy lines. A linear fit yields a slope of km s-1 per cm-1. Since only hot gas can contribute to the lines at higher energies and since cold gas dominates the lower energy lines, we conclude that the hotter gas has a larger rotational velocity than the cooler gas, consistent with Keplerian motion in a disk that is hotter on the inside and cooler on the outside. Note that thermal broadening is much smaller than the effect we measure here (at K, km s-1). We will discuss this effect further below.
We also note that in Fig. 5, the emission component is clearly broader than the overtone absorption. If the broadening mechanism is rotation in a Keplerian disk and the overtone absorption begins at the interior of the dust disk, this once more suggests that the emission component originates on the interior of the dust disk.
4. Discussion
It is clear from our analysis above that the CO (and H2O) gas probed in the near-IR traces a very complex, gas-rich environment. As pointed out by Dominik et al. (2003), hydrostatic gas pressure in a gas-rich disk will not only puff up the disk in the vertical direction, but it will also act in radial direction and tend to spread out the disk. Indeed, also the near-IR observations point to such a radially extended disk, in agreement with our conclusions from the mid-IR observations in Paper I.
4.1. Dust Temperatures
As we suggest in Sect. 3.3, the gas appears to have some temperature variation in which the gas closest to the binary system is hotter than the gas further away. If the gas and dust are mixed in, then this should also be true of the dust.
If the dust were gray and in equilibrium with the stellar radiation field, the temperature in the disk would vary from 520 K to 370 K at 15 and 30 AU respectively (using a stellar temperature of 7500 K and a stellar radius of 31 R☉ as described by Acke et al., 2013) or 640 and 450 at 10 and 20 AU. The dust must be hotter than this to allow the K gas component to appear in absorption; indeed, it must be hotter than the gas for the gas to appear in absorption.
In Paper I, we suggest that the optically thick gas in the disk traps and re-radiates the stellar radiation, thus the temperatures of the gas and dust in the disk will increase significantly compared to equilibrium values and they will become more homogeneous. The question thus remains: what type of temperature distribution can the disk have while still reproducing the SED we observe in HR 4049?
As described by Dominik et al. (2003), the SED can be reproduced by the sum of equally weighted black bodies with temperatures between 880 and 1325 K. As well, when they assigned weights for the black bodies based on a power law distribution, they found that the temperatures could vary between 730 and 1238 K. In general, the maximum dust temperature possible is 1300 K.
If the inner rim of the dust component of the disk is determined by the sublimation temperature of the dust, this puts constraints on the type of dust in the disk. For instance, this excludes dust species with high dust condensation temperatures such as e.g. metallic iron or alumina. Instead, we should expect the dust to be composed primarily of dust with a sublimation temperature close to 1300 K.
4.2. The size of the gas disk
We can use our measurements to estimate the (radial) size of the gas disk. If we assume that the overtone absorption originates from gas in Keplerian rotation in the disk, the gas velocity at a distance from the center of mass is
| (2) |
where is the gravitational constant, is the total mass of the binary system (the stars are much closer to each other than the disk is to the stars so they can be treated as a point mass). Since we find of km s-1 and of km s-1, we conclude that , compatible with the results by Acke et al. (2013), who determined that the outer radius was based on their model fits to the interferometric observations and mid-IR SED.
The value for is hard to determine, but is most likely between 10 AU (Dominik et al., 2003) and 15 AU (Acke et al., 2013); this would then correspond to outer radii of and AU and disk surface areas of and AU2 respectively. The lower values compare especially well to what we determined for the CO2 gas in the mid-IR where we found an emitting area of 1300 AU2 (assuming an inclination angle of 60∘, Paper I).
Thus, the circumbinary disk of HR 4049 is a radially extended, gas-rich disk. However, it is not a flat disk. Indeed, the high temperatures of the gas ensure that hydrostatic pressure will still hold up the disk to appreciable vertical scale heights as well, but less than the that was determined by Dominik et al. (2003).
4.3. On the Mass of HR 4049
From of the disk we are able to estimate a mass of the binary system. Using an inclination angle of 60∘, we determine a deprojected of 15 4 km s-1 at the inner radius; since this is the FWHM velocity, we find a tangential velocity of km s-1 for the gas in Keplerian rotation at the inner radius. Adopting an inner radius of 15 AU, we find a total mass of M☉ for the binary. If we then apply the mass function for the primary determined by Bakker et al. (1998, = 0.158 0.004), we calculate a mass of M☉ for the primary and M☉ for the secondary. If we use an inner radius of 10 AU, we determine smaller masses for the binary and individual stars ().
The mass we find for the primary at an inner radius of 15 AU is close to the M☉ estimated by Acke et al. (2013). It is thus interesting to contemplate the implications of such a low mass for the evolution of the primary. When a star is on the red giant branch (RGB), it burns hydrogen in a shell and adds helium to the core. For a low-mass star, with a degenerate core, the temperature for helium ignition is attained when the core mass reaches 0.45 M☉. Unless part of the core was removed during the common envelope phase, this suggests that either HR 4049 never ignited helium in its core or that it had a non-degenerate core on the RGB, which can ignite helium at lower masses. However, this latter scenario would require a much higher initial mass for HR 4049, and would suggest that it has lost a great deal of material which is currently missing from the system.
When low-mass stars terminate their evolution without igniting helium in their cores, they will end their lives as helium white dwarfs. However, HR 4049 is still a giant star. This suggests that something else may be occurring in this system. Theoretical predictions show that hydrogen shell flashes occur on helium white dwarfs which have sufficient hydrogen atmospheres remaining; these flashes are also thought to return the white dwarf to giant sizes for very short periods of time (103 yr, Althaus et al., 2001). The short duration of these flashes is inconsistent with the observational history of HR 4049. Perhaps it has lost most of its envelope, but has kept enough for it to sustain a longer-term hydrogen burning shell. To our knowledge, no evolutionary models of such an object have been attempted.
5. Conclusion
Based on our new analysis and re-interpretation of near-IR high-resolution spectoscopic data of HR 4049, we find that the circumbinary disk surrounding the system is hot and radially extended, consistent with the results from the mid-IR observations described in Paper I and by the interferometry described by Acke et al. (2013). We find evidence that the fundamental CO emission originates from within the central, dust-free cavity of the disk. In the absence of dust (and thus ignoring radiation pressure), viscous dissipation will cause this gas to end up accreting onto one of the stars in the binary system. The gas in the circumbinary disk must play a significant role in determining the physical properties and geometry of the disk. Future radiative transfer modeling should elucidate these effects.
The mass of the system and the individual components are both very low and consistent with mass loss. In particular, the total mass of the system would correspond to a main sequence lifetime on the order of 10 Gyr; such an age is incompatible with the abundances of the system. Therefore, the system must have lost a considerable amount of mass during its evolution.
References
- Acke et al. (2013) Acke B., Degroote P., Lombaert R., et al., 2013, A&A 551, A76
- Althaus et al. (2001) Althaus L.G., Serenelli A.M., Benvenuto O.G., 2001, MNRAS 323, 471
- Bakker et al. (1998) Bakker E.J., Lambert D.L., Van Winckel H., et al., 1998, A&A 336, 263
- Cami et al. (2010) Cami J., van Malderen R., Markwick A.J., 2010, ApJS 187, 409
- Cami & Yamamura (2001) Cami J., Yamamura I., 2001, A&A 367, L1
- Dominik et al. (2003) Dominik C., Dullemond C.P., Cami J., van Winckel H., 2003, A&A 397, 595
- Goorvitch (1994) Goorvitch D., 1994, ApJS 95, 535
- Hinkle et al. (2003) Hinkle K.H., Blum R.D., Joyce R.R., et al., 2003, In: Guhathakurta P. (ed.), Society of Photo-Optical Instrumentation Engineers (SPIE) Conference Series, vol. 4834 of Society of Photo-Optical Instrumentation Engineers (SPIE) Conference Series, pp. 353–363
- Hinkle et al. (2007) Hinkle K.H., Brittain S.D., Lambert D.L., 2007, ApJ 664, 501
- Lambert et al. (1988) Lambert D.L., Hinkle K.H., Luck R.E., 1988, ApJ 333, 917
- Lamers et al. (1986) Lamers H.J.G.L.M., Waters L.B.F.M., Garmany C.D., Perez M.R., Waelkens C., 1986, A&A 154, L20
- Malek & Cami (2014) Malek S.E., Cami J., 2014, ApJ 780, 41
- Mathis & Lamers (1992) Mathis J.S., Lamers H.J.G.L.M., 1992, A&A 259, L39
- Najita et al. (1996) Najita J., Carr J.S., Glassgold A.E., Shu F.H., Tokunaga A.T., 1996, ApJ 462, 919
- Partridge & Schwenke (1997) Partridge H., Schwenke D., 1997, ”Journal of Chemical Physics” 106, 4618
- Rothman et al. (2013) Rothman L., Gordon I., Babikov Y., et al., 2013, Journal of Quantitative Spectroscopy and Radiative Transfer 130, 4 , {HITRAN2012} special issue
- Spitzer (1978) Spitzer L., 1978, Physical processes in the interstellar medium. New York Wiley-Interscience
- Van Winckel et al. (1995) Van Winckel H., Waelkens C., Waters L.B.F.M., 1995, A&A 293, L25
- Waelkens et al. (1991) Waelkens C., Lamers H.J.G.L.M., Waters L.B.F.M., et al., 1991, A&A 242, 433
- Waters et al. (1992) Waters L.B.F.M., Trams N.R., Waelkens C., 1992, A&A 262, L37