Combining observational techniques to constrain convection in evolved massive star models
Abstract
Recent stellar evolution computations indicate that massive stars in the range are located in the blue supergiant (BSG) region of the Hertzsprung-Russell diagram at two different stages of their life: immediately after the main sequence (MS, group 1) and during a blueward evolution after the red supergiant phase (group 2). From the observation of the pulsationnal properties of a subgroup of variable BSGs ( Cyg variables), one can deduce that these stars belongs to group 2. It is however difficult to simultaneously fit the observed surface abundances and gravity for these stars, and this allows to constrain the physical processes of chemical species transport in massive stars. We will show here that the surface abundances are extremely sensitive to the physics of convection, particularly the location of the intermediate convective shell that appears at the ignition of the hydrogen shell burning after the MS. Our results show that the use of the Ledoux criterion to determine the convective regions in the stellar models leads to a better fit of the surface abundances for Cyg variables than the Schwarzschild one.
keywords:
stars: abundances–stars: early-type–stars: evolution–stars: mass loss–stars: oscillations.1 Introduction
The post main-sequence (MS) evolution of massive stars is still poorly understood, and the prediction of the simulations with different stellar evolution codes lead to very different results (Martins & Palacios 2013), particularly due to the different way the transport mechanisms (convection, rotational mixing) are implemented. To improve our knowledge of massive stars evolution, it is thus of prime importance to find some observational tests that allow to discriminate between the various existing prescriptions for the internal transport mechanisms.
Some arguments seem to indicate that the mass-loss rates used in the stellar evolution codes during the red supergiant (RSG) phase (often, the rates by de Jager et al. 1988) could be underestimated (see the discussions in Georgy 2012; Georgy et al. 2012, as well as Vanbeveren et al. 1998). Recently, the Geneva group has released a new set of stellar models, including such an increased mass-loss rates during the RSG phase (Ekström et al. 2012; Georgy et al. 2013). These models show that for stars in the mass range , the evolution after the MS is the following: a first crossing of the Hertzsprung-Russell diagram (HRD) up to the RSG branch, and then, due to the strong mass loss during the RSG phase, a second crossing occurs, the stars ending their life in the blue side of the HRD. There is thus a double population of blue supergiant stars (BSG): the first one consists in stars immediately after the MS that are in their first crossing (group 1, see Georgy et al. 2014), and the second one consists in stars that are post-RSG stars, that are going from the red side to the blue side of the HRD (group 2).
2 Are Cyg variables group 2 stars?
The evolution in the HRD of post-MS stars in the range computed in Ekström et al. (2012) and Saio et al. (2013) occurs at roughly constant luminosity. However, a major difference between the phase where the star is in group 1 and the phase in group 2 is the current mass. Indeed, the star encounters a very strong mass loss during the RSG phase, and is thus considerably less massive once it reaches again the BSG region. For example, a rotating model with an initial mass of has a mass of when it reaches for the first time (group 1), and a mass of only when it has the same during the second crossing (group 2). This makes the luminosity-to-mass ratio bigger for group 2 stars compared to group 1, and considerably changes the pulsationnal properties of these stars.
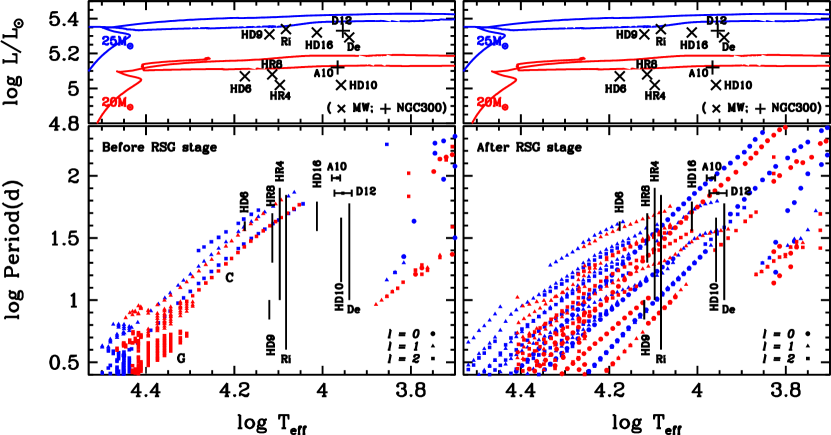
Figure 1 shows the period of the different excited modes for a group 1 model (left) and group 2 (model). These results indicate that in order to reproduce the observed period of Cyg stars, it is unavoidable to lose a lot of mass to increase the ratio. This seems to indicate that these stars are post-MS stars and belong to group 2 rather than group 1.
3 Surface abundances of group 2 stars
For at least two Cyg variables (Rigel and Deneb), some measurements of the surface abundances are available. In the following, we will focus on the N/C ratio. The observed ratio are the following (Przybilla et al. 2010): (Rigel) and (Deneb). These relatively small values indicate that the surface abundances of these stars are partially processed by the CNO cycle (the solar N/C ratio is ), but they are far from the values at the CNO equilibrium, ).
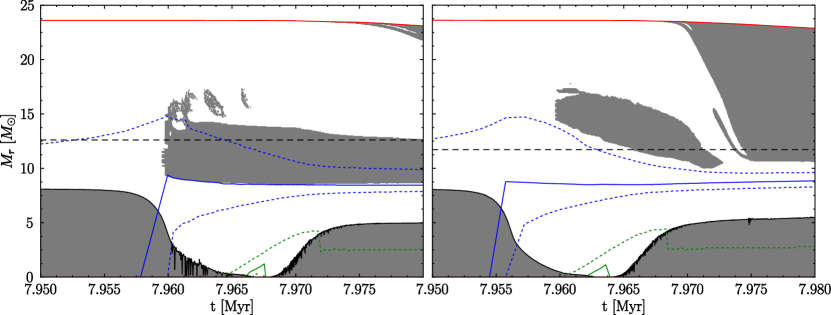
The “standard” models shown above were computed using the Schwarzschild criterion for convection (see Ekström et al. 2012, for the details of the physical processes implemented in these models). When the star becomes for the second time a BSG, and thus presents pulsation periods that are compatible with the observations of Cyg variables, the surface N/C ratio is , much more than the observed values. This is explained by looking at the Kippenhahn plot shown in Fig. 2 (left panel). At the very end of the MS, when H-burning migrates from the centre to a shell, an important intermediate convective zone appears just on top of the previous convective core, bringing towards more external layers (up to a lagrangian coordinate ) material strongly processed by CNO cycle. Due to the strong mass loss the star will encounter during the RSG phase, these layers will be uncovered when the star enter in the group 2 region of the HRD, explaining the high N/C ratio.
As our model have to go through a previous RSG phase to explain the pulsationnal properties of Cyg variables, the surface abundances of these stars tell us that something is missing in the treatment of internal mixing we used to compute these models.
4 Model with the Ledoux criterion for convection
As explained previously, the reason of the strong enrichment of the surface in our “standard” models is due to the position of the intermediate convective shell that appears at the ignition of the H-burning shell. A possible solution to this problem is thus to find a way to change the position of this convective zone. This can be achieved by changing the criterion that determines if a zone is convective or not. The Schwarzschild criterion, used in the “standard models”, does not account for the stabilising effect of the presence of a chemical composition gradient. On the other hand, the Ledoux criterion account for this effect.
We have tried to compute a model with the Ledoux criterion instead of the Schwarzschild one (Georgy et al. 2014). The corresponding Kippenhahn plot is shown in Fig. 2 (right panel). As a consequence of the Ledoux criterion, the intermediate convective shell is now shifted towards the surface compared to the “standard model” (left panel), bringing towards the external layers of the star material that is less affected by the CNO cycle. The zone in the star that will be uncovered by the mass loss during the RSG phase has a C/N ratio of , much closer to the observations than previously. In the same time, the pulsationnal properties of group 2 stars are still in good agreement with the observations.
Although the situation is improved, it is still not perfect. The surface gravity of Rigel and Deneb was also determined: (Rigel), and (Deneb, Przybilla et al. 2010). At effective temperatures corresponding to these stars, our models have and respectively. This quite big discrepancy is not solved to date, and further investigations are needed.
5 Conclusions
The main result of this work is to show how important is a good treatment of the convection in stellar evolution codes. It appeared that changing the criterion applied to determine if a zone is convective or not can drastically change the evolution of the surface properties of a stellar model. In that framework, the current development of observational technics such as asteroseismology combined with other methods (abundances measurements, …) can bring new constraints for the stellar modeling.
On the theoretical/numerical side, some efforts have also to be made in order to improve our knowledge of convection, and improve how it is implemented in the classical 1d codes. The development of multi-d hydro-simulations of convection (see e.g. Meakin & Arnett 2007; Viallet et al. 2013) is an obvious step in that direction, and will probably lead to decisive changes in the way convection is treated in the numerical codes.
References
- Bresolin et al. (2004) Bresolin, F., Pietrzyński, G., Gieren, W., et al. 2004, ApJ 600, 182
- de Jager et al. (1988) de Jager, C., Nieuwenhuijzen, H., & van der Hucht, K. A. 1988, A&AS 72, 259
- Ekström et al. (2012) Ekström, S., Georgy, C., Eggenberger, P., et al. 2012, A&A 537, A146
- Firnstein & Przybilla (2012) Firnstein, M. & Przybilla, N. 2012, A&A 543, A80
- Fraser et al. (2010) Fraser, M., Dufton, P. L., Hunter, I., & Ryans, R. S. I. 2010, MNRAS 404, 1306
- Georgy (2012) Georgy, C. 2012, A&A 538, L8
- Georgy et al. (2013) Georgy, C., Ekström, S., Eggenberger, P., et al. 2013, A&A 558, A103
- Georgy et al. (2012) Georgy, C., Ekström, S., Meynet, G., et al. 2012, A&A 542, A29
- Georgy et al. (2014) Georgy, C., Saio, H., & Meynet, G. 2014, MNRAS 439, L6
- Kaltcheva & Scorcio (2010) Kaltcheva, N. & Scorcio, M. 2010, A&A 514, A59
- Kaufer et al. (1997) Kaufer, A., Stahl, O., Wolf, B., et al. 1997, A&A 320, 273
- Kaufer et al. (1996) Kaufer, A., Stahl, O., Wolf, B., et al. 1996, A&A 305, 887
- Kudritzki et al. (2008) Kudritzki, R.-P., Urbaneja, M. A., Bresolin, F., et al. 2008, ApJ 681, 269
- Leitherer & Wolf (1984) Leitherer, C. & Wolf, B. 1984, A&A 132, 151
- Markova & Puls (2008) Markova, N. & Puls, J. 2008, A&A 478, 823
- Martins & Palacios (2013) Martins, F. & Palacios, A. 2013, A&A 560, A16
- Meakin & Arnett (2007) Meakin, C. A. & Arnett, D. 2007, ApJ 667, 448
- Moravveji et al. (2012) Moravveji, E., Guinan, E. F., Shultz, M., Williamson, M. H., & Moya, A. 2012, ApJ 747, 108
- Percy et al. (2008) Percy, J. R., Palaniappan, R., Seneviratne, R., Adelman, S. J., & Markova, N. 2008, PASP 120, 311
- Przybilla et al. (2010) Przybilla, N., Firnstein, M., Nieva, M. F., Meynet, G., & Maeder, A. 2010, A&A 517, A38+
- Richardson et al. (2011) Richardson, N. D., Morrison, N. D., Kryukova, E. E., & Adelman, S. J. 2011, AJ 141, 17
- Saio et al. (2013) Saio, H., Georgy, C., & Meynet, G. 2013, MNRAS 433, 1246
- Schiller & Przybilla (2008) Schiller, F. & Przybilla, N. 2008, A&A 479, 849
- Sterken (1977) Sterken, C. 1977, A&A 57, 361
- Sterken et al. (1999) Sterken, C., Arentoft, T., Duerbeck, H. W., & Brogt, E. 1999, A&A 349, 532
- van Leeuwen et al. (1998) van Leeuwen, F., van Genderen, A. M., & Zegelaar, I. 1998, A&AS 128, 117
- Vanbeveren et al. (1998) Vanbeveren, D., De Donder, E., van Bever, J., van Rensbergen, W., & De Loore, C. 1998, New A 3, 443
- Viallet et al. (2013) Viallet, M., Meakin, C., Arnett, D., & Mocák, M. 2013, ApJ 769, 1
NoelsComment: In models computed with the Schwarzschild criterion, the layers in the -gradient region become convective while they should be semi-convective. This would lower the efficiency of the mixing and would lower the ratios N/C and N/O.
NoelsWhat would happen to the ratio if no intermediate convective zone at all is present? It would still be possible to affect the N/C and N/O ratios if mass loss in the RSG phase is large enough to uncover the layers where CNO cycle has affected the CNO abundances already in the early phases of the main sequence.
GeorgyIt has to be checked. As the mass loss uncover quite deep layers, it probably shows some material affected at least partially by CNO cycle. This could be easily checked from the structure at the end of the MS, before the intermediate convective zone develops.
MoravvejiWhere does all lost hydrogen rich envelope go during the RSG phase? Do we have observations for that?
GeorgySome indirect observations of interactions with a dense circumstellar shell exist. For example, type IIn supernovae, or the presence of ring nebulae around Wolf-Rayet stars.
PrzibillaHow do the lifetimes of blue supergiants on the first crossing of the HRD to the red and those of the second crossing towards the blue compare?
GeorgyIt is extremely dependent on the stellar model (e.g. rotation or not) and can change from 10%-90%. So far, it seems to be difficult to assess firm statistics on that point.