The Interlayer Shear Modes in Twisted Multi-layer Graphenes: Interlayer coupling, Davydov Splitting and Intensity Resonance
Abstract
Graphene and other two-dimensional crystals can be combined to form various hybrids and heterostructures, creating materials on demand, in which the interlayer coupling at the interface leads to modified physical properties as compared to their constituents. Here, by measuring Raman spectra of shear modes, we probe the coupling at the interface between two artificially-stacked few-layer graphenes rotated with respect to each other. The strength of interlayer coupling between the two interface layers is found to be only 20% of that between Bernal-stacked layers. Nevertheless, this weak coupling manifests itself in a Davydov splitting of the shear mode frequencies in systems consisting of two equivalent graphene multilayers, and in the intensity enhancement of shear modes due to the optical resonance with several optically allowed electronic transitions between conduction and valence bands in the band structures. This study paves way for fundamental understanding into the interface coupling of two-dimensional hybrids and heterostructures.
Monolayer graphene (1LG) has a high carrier mobility and optical transparency, in addition to being flexible, robust and environmentally stableGeim ; Bonaccorso . Twisted bilayer graphene (t2LG) can be formed by stacking two 1LGs that are rotated with respect to each otherDos Santos ; Kim ; Reina . In t2LGs, novel physical properties arise due to the periodically modulated interaction between the two Dirac electron gases with a large moiré supercell. Despite this modulation, a Dirac-like linear dispersion with a lower Fermi velocity than in 1LG is presentDos Santos ; Ni ; Trambly . Moreover, the twist angle () between the layers can be used to tune the system properties such as optical absorptionMoon . The t2LG have parallel electronic bands across the Fermi level and the energy of the corresponding van Hove singularities (VHS) depends on .Li This is significantly different from the band structure of Bernal-stacked bilayer graphene (2LG) with a parabolic dispersion and parallel bands only within either valence or conductance bands.
In few-layer graphene (FLG), the band structure is distinct for each number of layersKoshino . This can be exploited both for studying fundamental physics and device applicationsZhu ; Ye ; Huang . By artificially assembling together -layer graphene (LG, ) and -layer graphene (LG, ), a ()-layer graphene system [tLG] can be formed. In this notation, the previously reported t2LGDos Santos ; Ni can be denoted as t(1+1)LG. The LG and LG can be twisted by an angle with respect to each other. The tunability of t()LG that arises from the number of layers and could lead to novel applications for these materials. The understanding of the fundamental physical properties, such as the strength of interlayer coupling between the two interface layers of LG and LG in LGs, and its impact on the electronic band structure and lattice dynamics, however, is crucial to achieve this goal.
As one of the most useful and versatile characterization tools, Raman spectroscopy has been widely used to probe the physical properties, such as phonons, electron-phonon interaction and band structure, in graphene and related materialsFerrari ; Jorio ; Ferrari2 . The first-order G band, arising from the emission of an in-plane optical phonon, can be easily observed around 1580 cm-1 in 1LG, 2LG, FLG and bulk graphiteFerrari2 . The shear (C) mode present in FLGsSaha ; Tan ; Tsurumi , and its low energy makes it sensitive to quasiparticles close to the Dirac pointTan . However, it is usually not observed in typical experiments due to its weak intensity and low frequency (below 45 cm-1). There are shear vibrational modes in LG(1). In contrast to other two dimensional materials such as MoS2Zhang and WSe2Zhao , only the highest-frequency shear mode has been observed in Bernal-stacked FLGs.Tan ; Tsurumi Due to the significantly weaker electron-phonon coupling, the detection of the other shear modes in Bernal-stacked FLG is challenging Tan . Assembling 2D materials to form heterostructures and combined materials changes their symmetry, the lattice dynamics and electronic properties of the system. Raman spectroscopy of the shear modes provides a direct measurement of the interlayer coupling,Tan offering information on the electronic and phonon properties of the system, as well as on their interplay. Thus, successfully probing the interlayer coupling in LGs via the C mode is a basic step to exploit physical properties of various combinations of two-dimensional materials.
Here, we study the C modes of tLGs formed by twisting LG and LG with respect to each other to different angles. At a specific laser energy that depends on , C modes arising from the and shear modes of the constituent FLGs are observed. The coupling between the graphene layers at the twisted interface is found to be about five times weaker than interlayer coupling in Bernal-stacked FLGs, and also the coupling to the layers adjacent to the interface is softened. The out-of-phase and in-phase vibrations of the two twisted, equivalent subsystems result in a Davydov splitting of 2 cm-1 between bilayer C modes in t(2+2)LG. The C mode intensity enhancement in the t()LG is shown to be due to an energy resonance between several VHSs of the joint density of states of all optically allowed transitions and laser excitations during the optical absorption and emission, confirmed by detailed theoretical calculations on the band structure of a t(1+3)LG. The VHSs contribute to different extent to the resonant profiles, which is a signal of varying electron-phonon coupling to different Raman bands.
Results
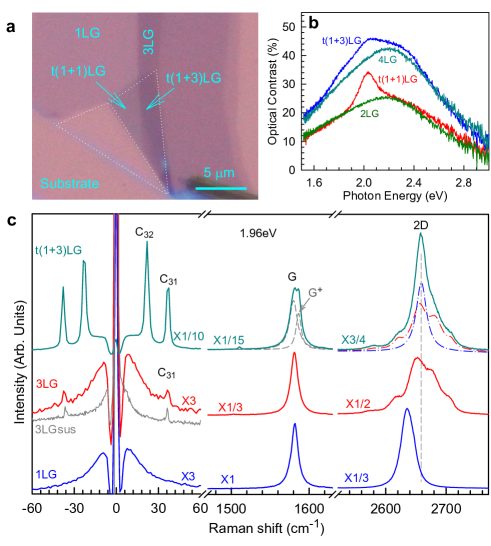
We have investigated Raman spectra of several tLGs by various laser excitations. First, we focus on a typical graphene flake containing a 1LG, a trilayer graphene (3LG), a t(1+1)LG region and a t(1+3)LG region, the t(1+3)LG [t(1+1)LG] being formed by accidentally folding 1LG onto 3LG [1LG] during the mechanical exfoliation [see Fig. 1(a)]. The optical contrasts of t(1+1)LG and t(1+3)LG in Fig. 1(b) are, respectively, different from those of 2LG and 4LG. An additional feature appears at around 2.0eV for both t(1+1)LG and t(1+3)LG, revealing that the band structure of twisted few-layer graphene is modified after twisting in comparison to Bernal-stacked graphene layers.Havener ; Wang
Fig. 1(c) shows the Raman spectra of the flakes in the spectral ranges of the C, G and 2D bands, excited with the laser energy () 1.96 eV. All Raman spectra are normalized to the G intensity [I(G)] of 1LG. The 2D band of t(1+3)LG can be well fitted using the peak profiles of the 1LG and 3LG 2D bands, as indicated by the dashed-dotted lines in Fig. 1(c). The fitted 1LG-like and 3LG-like sub-peaks for t(1+3)LG are blueshifted by 24 and 5 cm-1 relative to the ones in 1LG and 3LG, respectively. The blueshifts are attributed to the decrease of Fermi velocity in t(1+3)LGTrambly ; Ni , agreeing well with the previous results on t(1+1)LGNi ; Kim2 . This is a second indication that the 1LG and 3LG couple with each other after the formation of t(1+3)LG, modifying the band structure. The G band of t(1+3)LG is much stronger than that of 1LG and 3LG, suggesting a resonant enhancement of I(G) at the excitation energy () of 1.96 eV. A similar enhancement has been observed in t(1+1)LG Havener ; Kim2 . However, in t(1+3)LG, the G peak exhibits a broader profile with a high frequency shoulder in comparison to the one reported for t(1+1)LG Havener ; Kim2 and in 3LG Tan . We call this shoulder the peak.
In the low-energy region, the shear mode of the SiO2-supported 3LG is observed at 37 cm-1, with a worse signal-to-noise ratio than that of suspended 3LG (3LGsus) due to the strong background from the Si substrate.Tan The t(1+3)LG contains four graphene layers. In Bernal-stacked 4LG, three C modes are expected at 41, 31 and 17 cm-1.Tan We use Clk to denote the C mode of LG, with increasing with a decreasing mode frequency. Thus, the 4LG C modes are denoted as C41 (41 cm-1), C42 (31 cm-1) and C43 (17 cm-1). However, only two ultralow-frequency modes at 22 cm-1 and 37 cm-1 are observed in t(1+3)LG, confirmed by the presence of their anti-Stokes components. Their frequencies agree with the frequencies of the two 3LG C modes predicted by a linear chain modelTan . This suggests that the observed modes are related to C32 and C31 of the 3LG constituent in t(1+3)LG, respectively. C32 and C31 in t(1+3)LG are strongly enhanced with the intensity almost equal to I(G). The enhancement of the C and G peaks is a further indication of the coupling between 1LG and 3LG after twisting creates a heterostructure with properties, such as the band structure, that are distinct from its constituents.
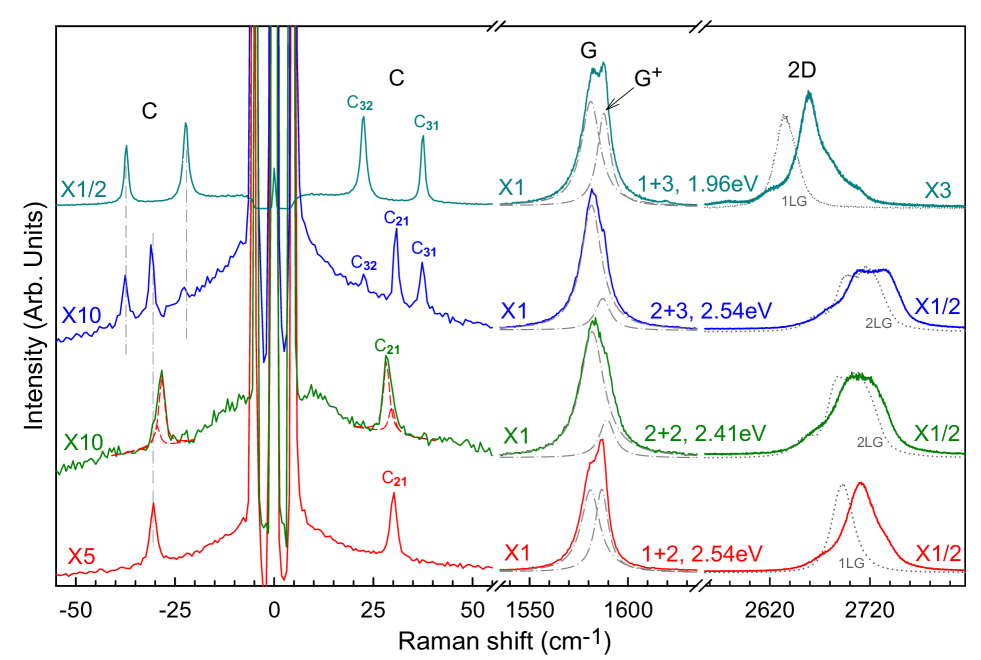
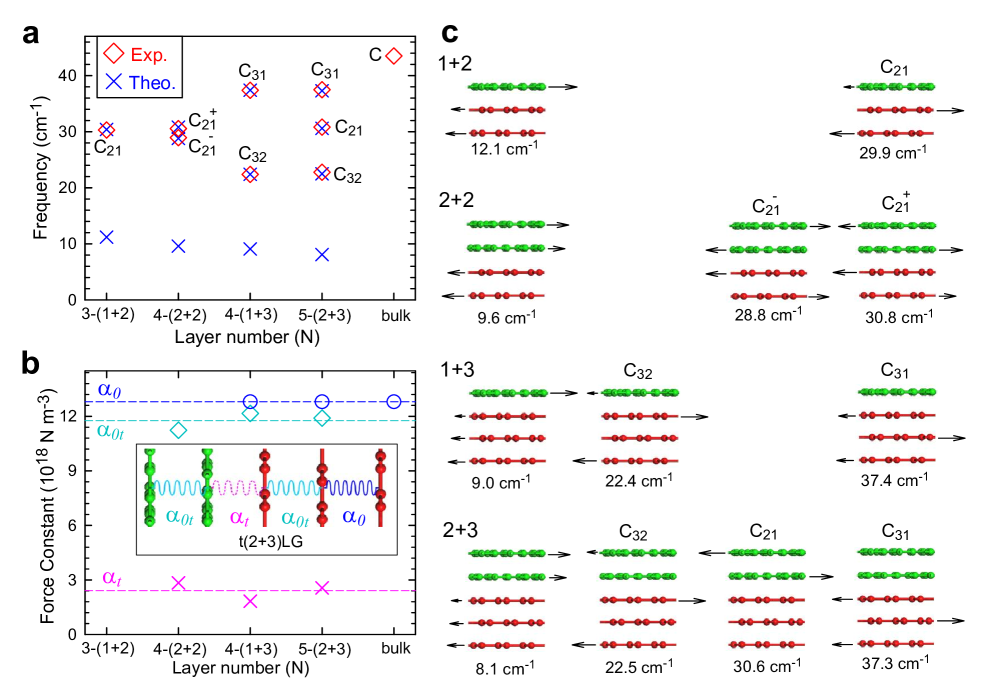
The observation of C31 and C32 in t(1+3)LG also shows that the weaker coupling between 1LG and 3LG in t(1+3)LG makes its lattice dynamics different from the Bernal-stacked 4LG. This is also true for other t()LGs. Fig. 2 shows the Stokes (S) and anti-Stokes (AS) spectra at the C region and Stokes spectra at G and 2D spectral regions for four t()LGs with =1 or 2 and =2 or 3 (See Supplementary Fig.1 for optical images). To facilitate comparison, all spectra are normalized to their respective I(G). The 2D bands of all t()LGs blue-shift relative to the 1LG or 2LG ones measured under the same conditions due to the coupling, similar to the case of t(1+1)LG reported in the literatureNi . Only one mode located at 30 cm-1 is observed for the t(1+2)LG with its frequency close to the C mode of the 2LG constituent, C21. In contrast, t(2+2)LG exhibits a broad and asymmetrical peak. It can be fitted using two Lorentzian peaks at 28.9 cm-1 and 30.6 cm-1, denoted as C and C, respectively. In t(2+3)LG, besides the two C modes of its 3LG constituent, an additional mode at 30.8 cm-1 related to its 2LG constituent is present. In t(1+3)LG, as shown in Fig. 1 and discussed above, two C modes related to its 3LG constituent are observed. In short, C modes are observed in a t()LG for specific excitation energies, instead of C modes expected in Bernal-stacked ()LGs. The observed modes are related to the C modes of the constituent LG (if 1) and LG (1). The frequencies of all C modes shown in Fig. 2 are summarized in Fig. 3(a) using open diamonds.
Similar to t(1+3)LG, a double peak structure in the G band with an additional G+ peak is observed for all t()LGs, as revealed by the Lorentzian fits shown in Fig. 2. The G+ peak is observed neither in Bernal-stacked 1LG, 3LG, 4LG nor t(1+1)G. Thus, the G+ mode in t()LG must arise from the multilayered constituents and their interaction. The G peak position is expected to be sensitive to the layer number of FLGSaha ; Wang2 , which is in contrast to the experimental resultTan . Here, the observed G+ position in t()LGs is 6-7 cm-1 higher than the corresponding G peak, also independent on the layer number. This value is identical to that between Raman-active E and infrared-active E1u modes in bulk graphite. Therefore, we prefer to attribute the G+ peak in t()LGs to the zone-center infrared-active Eu or modes in their 2LG and 3LG constituents.
To understand the interlayer coupling in t()LG, an improved linear chain model is introduced. The frequencies (in cm-1) and displacement patterns of the shear modes in t()LG can be calculated by solving linear homogeneous equations as follows,Born
| (1) |
where is the phonon eigenvector of the mode with a frequency , =7.610-27 kg the monolayer mass per unit area, the speed of light in cm s-1, and the shear part of the force constant matrix (for details, see Supplementary Note 1). Here, only nearest-neighbor interlayer interaction is assumed.Tan The force constant per unit area between bulk layers away from the interface is given by . In FLGs, this interlayer force constant was experimentally determined to be =12.81018 Nm-3.Tan We denote the interlayer shear force constant between two twisted interface layers (LG and LG) by . We also assume that the presence of the interface perturbs the force constant between the two layers closest to the interface in both subsystems, described by the force constant . The force constants are illustrated in the inset of Fig. 3(b) for a t(2+3)LG case.
Based on the experimental C mode frequencies of t(2+2)LG, t(1+3)LG and t(2+3)LG, we fit the parameters ( and ) of the improved linear chain model. The average values for and are, 11.81018 Nm-3 and 2.41018 Nm-3, respectively. These values suggest that the interlayer coupling between the two twisted interface layers is approximately 5 times weaker than the coupling in the Bernal-stacked layers, while the coupling between layers next to the interface, , decreases by approximately 9 % with respect to . To validate the fitting procedure, we calculate the position of C21 of t(1+2)LG using these parameters. The calculated value of 30.4 cm-1 is in good agreement with the experiment.
The theoretical and experimental C mode frequencies in t()LGs are summarized in Fig. 3(a) as crosses and open diamonds, respectively. Fig. 3(c) shows the normal mode displacements of the C modes in t()LGs calculated using Eq. (1). The mode displacements for the C modes are mainly localized within the LG or LG constituents and they are only weakly affected by the coupling across the twisted interface. Due to the interlayer coupling between the layers at the twisted interface, also a low-frequency mode below 15 cm-1 is theoretically predicted. This mode corresponds to the relative vibration of LG and LG constituents in t()LGs, as illustrated in Fig. 3(c). It is, however, not experimentally observed in the present measurements, possibly due to its weak intensity caused by a weak electron-phonon coupling.
In Fig. 2, two subpeaks, split by 2 cm-1, are found for the t(2+2)LG shear mode. It is interesting to compare the lattice dynamics of t(2+2)LG and Bernal stacked 4LG. The C41 () mode of 4LG at 41 cm-1 does not exist in t(2+2)LG because of the weak coupling at the interface. The C42 () mode of 4LG is infrared-active. For this mode, two middle layers move in phase, and the two bilayer systems are out-of-phase with respect to each other. This effectively makes the system equivalent to two uncoupled bilayers. Thus, the C42 frequency (31cm-1) of 4LG is equal to that of the C mode in 2LG.Tan For t(2+2)LG, the displacements of the middle layers are in-phase for C. Its lower frequency (28.8cm-1) than 2LG C21 and 4LG C42 frequency directly suggests a softening of the coupling between layers next to the interface. C has a higher frequency than C because the weakly coupled middle layers vibrate out-of-phaseWieting . The frequency difference between C and C is referred to as Davydov splitting.Ghosh Such splitting is a direct signature of the presence of coupling, albeit weak, between the two interface layers. Actually, the weak interlayer coupling at the interface can be confirmed by the frequencies of three C modes in t(2+2)LG. Indeed, the frequency of the relative vibration between the top and bottom bilayers in t(2+2)LG can be approximately deducedWieting as = 10.9 cm-1, which agrees well with the predicted 9.6 cm-1. A similar Davydov splitting of the C mode is expected to occur in all tLG.
The C and G+ modes of each t()LG can only be detected in a small range (see the Supplementary Fig.2), suggesting that the modes are enhanced in intensity by specific values of . Here, we consider in detail the case of t(1+3)LG. 13 laser wavelengths were used to excite the C and G modes of t(1+3)LG. As a simple model system for t()LGs, the Raman spectra of t(1+1)LG are included at multiple excitation wavelengths. Fig. 4 shows the measured spectra at seven different wavelengths both for t(1+1)LG and t(1+3)LG, with peak intensities normalized to I(G) in 1LG. The intensity of the G mode in t(1+1)LG and that of the C, G and G+ modes in t(1+3)LG strongly depend on , showing a typical resonant behavior. Fig. 4(a) clearly shows that the G+ peak in t(1+3)LG can only observed in a small range of .

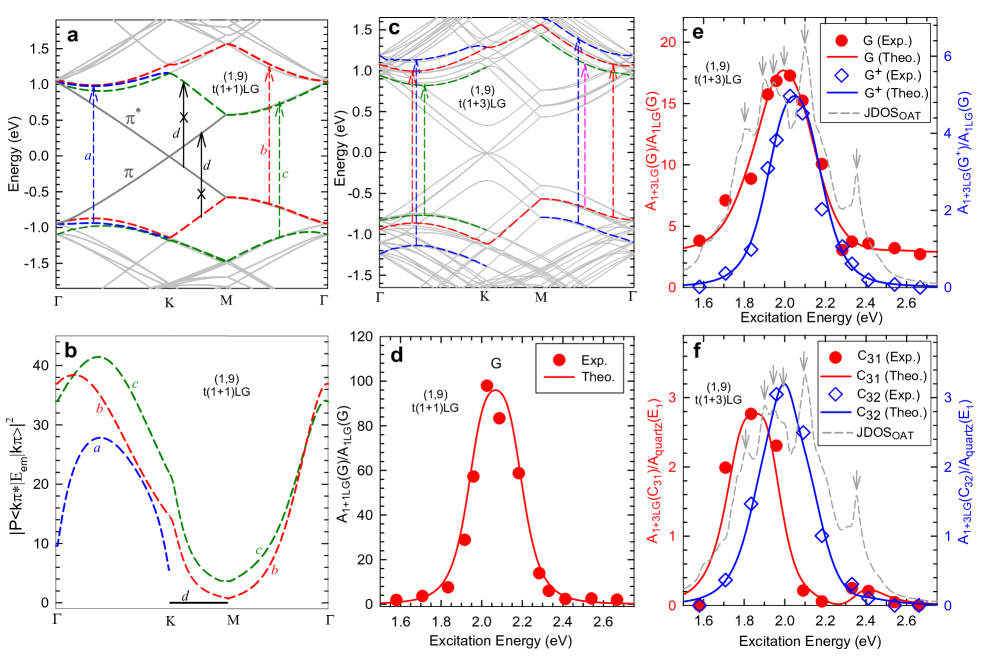
In order to explain the physical origin of the resonant enhancement, to be extended to all t()LGTan2 , a detailed calculation of the band structure in t(1+1)LG and t(1+3)LG is necessary. As the twist angle Carozo determines the coupling between the constituent LG and LG and consequently the intensity enhancement, its accurate determination is crucial. The twist angle can also be expressed in terms of the twist vectorTrambly ; Sato . In the literature, no Raman-based methods to determine the twist angle in arbitrary t()LG have been presented. However, the so-called R and R’ Raman bands have been used to determine the angle in t(1+1)LGCarozo ; Carozo2 . As shown in Fig. 1(a), in the present experiment, a graphene layer is flipped over and folded onto 1LG and 3LG regions to form the t(1+1)LG and t(1+3)LG. Consequently, as the top and bottom layers in t(1+1)LG and t(1+3)LG are actually the same graphene sheet, both systems have the same . The R and R′ peaks of t(1+1)LG are, respectively, found at 1510 cm-1 and 1618 cm-1. A further confirmation for the same twist angle is the observation of the t(1+3)LG R and R′ bands at 1512 cm-1 and 1618 cm-1. From the position of the R bandCarozo ; Kim2 ; Carozo2 , can be determined as , that is close to a commensurate structure with a twist vector of (1,9) and . Indeed, the optical contrast of t(1+1)LG in Fig. 1(b) shows an absorption peak in 2.03 eV, which agrees with the calculated one Carozo2 for (1,9) t(1+1)LG. Carozo2 ; Trambly We thus use this commensurate structure in calculations both for t(1+1)LG and t(1+3)LG.
The band structure of (1,9) t(1+1)LG calculated using the DFTB+ program Aradi ; Zhang2 is shown in Fig. 5(a). Fig. 5(b) shows the squared optical matrix elements for electronic transitions of some pairs between conduction and valence bands in Fig. 5(a) (see Methods for computational details). The optically allowed transitions are indicated by dashed lines with arrows. Obviously, the optical matrix elements are anisotropic along the high-symmetry directions as illustrated in Fig. 5(b). In particular, the optical transitions of (1,9) t(1+1)LG between two parallel conduction and valence bands labeled by the two arrows with crosses are found to be forbidden, and thus they do not contribute to the intensity resonance of Raman modes.
The band structure of (1,9) t(1+3)LG is shown in Fig. 5(c). In the low-energy region, two parabolic bands from the 3LG still exist in the band structure of t(1+3)LG. However, a linear band arising from the 1LG constituent is superimposed with that of the 3LG constituent to form a doubly degenerate linear band in t(1+3)LG, with a Fermi velocity that is decreased by 4% compared to that in 1LG due to the coupling at the interface. This reduction manifests itself in a blueshift in frequency of the 1LG-like 2D peak as shown in Fig. 1(c). The selection rule for optical transitions in t(1+3)LG is more complex than that in t(1+1)LG. As an example, some typical optically allowed transitions in t(1+3)LG are shown in Fig. 5(c) with vertical arrows. This results in a broader absorption peak in t(1+3)LG in comparison to the case in t(1+1)LG as shown in Fig. 1(b).
The experimental areal intensities of the G band in t(1+1)LG [A(G)] and the G and C bands in t(1+3)LG [A(G),A(G+), A(C31) and A(C32)] as a function of are, shown in Figs. 5(d), 5(e) and 5(f), respectively. The G modes were normalized to A(G) of 1LG, whereas the shear modes were normalized to the quartz modes (at 127 cm-1)Krishnan to eliminate the effect of different CCD efficiency for the detection of C and G modes at each . To understand the experimentally observed intensity enhancement, the Raman intensity of the C and G modes was calculated by second order perturbation theorSaito . Because only the optically allowed electronic transitions can be involved in the resonant Raman process, we calculate the electronic joint density of states (JDOS) of all the optically allowed transitions (JDOSOAT) in t()LG by the following equation:
| (2) |
where is the optical matrix element between the conduction and valence bands, gives the transition energy of band pair at wavevector . 180 -points are used for the summation along the -K-M- path, distributed according to the respective path lengths in the reciprocal space. The optically allowed transitions in t(1+1)LG shown in Fig. 5(a) contribute to a VHS at 1.95eV with the full width at half maximum (FWHM) of 0.13 eV in the JDOS (see Supplementary Fig.3). The JDOSOAT in t(1+3)LG is shown in Fig. 5(e,f) by gray dashed lines. There are six distinctive VHS features in the JDOSOAT of (1,9) t(1+3)LG, which are labeled by gray arrows(see the Supplementary Fig.4). t(1+3)LG exhibits much broader JDOSOAT (FWHM0.5 eV) than t(1+1)LG because of its complex band structure. The major contribution for the intensity comes from resonance matching between and the energy of VHSs in the JDOSOAT of t()LG. Therefore, the Raman intensity of Raman modes in t()LG as a function of can be evaluated asCarozo2 ,
| (3) |
where are constants treated as fitting parameters that encompass the product of the electron-phonon and electron-phonon interaction matrix elements for the VHS in the JDOSOAT, is the phonon energy (0.196 eV for , 0.197 eV for , 4.6 meV for , 2.7 meV for ), and gives the energy uncertainty related to the lifetime of the excited state (here, =0.15 eV ). The calculated intensity of the C and G bands as a function of are shown in Fig. 5(d)-5(f) with solid curves. Both well agree with the experimental measurements.
The resonant profile of the G+ peak of t(1+3)LG is symmetric and centered at 2.05 eV with a width of 0.3eV, which indicates that the VHSs with lower (1.8eV) and higher (2.3eV) energies contribute little to the resonance of the G+ peak. However, that of the G peak is asymmetric and slightly broader, meaning that VHSs with wider energy range contribute to its resonance, particularly in the lower energy range (1.9eV). When out of resonance, the G+ peak vanishes while I(G) of t(1+3)LG is about 3 times as much as I(G) of 1LG.
Because of the small energy of the C mode phonon, the resonance condition for both incoming and outgoing photon can be simultaneously nearly fulfilled. This makes the C mode intensity of t(1+3)LG be significantly enhanced by the optically allowed transitions in t(1+3)LG, as demonstrated in Figs. 5(c) and 5(f). Indeed, I(C31) and I(C32) excited at 1.96 eV can be enhanced by about 120- and 190-fold compared to I(C31) of Bernal-stacked 3LG, respectively, and their intensities can be comparable to resonantly enhanced I(G) and I(G+). In particular, both and exhibit broad resonant profiles with a width comparable to the G and G+ peaks. The resonant profile of is blue-shifted by 0.13 eV relative to that of . I() is resonantly enhanced by the transitions associated with VHSs at 2.1 eV, which contribute little to I(), while I() is significantly enhanced by the transitions associated with VHSs below 1.8 eV.
For an electronic transition at some wavevector , the matrix elements related with electron-photon interactions are the same for C31 and C32. The EPC matrix element, however, can be different. Indeed, the strength of the EPC greatly varies for the different graphene phonon branches.Lazzeri As the EPC of C41 in 4LG is about 15 times larger than the other Raman-active C43 mode at 17 cm-1, the other C modes except Cn1 in LG are challenging to detect.Tan The different resonant behaviors between C31 and C32 of 3LG had been observed in scroll structures at edges.Tan2 Thus, the observation of different resonant profiles for C31 and C32 directly indicates that in addition to differences in the EPC strength, the EPC is also anisotropic in the space, thus effectively removing the contribution from some optically allowed transitions to the resonant Raman process of some vibration modes.
Discussion
The C mode of Bernal-stacked FLG can be well fitted with a Breit-Wagner-Fano (BWF) lineshape.Tan This is attributed to quantum interference between the C mode and the continuum of electronic transitions near the K point.Tan Our theoretical calculation on the band structure of t(1+3)LG reveals that twisting can not induce a band gap near the K point. Therefore, a similar BWF profile is present for the C mode in the twisted system and its intensity is of the same order of magnitude as that of the C mode in Bernal-stacked 3LG. However, the intensity enhancement of the C mode in t(1+3)LG masks the weak BWF profile resulting from quantum interference between the C phonon and the continuum of electronic transitions at K point, giving an overall Lorentzian profile.
The weak coupling between the two interface layers in t()LGs can be understood from the nature of C modes that originate from the interlayer shear vibration. Due to the twist, the atoms at the interface are misaligned with respect to each other, which results in a weaker moiré-modulated coupling between the two interface layers, compared to the high order in conventional AA, AB or ABC stacked FLG with carbon atoms on the top or hollow positions of the neighboring layer.
Because the frequencies of the shear mode phonons directly reflect the interlayer interactions, the measurement of the C modes in t()LG allows the direct evaluation of interlayer interactions, both at the twisted interface and in the neighboring layers. The coupling across this interface is much weaker than the interaction between Bernal-stacked layers. Nevertheless, such a weak interaction can modify the electronic dispersion, as proven by the resonant enhancement of the C modes. By measuring the C modes in two-dimensional hybrids and heterostructures, the interlayer interactions at their interface can be probed in a similar manner.
Note added. Recently, we became aware of a reprint reporting experimental works on the intensity enhancement of the C modes in t()LG.Yu-2014
Methods
Sample preparation. Highly oriented pyrolytic graphite (HOPG) is mechanically exfoliated on a Si substrate covered with a 90nm SiO2 layer to obtain multilayer graphene Novoselov . To form t()LG, a LG flake is accidentally flipped over and folded onto a LG flake during the exfoliation process, or a LG flake from one Si substrate is transferred onto a LG flake on another Si substrate.Reina2 The number of layers in all initial and twisted graphene flakes is identified by Raman spectroscopy and optical contrast.Casiraghi ; Zhao2
Raman measurements. Raman spectra are measured in a back-scattering geometry at room temperature with a Jobin-Yvon HR800 Raman system, equipped with liquid-nitrogen-cooled charge-coupled device, a 100 objective lens (NA=0.90) and several gratings. The excitation energies used are 1.58eV and 1.71eV of a Ti:Saphire laser, 1.96eV, 2.03eV, 2.09eV and 2.28eV of a He-Ne laser, and 1.83eV, 1.92eV, 2.18eV, 2.34eV and 2.41eV of an Kr+ laser, and 2.54eV and 2.67eV of an Ar+ laser. The resolution of the Raman system at the 2.41 eV excitation is 0.54 cm-1 per CCD pixel. The laser excitations are cleaned away from their plasma lines with BragGrate Bandpass filters. Measurements of the Raman shift with frequencies close to 5 cm-1 for each excitation are enabled by three BragGrate notch filters with optical density 3 and with FWHM of 5-10 cm-1.Tan Both BragGrate bandpass and notch filters are produced by OptiGrate Corp. The typical laser power was 0.5 mW to avoid sample heating.
Band structure calculations. The electronic structure calculations were carried out using the DFTB+ programAradi ; Zhang2 . DFTB+ is an implementation of the Density Functional based Tight Binding (DFTB) method, containing many extensions to the original method. DFTB is based on a second-order expansion of the Kohn-Sham total energy in Density-Functional Theory (DFT) with respect to charge density fluctuations. The Coulomb interaction between partial atomic charges is determined using the self-consistent charge (SCC) formalism. A Slater Kirkwood-type dispersion is employed for the van der Waals and - stacking interactions. Here we adopted the parameter set ’mio-0-1’Elstner for Slater-Koster files. This approach has been shown to give a reasonably good prediction of the band structure in graphene and its derivativesZheng ; Gao .
Optical matrix elements. To calculate the optical matrix elements, the tight-binding model proposed by Trambly de Laissardière et al.Trambly2 ; Trambly and recently used for the calculation of optical properties in twisted bilayer grapheneMoon was used to calculate the electronic band structure of t()LG. The model hopping parameters were scaled up by 18 % to compensate for the underestimation of Fermi velocity in the absence of corrections due to electron-electron interaction.Coh
The optical matrix elements were calculated asVenezuela
| (4) |
where denotes the state in the valence (conduction) band and is the light polarization. in the present calculations.
Acknowledgements
We acknowledge support from the National Natural Science Foundation of China, grants 11225421, 10934007, 11434010 and 11474277. ACF acknowledges funding from EU projects GENIUS, CARERAMM, MEM4WIN, EU Graphene Flagship (contract no. 604391), ERC grant Hetero2D, a Royal Society Wolfson Research Merit Award, EPSRC grants EP/K01711X/1, EP/K017144/1, EP/L016087/1.
References
References
- (1) Geim, A. K. & Novoselov, K. S. The rise of graphene. Nat. Mater. 6, 183-191 (2007).
- (2) Bonaccorso, F., Sun, Z., Hasan, T. & Ferrari, A. Graphene photonics and optoelectronics. Nat.Photon. 4, 611-622 (2010).
- (3) Dos Santos, J. L., Peres, N. & Neto, A. C. Graphene bilayer with a twist: Electronic structure. Phys. Rev. Lett. 99, 256802 (2007).
- (4) Kim, K. S. et al. Large-scale pattern growth of graphene films for stretchable transparent electrodes. Nature 457 , 706-710 (2009).
- (5) Reina, A. et al. Large area, few-layer graphene films on arbitrary substrates by chemical vapor deposition. Nano Lett. 9, 30-35 (2009).
- (6) Ni, Z., Wang, Y., Yu, T., You, Y. & Shen, Z. Reduction of Fermi velocity in folded graphene observed by resonance Raman spectroscopy. Phys. Rev. B 77, 235403 (2008).
- (7) Trambly de Laissardi‘ere, G., Mayou, D. & Magaud, L. Localization of Dirac electrons in rotated graphene bilayers. Nano Lett. 10, 804-808 (2010).
- (8) Moon, P. & Koshino, M. Optical absorption in twisted bilayer graphene. Phys. Rev. B 87, 205404 (2013).
- (9) Li, G. et al. Observation of van Hove singularities in twisted graphene layers. Nat. Phys. 6, 109-113 (2009).
- (10) Koshino, M. & Ando, T. Electronic structures and optical absorption of multilayer graphenes. Solid State Commun. 149, 1123-1127 (2009).
- (11) Zhu, W., Perebeinos, V., Freitag, M. & Avouris, P. Carrier scattering, mobilities, and electro-static potential in monolayer, bilayer, and trilayer graphene. Phys. Rev. B 80, 235402 (2009).
- (12) Ye, J. et al. Accessing the transport properties of graphene and its multilayers at high carrier density. Proc. Natl. Acad. Sci. USA 108, 13002-13006 (2011).
- (13) Huang, X. et al. Graphene-based materials: Synthesis, characterization, properties, and appli-cations. Small 7, 1876-1902 (2011).
- (14) Ferrari, A. et al. Raman spectrum of graphene and graphene layers. Phys. Rev. Lett. 97, 187401 (2006).
- (15) Jorio, A., Dresselhaus, M. S., Saito, R. & Dresselhaus, G. Raman spectroscopy in graphene related systems (Wiley. com, 2010).
- (16) Ferrari, A. C. & Basko, D. M. Raman spectroscopy as a versatile tool for studying the properties of graphene. Nat. Nanotechnol. 8 , 235 C246 (2013).
- (17) Saha, S. K., Waghmare, U. V., Krishnamurthy, H. R. & Sood, A. K. Phonons in few-layer graphene and interplanar interaction: A first-principles study. Phys. Rev. B 78, 165421 (2008).
- (18) Tan, P. et al. The shear mode of multilayer graphene. Nat. Mater. 11, 294-300 (2012).
- (19) Tsurumi, J., Saito, Y. & Verma, P. Evaluation of the interlayer interactions of few layers of graphene. Chem. Phys. Lett. 557, 114-117 (2013).
- (20) Zhang, X. et al. Raman spectroscopy of shear and layer breathing modes in multilayer . Phys. Rev. B 87, 115413 (2013).
- (21) Zhao, Y. et al. Interlayer breathing and shear modes in few-trilayer and . Nano Lett. 13, 1007-1015 (2013).
- (22) Havener, R. W., Zhuang, H., Brown, L., Hennig, R. G. & Park, J. Angle-resolved Raman imaging of interlayer rotations and interactions in twisted bilayer graphene. Nano Lett. 12, 3162-3167 (2012).
- (23) Wang, Y. et al. Stacking-dependent optical conductivity of bilayer graphene. ACS Nano 4, 4074-4080 (2010).
- (24) Kim, K. et al.Raman spectroscopy study of rotated double-layer graphene: misorientation-angle dependence of electronic structure. Phys. Rev. Lett. 108, 246103 (2012).
- (25) Wang, H., Wang, Y., Cao, X., Feng, M. & Lan, G. Vibrational properties of graphene and graphene layers. J. Raman Spectro. 40, 1791-1796 (2009).
- (26) Born, M. & Huang, K. Dynamical theory of crystal lattices, vol. 188 (Clarendon Press Oxford, 1954).
- (27) Wieting, T. & Verble, J. Interlayer bonding and the lattice vibrations of -GaSe. Phys. Rev. B 5, 1473 (1972).
- (28) Ghosh, P. N. & Maiti, C. Interlayer force and Davydov splitting in 2H-. Phys. Rev. B 28, 2237 (1983).
- (29) Tan, P. H. et al. Ultralow-frequency shear modes of 2-4 layer graphene observed in scroll structures at edges. Phys. Rev. B 89, 235404 (2014).
- (30) Carozo, V. et al. Raman signature of graphene superlattices. Nano Lett. 11, 4527-4534 (2011).
- (31) Sato, K., Saito, R., Cong, C., Yu, T. & Dresselhaus, M. S. Zone folding effect in Raman G-band intensity of twisted bilayer graphene. Phys. Rev. B 86, 125414 (2012).
- (32) Carozo, V. et al. Resonance effects on the Raman spectra of graphene superlattices. Phys. Rev. B 88, 085401 (2013).
- (33) Aradi, B., Hourahine, B. & Frauenheim, T. DFTB+, a sparse matrix-based implementation of the DFTB method. J. Phys. Chem. A 11, 5678-5684 (2007).
- (34) Zhang, C. et al. Closed-edged graphene nanoribbons from large-diameter collapsed nanotubes. ACS Nano 6, 6023-6032 (2012).
- (35) Krishnan, R. S. Raman spectrum of quartz. Nature 115, 452 (1945).
- (36) Saito, R., Hofmann, M., Dresselhaus, G., Jorio, A. & Dresselhaus, M. S. Raman spectroscopy of graphene and carbon nanotubes. Adv. Phys. 60, 413-550 (2011).
- (37) Lazzeri, M., Piscanec, S., Mauri, F., Ferrari, A. C. & Robertson, J. Phonon linewidths and electron-phonon coupling in graphite and nanotubes. Phys. Rev. B 73, 155426 (2006).
- (38) Novoselov, K. et al. Two-dimensional atomic crystals. Proc. Natl. Acad. Sci. USA 102 , 10451-10453 (2005).
- (39) Reina, A. et al. Transferring and identification of single few-layer graphene on arbitrary sub-strates. J. Phys. Chem. C 112 , 17741-17744 (2008).
- (40) Casiraghi, C. et al. Rayleigh imaging of graphene and graphene layers. Nano Lett. 7, 2711-2717 (2007).
- (41) Zhao, W., Tan, P., Zhang, J. & Liu, J. Charge transfer and optical phonon mixing in few-layer graphene chemically doped with sulfuric acid. Phys. Rev. B 82, 245423 (2010).
- (42) Elstner, M. et al. Self-consistent-charge density-functional tight-binding method for simulations of complex materials properties. Phys. Rev. B 58, 7260-7268 (1998).
- (43) Zheng, G., Irle, S. & Morokuma, K. Performance of the DFTB method in comparison to DFT and semiempirical methods for geometries and energies of - fullerene isomers. Chem. Phys. Lett. 412, 210-216 (2005).
- (44) Gao, X., Liu, L., Irle, S. & Nagase, S. Carbon spiral helix: A nanoarchitecture derived from monovacancy defects in graphene. Angew. Chem. Int. Edit. 122 , 3268-3270 (2010).
- (45) Trambly de Laissardi‘ere, G., Mayou, D. & Magaud, L. Numerical studies of confined states in rotated bilayers of graphene. Phys. Rev. B 86, 125413 (2012).
- (46) Coh, S., Tan, L. Z., Louie, S. G. & Cohen, M. L. Theory of the raman spectrum of rotated double-layer graphene. Phys. Rev. B 88, 165431 (2013).
- (47) Venezuela, P., Lazzeri, M. & Mauri, F. Theory of double-resonant Raman spectra in graphene: Intensity and line shape of defect-induced and two-phonon bands. Phys. Rev. B 84, 035433 (2011).
- (48) C. Cong and T. Yu, arXiv:1312.6928.