-
July 2014
Photoemission studies of the near
EF spectral weight shifts in
FeSe1-xTex superconductor
Abstract
Our valence band photoelectron spectroscopic studies show a temperature dependent spectral weight transfer near the Fermi level in the Fe-based superconductor FeSe1-xTex. Using theoretical band structure calculations we have shown that the weight transfer is due to the temperature induced changes in the Fe(Se,Te)4 tetrahedra. These structural changes lead to shifts in the electron occupancy from the xz/yz and x2-y2 orbitals to the 3z2-r2 orbitals indicating a temperature induced crossover from a metallic state to an Orbital Selective Mott (OSM) Phase. Our study presents the observation of a temperature induced crossover to a low temperature OSM phase in the family of Fe chalcogenides.
Keywords: UV photoemission spectroscopy, superconductor, electronic structure, pseudogap regime
1 Introduction
The unconventional superconductivity[1] in iron based compounds[2, 3] has attracted much attention due to its importance in elucidating a consolidated understanding of superconductivity in general. Unlike the cuprate High Tc materials, superconductivity in these compounds involves some exotic interplay of structural and magnetic degrees of freedom. Although among them, Fe(Se,Te) is rather simple from a structural point of view, it shows a strong bearing of the spin fluctuations and structural and magnetic disorder on its superconducting properties. Despite, a number of reports addressing many of these issues, the roles of electron-phonon coupling, spin density wave states, quasiparticles etc. are still under intense debate.
The structure of FeSe1-xTex compounds consists of a stacking of edge sharing Fe(Se,Te)4 tetrahedra without any spacer layer in between[3]. The parent compound FeTe is a non superconductor and exhibits a monoclinic structure at low temperature. It also shows an antiferromagnetic spin density wave (SDW) transition at 70 K[4]. The other parent, FeSe is a superconductor with a Tc of 8 K[5]. Substitution of Se at the Te site enhances the Tc to a maximum of 15 K for x = 0.5[3]. This enhancement is reported to be linked to the local structural symmetry breaking[6] and the degree of disorder caused by the smaller ionic radius of Se[3], which is counter intuitive as disorder is expected to reduce the superconducting transition temperature[7]. Furthermore, the electronic properties of these superconductors with their moderate electron correlations, are controlled mostly by the competing inter- and intra- orbital interactions near the EF region. It has been pointed out[8] that these interactions generate an Orbital Selective Mott Phase (OSMP) in which electrons in some orbitals are Mott localized while others remain itinerant. Earlier, such an OSMP was identified in Ca2-xSrxRuO4 [9, 10]. Recently, a doping dependent OSMP was proposed to be present in Fe(Se,Te) by Craco et al. and Aichhorn et al.[11, 12] from a theoretical point of view.
Electron spectroscopic studies, particularly using ultra-violet photoelectron spectroscopy have shown that the near EF electronic states in the Fe(Se,Te) compositions are dominated by the Fe 3d and chalcogen p states[13, 14]. Changes in the Fe 3d - Se 4p/Te 5p correlation strength with doping or temperature lead to noticeable spectral weight shifts in the near EF states which could be intimately related to the superconducting properties of these materials. Although some of the earlier studies[15, 16, 17] have reported such spectral weight shifts and identified the formation of a pseudogap thereby, their origins and nature are still not clear. Further, the correlation between the formation of the pseudogap and disorder also has not been addressed. This study shows that the temperature dependent normal state pseudogap is intimately related to the insulating behavior originating from the multi-orbital correlation and the Hund’s coupling. Based on our theoretical calculations we have shown that the formation of such a pseudogap could be a signature of the temperature induced Orbital Selective Mott Transition (OSMT).
2 EXPERIMENTAL
Poly crystalline samples of FeSe1-xTex (x = 1, 0.5, 0) were synthesized via solid state reaction route described elsewhere[18]. The stoichiometric compositions of the samples studied using X-ray diffraction and resistivity measurements have been published earlier[19]. It should be noted that the samples contain no excess Fe and are of single phase nature. Angle integrated ultraviolet photoemission measurements were performed by using an ultra high vacuum system equipped with a high intensity vacuum-ultraviolet source and a hemispherical electron energy analyzer (SCIENTA R3000). At the He ( = eV) line, the photon flux was of the order of photons/sec/steradian with a beam spot of mm diameter. Fermi energies for all measurements were calibrated by using a freshly evaporated Ag film on a sample holder. The total energy resolution, estimated from the width of the Fermi edge, was about meV for He excitation. All the photoemission measurements were performed inside the analysis chamber under a base vacuum of mbar. The polycrystalline samples were repeatedly scraped using a diamond file inside the preparation chamber with a base vacuum of mbar and the spectra were taken within hour, so as to avoid any surface degradation. All measurements were repeated many times to ensure the reproducibility of the spectra. For the temperature dependent measurements, the samples were cooled by pumping liquid nitrogen through the sample manipulator fitted with a cryostat. Sample temperatures were measured using a silicon diode sensor touching the bottom of the stainless steel sample plate. The low temperature photoemission measurements at K were performed immediately after cleaning the sample surfaces followed by the room temperature measurements.
In order to understand the observed changes in the near EF spectral features we used TBLMTO-ASA[20] calculations employing scalar relativistic corrections including combined correction term and Langreth-Meh-Hu gradient corrected von Barth Hedin parametrized energy and potential. The experimental lattice parameters at 300K were used in the calculations[19]. The correlation effects of the Fe-d orbitals were taken into account by using LDA+U formulism with J as 0.9 eV[12], and U as 3.5 eV for FeTe and 4.0 eV for FeSe[21]. For the FeSe0.5Te0.5 U was taken as 3.8 eV, a value intermediate between those of FeTe and FeSe.
3 RESULTS AND DISCUSSION
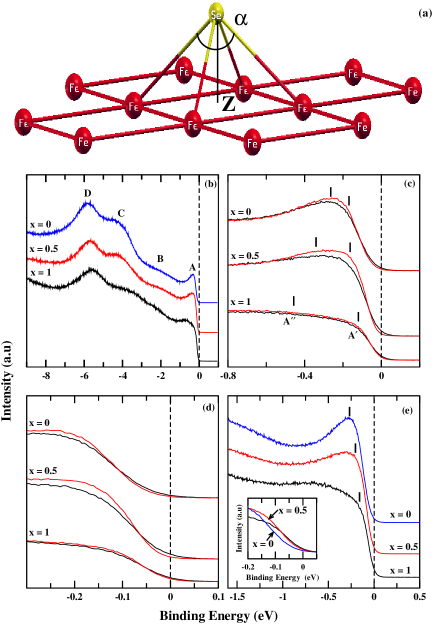
Figure 1(b) shows the valence band spectra of FeSe1-xTex (x = 1, 0.5, 0) samples taken at He I photon energy. The spectral features marked A and B, positioned at 0.5 eV and 2 eV respectively, originate from the Fe 3d states. Peak C at 4 eV is due to the hybridized Fe 3d - Se 4p/Te 5p states while D at 6 eV corresponds to Se 4p/Te 5p states. Our calculations based on the TBLMTO-ASA (fig 2(a)) and also other’s calculations[21, 22] conform to these assignments. The sharp feature A seen in the case of FeSe transforms into a broadened one for FeTe. Feature C gets broadened and shifts to lower binding energy with increasing x. Further, feature D also shifts to lower binding energy with doping.
In order to see the finer changes in the near EF electronic structure we have taken a set of high resolution spectra of this region. Figure 1(c) depicts the near EF valence band spectra of FeSe1-xTex at two different temperatures. Black and red spectra correspond to 300 K and 77 K respectively. The feature A, originating from Fe 3d states shows an enhancement in its intensity as the temperature is lowered. This enhancement is prominent in case of FeSe0.5Te0.5. We will discuss this point in the following paragraph. Yokoya et al.[14] have earlier shown that the feature A consists of two features, A′ and A′′ (see Fig. 1(c)). As we go from FeTe to FeSe, the energy separation between these two features keep decreasing and intensity of A′′ increases. Thus, the doublet structure in case of FeTe transforms into a prominent peak with a weak shoulder in case of FeSe. This could be associated with the changes in the tetragonal crystal structure of Fe(Se,Te). Substitution of Se for Te in FeTe leads to an increase in the Se/Te - Fe - Se/Te bond angle ( shown in fig 1 (a)). The angle which is 95∘ in case of FeTe, approaches the ideal tetrahedron value of 109.5∘ with Se doping[23]. The bond angle is determinant to the overlap between the iron and chalcogen orbitals, resulting in a stronger hybridization between the Fe 3d and the chalcogen p orbitals.
In Figure 1(e) we have plotted the valence band spectra from the three compositions taken at room temperature. As we see, with increase in the Se content from 0 to 1 the intensity of peak A increases. It can also be seen that, corresponding to this change in intensity some of the electronic states at the EF get depleted and the spectral weight at the EF shift to higher binding energy positions at A. Such a shift in spectral weight as a function of doping was observed earlier byYokoya et al[14]. More importantly, the feature A shows an increase in its intensity as we go from 300 K to 77 K. This change is temperature induced. Although, in case of FeTe this increase is very small, substitution of half of Te with Se results in a marked change. It should be noted that with further increase in Se content this enhancement of intensity of peak A becomes weaker, though still distinct. Associated with this increase in intensity there is a depletion of states at the Fermi level. Further, it can be seen that the area by which the A peak has increased does not match with the number of states depleted from the near EF position. This indicates that electrons from other orbitals also shift resulting in the increase in its intensity. It should be noted that, depletion of these states from the near EF clearly indicates an opening up of a pseudogap as the temperature is lowered from 300 K to 77 K.
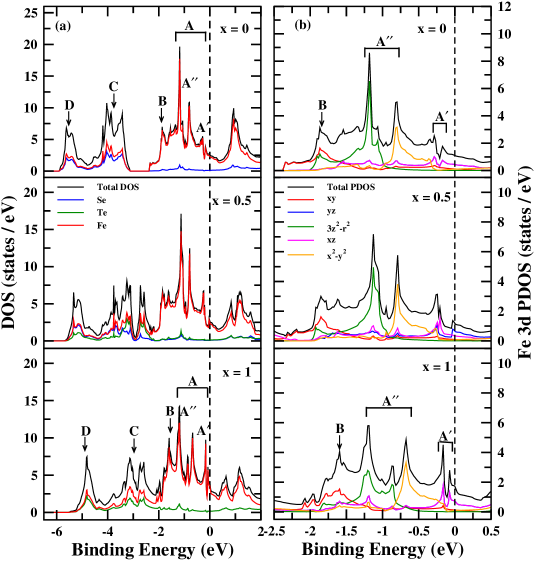
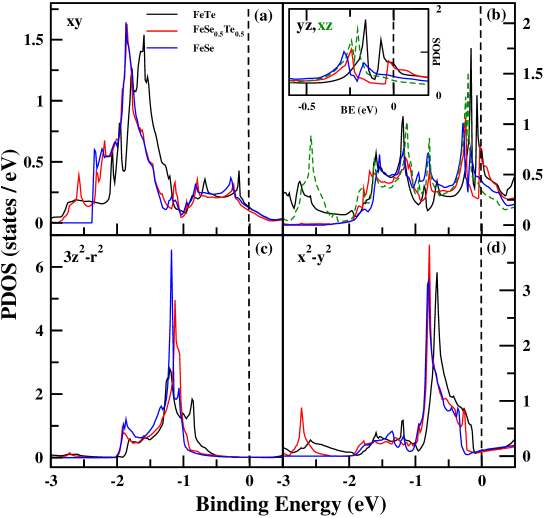
Figure 2(a) shows the calculated total density of states (DOS) over the valence band region. The calculated DOS matches with the earlier theoretical study[21, 22] and also with the observed experimental data. Features A and B exhibit predominant Fe 3d character, C represents hybridized Fe 3d and Se/Te p states while D corresponds to Se 4p/Te 5p states. Se incorporation shifts feature C and D towards higher binding energy owing to the greater electronegativity of Se (2.4) in comparison to Te (2.1). For FeTe, the features B and C merge while in case of FeSe, a clear gap is seen in the calculated DOS, which is in accordance with the experimental results. The features marked A′ (0.15 eV) and A′′ (1.0 eV) (shown in Fig 2) corresponds to the experimentally obtained features at 0.1 eV and 0.5 eV, respectively. The discrepancy in the energy positions could be due to the self-energy correction which is neglected in the calculations[24]. The partial density of states (PDOS) for Fe 3d orbitals for an energy range 0 - 2.5 eV is represented in Fig. 2(b). The PDOS (fig 2(b)) reveals that xz/yz and x2-y2 orbitals are the most populated ones at 0.15 eV (A′) while the feature at 1 eV (A′′) corresponds to states mostly populated with 3z2-r2. Although, FeSe, FeTe and FeSe0.5Te0.5 have tetragonal symmetry, different Fe-Se and Fe-Te bond lengths in case of FeSe0.5Te0.5 reduce the space group symmetry to 99 (P4mm)[25]. The lower symmetry in case of FeSe0.5Te0.5 results in the lifting of the degeneracy of xz/yz orbitals (as seen from fig 2(b)). The feature at 0.15 eV shifts back to higher binding energy and becomes less prominent with doping of Se in place of Te. On the contrary, the feature at 1.0 eV shifts towards EF and the plateau at 0.8 eV reduces with Se incorporation. The above effect results in an enhanced DOS for FeSe in comparison to FeTe at 0.5 eV (experimentally). The change in the orbital contribution is related to the chalcogen height from the Fe plane. Replacement of Te by Se leads to decrease in the chalcogen height, which affects the out of plane d orbitals, 3z2-r2 and xz/yz. The reduced chalcogen height leads to greater orbital overlap of 3z2-r2 and xz/yz orbitals with x2-y2 and xy orbitals, respectively, which in turn results in an orbital selective spectral weight transfer as seen from fig 3. The occupancy of xz/yz and x2-y2 orbitals reduces at EF with a simultaneous increase in occupancy of 3z2-r2 orbitals at higher binding energy. This change in the orbital occupancy is reflected as the spectral weight shifts which in turn results in the formation of a pseudogap with the doping of Se. It should be noted from fig 1(c) that the spectral weight transfer is weak in case of FeTe while FeSe0.5Te0.5 exhibits a significant shift.
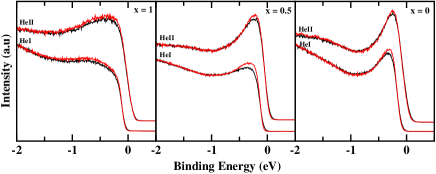
A comparison of the figures 1(d) and 1(e) will reveal that the doping dependent spectral weight transfer is similar to the temperature dependent transfer in their energy positions. It has been shown earlier that lowering the temperature results in the reduction in the Fe-chalcogen height (Z shown in fig 1(a)) in case of FeTe and FeSe0.5Te0.5 while a slight increase in case of FeSe[26]. The magnitude of this decrease is greater in case of FeSe0.5Te0.5 compared to FeTe. Thus, at 77 K, FeSe0.5Te0.5 has the shortest chalcogen height while FeTe the longest. The reduced chalcogen height at low temperature in case of FeSe0.5Te0.5 ensues the strongest hybridization between the orbitals. This reflects in the maximum spectral weight transfer to higher binding energy in comparison to both the parent compounds. As mentioned before, in an analogy with the doping dependent case discussed earlier, the reduction in the Fe-Chalcogen height shifts the electron occupancy from the xz/yz and x2-y2 to the 3z2-r2 orbitals resulting in the temperature dependent spectral weight transfer and thereby the pseudogap. This is a temperature induced crossover from a metallic state in which all the t2g orbitals (xy, xz/yz) near the EF are occupied to a state in which occupancy of the xz/yz orbitals are depleted, signifying a Mott transition. This kind of spectral weight transfer which is a characteristic of Mottness[27], has earlier been identified as Orbital Selective Mott Transition (OSMT)[8]. Our study presents the first observation of a temperature induced crossover to a low temperature OSM phase in the family of Fe chalcogenides although such phenomena was earlier observed in AxFe2-ySe2 (A = K, Rb) where a high temperature OSM phase was identified[28]. Such spectral weight redistributions with lowering of temperature were earlier ascribed to the spin density wave transition (SDW) in FeTe by Zhang et al.[15] who concluded that the suppression of the SDW is the cause of the reduction in the near EF spectral weight at low temperatures. But, our observation of a stronger spectral weight shift in case of FeSe0.5Te0.5 compared to that of FeTe shows that the spectral weight shift in this case is not related to the SDW transition. A recent ARPES study [29] has reported the evolution of the spectral feature (a hump which corresponds to feature A in our data) as a function of x. The intensity of the hump was found to reduce with decreasing Se content. This study points at the role of electronic correlations driving the system close to the Mott metal insulator transition. Another ARPES study, temperature dependent, by Liu et al. [30] have reported a peak-dip-hump line shape in case of Fe1.02Te across its antiferromagnetic transition at 70 K. This study has shown the hump to become broader as the temperature is lowered below 50K and explained the results in terms of the strength of polarons. It should be noted that the spectral weight shifts observed by us are all above the Neel temperature. Nevertheless, these results together highlight the intricate electron correlation in the near EF states over a broad range of temperature. In Figure 4 we have compared the spectra collected using the HeI and HeII photons for FeTe, FeTe0.5Se0.5 and FeSe respectively. The black and red spectra correspond to data taken at 300 K and 77 K respectively. There is an enhancement of Fe 3d derived states in case of He II for all the compositions due to the higher cross section of Fe 3d at the He II energy. The spectral weight shifts and thereby arising pseudogap described above follow the same trend in case of He II also but with a lower magnitude compared to He I.
In conclusion, we have studied the temperature and doping dependent spectral changes in the near EF valence states in FeSe1-xTex. The strong orbital dependent spectral weight transfer at low temperature suggests that these compounds are in close proximity with Mottness. Using theoretical band structure calculations we have shown that the spectral weight transfer is due to the shifting of the electron occupancy from the xz/yz and x2-y2 orbitals to the 3z2-r2 indicating a temperature induced crossover from a metallic state to an Orbital Selective Mott (OSM) Phase.
4 References
References
- [1] Hanaguri T, Niitaka S, Kuroki K and Takagi H 2010 Science 328 474
- [2] Kamihara Y, Hiramatsu H, Hirano M, Kawamura R, Yanagi H, Kamiya T and Hosono H 2006 J. Am. Chem. Soc. 128(31) 10012
- [3] Yeh K -W, Huang T -W, Huang Y L, Chen T -K, Hsu F -C, Wu P M, Lee Y -Y, Chu Y -Y, Chen C -L, Luo J -Y, Yan D -C and Wu M -K 2008 Europhys. Lett. 84 37002
- [4] Li S, DelaCruz C, Huang Q, Chen Y, Lynn J W, Hu J, Huang Y -L, Hsu F -C, Yeh K -W, Wu M -K, and Dai P 2009 Phys. Rev. B 79 054503
- [5] Hsu F -C, Luo J -Y, Yeh K -W, Chen T -K, Huang T -W, Wu P M, Lee Y -C, Huang Y -L, Chu Y -Y, Yan D -C and Wu M -K 2008 Proc. Natl. Acad. Sci. USA 105 14262
- [6] Joseph B, Iadecola A, Puri A, Simonelli L, Mizuguchi Y, Takano Y and Saini N L 2010 Phys. Rev. B 82 020502(R)
- [7] Chand M, Saraswat G, Kamlapure A, Mondal M, Kumar S, Jesudasan J, Bagwe V, Benfatto L, Tripathi V and Raychaudhuri P 2010 Phys. Rev. 85 014508
- [8] deMedici L, Hassan S R, Capone M, and Dai X 2009 Phys. Rev. Lett. 102 126401
- [9] Neupane M, Richard P, Pan Z -H, Xu Y -M, Jin R, Mandrus D, Dai X, Fang Z, Wang Z and Ding H 2009 Phys. Rev. Lett. 103 097001
- [10] Anisimov V I, Nekrasov I A, Kondakov D E, Rice T M and Sigrist M 2002 Eur. Phys. J. B 25 191
- [11] Craco L, Laad M S and Leoni S 2009 Europhys. Lett. 91 27001
- [12] Aichhorn M, Biermann S, Miyake T, Georges A and Imada M 2010 Phys. Rev. B. 82 064504
- [13] Yoshida R, Wakita T, Okazaki H, Mizuguchi Y, Tsuda S, Takano Y, Takeya H, Hirata K, Muro T, Okawa M, Ishizaka K, Shin S, Harima H, Hirai M, Muraoka Y and Yokoya T 2009 J. Phys. Soc. Jpn. 78 034708
- [14] Yokoya T, Yoshida R, Utsumi Y, Tsubota K, Okazaki H, Wakita T, Mizuguchi Y, Takano Y, Muro T, Kato Y, Kumigashira H, Oshima M, Harima H, Aiura Y, Sato H, Ino A, Namatame H, Taniguchi M, Hirai M, Muraoka Y 2012 Sci. Technol. Adv. Mater. 13 054403
- [15] Zhang Y, Chen F, He C, Yang L X, Xie B P, Xie Y L, Chen X H, Fang M, Arita M, Shimada K, Namatame H, Taniguchi M, Hu J P and Feng D L 2010 Phys. Rev. B 82 165113
- [16] Lin P -H, Texier Y, Taleb-Ibrahimi A, LeFèvre P, Bertran F, Giannini E, Grioni M and Brouet V 2013 Phys. Rev. Lett. 111 217002
- [17] Okazaki K, Ito Y, Ota Y, Kotani Y, Shimojima T, Kiss T, Watanabe S, Chen C -T, Niitaka S, Hanaguri T, Takagi H, Chainani A and Shin S 2014 Scientific Reports 4 4109
- [18] Awana V P S, Pal A, Vajpayee A, Mudgel M, Kishan H, Husain M, Zeng R, Yu S, Guo Y F, Shi Y G, Yamaura K and -Muromachi E T 2010 J. Appl. Phys. 107 09E128
- [19] Zargar R A, Pal A, Hafiz A K, Awana V P S 2014 J. Supercond. Nov. Magn. 27 897
- [20] Andersen O K 1975 Phys. Rev. B 12 3060
- [21] Miyake T, Nakamura K, Arita R and Imada M 2010 J. Phys. Soc. Jpn. 79 044705
- [22] Subedi A, Zhang L, Singh D J and Du M H 2008 Phys. Rev. B 78 134514
- [23] Yin Z P, Haule K and Kotliar G 2011 Nature Materials. 10 932
- [24] Yamasaki A, Matsui Y, Imada S, Takase K, Azuma H, Muro T, Kato Y, Higashiya A, Sekiyama A, Suga S, Yabashi M, Tamasaku K, Ishikawa T, Terashima K, Kobori H, Sugimura A, Umeyama N, Sato H, Hara Y, Miyagawa N and Ikeda S I 2010 Phys. Rev. B 82 184511
- [25] Louca D, Horigane K, Llobet A, Arita R, Ji S, Katayama N, Konbu S, Nakamura K, Koo T -Y, Tong P, and Yamada K 2010 Phys. Rev. B 81 134524
- [26] Horigane K, Hiraka H, and Ohoyama K 2009 J. Phys. Soc. Jpn. 78 074718
- [27] Phillips P, Choy T -P and Leigh R G 2009 Rep. Prog. Phys. 72 036501
- [28] Yi M, Lu D H, Yu R, Riggs S C, Chu J -H, Lv B, Liu Z K, Lu M, Cui Y -T, Hashimoto M, Mo S -K, Hussain Z, Chu C W, Fisher I R, Si Q and Shen Z -X 2013 Phys. Rev. Lett. 110 067003
- [29] Ieki E, Nakayama K, Miyata Y, Sato T, Miao H, Xu N, Wang X -P, Zhang P, Qian T, Richard P, Xu Z -J, Wen J S, Gu G D, Luo H Q, Wen H -H, Ding H and Takahashi T 2014 Phys. Rev. B 89 140506(R)
- [30] Liu Z K, He R -H, Lu D H, Yi M, Chen Y L, Hashimoto M, Moore R G, Mo S -K, Nowadnick E A, Hu J, Liu T J, Mao Z Q, Devereaux T P, Hussain Z and Shen Z -X 2013 Phys. Rev. Lett. 110 037003