Accreting Circumplanetary Disks: Observational Signatures
Abstract
I calculate the spectral energy distributions (SEDs) of accreting circumplanetary disks using atmospheric radiative transfer models. Circumplanetary disks only accreting at around a 1 MJ planet can be brighter than the planet itself. A moderately accreting circumplanetary disk (; enough to form a 10 MJ planet within 1 Myr) around a 1 MJ planet has a maximum temperature of 2000 K, and at near-infrared wavelengths (, , bands), this disk is as bright as a late M-type brown dwarf or a 10 MJ planet with a “hot start”. To use direct imaging to find the accretion disks around low mass planets (e.g., 1 MJ) and distinguish them from brown dwarfs or hot high mass planets, it is crucial to obtain photometry at mid-infrared bands (, , bands) because the emission from circumplanetary disks falls off more slowly towards longer wavelengths than those of brown dwarfs or planets. If young planets have strong magnetic fields (100 G), fields may truncate slowly accreting circumplanetary disks (10) and lead to magnetospheric accretion, which can provide additional accretion signatures, such as UV/optical excess from the accretion shock and line emission.
Subject headings:
accretion, accretion disks, radiative transfer, planets and satellites: formation, stars: magnetic fields, stars: pre-main sequence, planetary systems: protoplanetary disks1. Introduction
Planets form and grow in circumstellar disks. Before a planet’s mass reaches to the mass of Jupiter, its tidal force opens a gap in the circumstellar disk (Lin & Papaloizou 1986, Kley & Nelson 2012 and references therein). Material that resides beyond the gap in the circumstellar disk can be accreted by the protoplanet, but forms a circumplanetary disk because of its large angular momentum (Lubow et al. 1999; Ayliffe & Bate 2009). The accretion of the circumplanetary disk determines the final mass of the giant planet. Since circumstellar disks have lifetimes of a few million years (Hernandez et al. 2007), forming a 110 MJ planet within such time requires that the circumplanetary disk has an average accretion rate of .
Although there have been no clear detections of circumplanetary disks yet (except for a possible candidate, §5.3), theoretical studies show the possibility of complex circumplanetary disk structures: the infall from circumstellar to circumplanetary disks can occur at high altitudes (Tanigawa et al. 2012, Szulagyi et al. 2014), the infall can carry little angular momentum (Canup & Ward 2002), the infall can be episodic (Gressel et al. 2013), the surface of the disk can be subject to magnetorotational instability (MRI) (Fujii et al. 2011, 2014, Turner et al. 2014), a magnetocentrifugal wind can develop in the disk (Gressel et al. 2013), the disk midplane can be dominated by Hall MHD (Keith & Wardle 2014), and the disk can undergo outbursts (Lubow & Martin 2012).
Future circumplanetary disk observations are needed to constrain their structure. Fortunately, finding circumplanetary disks may not be too difficult. A disk around a 1 MJ planet accreting at has an accretion luminosity of
| (1) |
which is as bright as a late M-type/early L-type brown dwarf (Basri 2000; Chabrier & Baraffe 2000). Finding these disks in future observations will enable us to test accreting disk theory, constrain satellite formation, and finally find young planets.
In this paper theoretical SEDs of accreting circumplanetary disks are calculated. These SEDs together with other accretion signatures can be used for planning future observations to discover such disks. In §2, the radiative transfer model is introduced. The SEDs are shown in §3. The observational signatures of magnetospheric accretion are presented in §4. Finally, after a short discussion in §5, the paper is summarized in §6.
2. Method
As a first attempt to calculate the SEDs of accreting circumplanetary disks, I only focus on disks whose accretion luminosity is stronger than the planet irradiation. This requirement significantly simplifies the SED calculation since the SEDs of these disks are independent of the planet properties. To be more specific, I only study accreting circumplanetary disks with around low mass planets, such as a 1 MJ planet. A 1 MJ planet has an effective temperature of 800 K at an age of 1 million years in the “hot start” planet model (Spiegel & Burrows 2012, SB), and it has a total luminosity of 4 L⊙. Meanwhile, the luminosity of an accretion disk with is L⊙. Thus, the irradiation from the planet to the disk can be ignored in the disk SED calculation. For slowly accreting circumplanetary disks (e.g. ) around high mass planets with “hot start” (e.g. a 10 MJ planet with an effective temperature of 2000 K), a proper treatment including the planet irradiation is needed and left for future publications. This viscous heating dominated disk resembles FU Orionis systems for protostars (Hartmann & Kenyon 1996). Thus, I follow the method of Zhu et al. (2007, 2008, 2009) and Calvet et al. (1991a,b) (which was used to calculate the SEDs of FU Orionis systems) to calculate the disk spectrum. In summary, I calculate the emission from the atmosphere of a viscous, geometrically thin, optically thick accretion disk with constant mass accretion rate around a planet with mass and radius . The disk height is assumed to vary with the distance from the planet as , where is assumed, and is the disk inner radius. This approximation is not very accurate but it only affects the local surface gravity of the disk atmosphere, which has only a small effect on the emergent spectrum. We assume that radiative equilibrium holds in the disk atmosphere, and the surface flux is determined by the viscous energy generation in the deeper disk layers. This constant radiative flux through the disk atmosphere can be characterized by the effective temperature distribution of the steady optically-thick disk as in
| (2) |
where is the central planet’s mass. This equation predicts that the maximum disk temperature occurs at and then decreases to zero at . Since this decrease of temperature towards the planet is sensitive to the boundary condition at the planet surface, Equation (2) is modified so that, when the radius is smaller than 1.36 , the temperature is constant and equal to . The vertical temperature structure at each radius is calculated using the gray-atmosphere approximation in the Eddington limit, adopting the Rosseland mean optical depth .
The emission from either the boundary layer or the magnetospheric accretion shock has been neglected in this calculation. Their contributions to the SED will be included in §4. Generally, when the magnetosphere is equal or smaller than 2 RJ, such emission would emerge in UV/optical and irrelevant to modeling the infrared SED here, except that the accretion shock might enhance the heating to the disk via irradiation (§4).
The opacity of atomic and molecular lines has been calculated using the Opacity Distribution Function (ODF) method (Castelli & Kurucz, 2004; Sbordone et al., 2004; Castelli, 2005). The ODF method is a statistical approach to handle line blanketing when millions of lines are present in a short wavelength range (Kurucz et al., 1974). The line list is taken from Kurucz (2005). Not only atomic lines but also many molecular lines are included. The opacities of TiO and H2O, the most important molecules in the infrared, are from Partridge & Schwenke (1997) and Schwenke (1998). The details on this method and opacity sources can be found in Zhu et al. (2007). We improve the dust opacity in Zhu et al. (2007) by following D’Alessio et al. (2001). We assume that MgFeSiO4 (Olivine) and Mg0.8Fe0.2SiO3 (Pyroxene) have dust-to-gas mass ratio of 0.0017 respectively, and graphite has mass ratio of 0.0041. The grain size distribution has a power law of 3.5 with 0.005m and 1m as the minimum and maximum size. The dust sublimation temperatures for different dust species are taken from D’Alessio et al. (2001). At low temperatures complex chemical processes occur which are not included in the Kurucz data. Low temperature molecular opacity has not been calculated in detail; instead, the abundance ratio between different types of molecules below 700 K is assumed to be the same as the ratio at 700 K. This is unimportant for our purposes because dust opacity dominates at such low temperatures.
The total flux from the accretion disk is the addition of the fluxes coming from all the annuli in the disk. The radii of these annuli are chosen to increase exponentially from to . Since the size of the planet is uncertain, depending on the “cold” and “hot start” planet models (Marley et al. 2007, 1-2 RJ in SB), and the inner disk may be truncated by the planet’s magnetosphere (§4), is varied from 1 to 4 Jupiter radii in our calculation. The outer radius is also very uncertain. Theoretically, should be smaller than the maximum extent of the circumplanetary disk 0.4 where is the Hill radius of the planet (Martin & Lubow 2011). For a Jupiter mass planet at 20 AU, this is around RJ. Another rough constraint for can be derived if we assume that the accretion in circumplanetary disks is due to MRI. The disk needs to be sufficiently ionized to sustained MRI and thermal collision can sufficiently ionize the disk up to 50 RJ (Keith & Wardle 2014) when the disk accretes at 10. Furthermore, if material from the circumstellar disk falls directly to the inner regions of the circumplanetary disk (Machida et al. 2008, Machida 2009, Tanigawa et al. 2012), the accretion disk will also be small. However, while accreting, the circumplanetary disk will also expand to conserve angular momentum. Eventually the tidal torque from the central star can remove the angular momentum of the circumplanetary disk when the disk extends to 0.4 (Martin & Lubow 2011). In this case, the disk temperature structure deviates from a standard viscous model and will be discussed in §5.1. Nevertheless, in the next section, we set to be 50 and 1000 respectively to demonstrate how insensitive the disks’ SEDs depend on .
3. SEDs of Accreting Circumplanetary Disks
The SED of a steady, optically-thick accretion disk is determined by two parameters: the product of the mass of the planet and the disk accretion rate (), and the disk inner radius ().
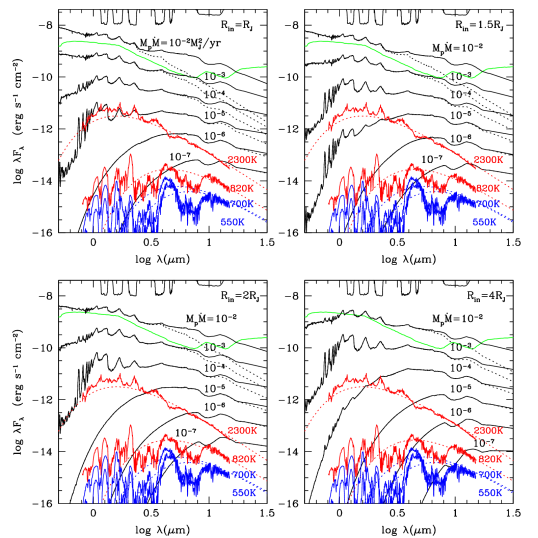
Thus, we varied both and and the resulting SEDs of accreting circumplanetary disks are shown in Figure 1 as the black curves, assuming that the disk is observed face on. The solid curves represent the cases with while the dotted curves are calculated with . The distance to the object is assumed to be 100 pc which is the typical distance to the closest star forming region. For comparison, the red curves are the SEDs of the 1 Myr old planets at 100 pc based on the “hot start” models (SB). The red curve with a brighter flux is from a 10 MJ planet while the red curve with a weaker flux is from a 1 MJ planet. We have also plotted the SEDs based on the “cold start” models as the blue curves (SB). Similarly, the blue curve with a brighter flux is from a 10 MJ planet while the blue curve with a weaker flux is from a 1 MJ planet. These planet models correspond to the 1 MJ, 10 MJ, “hot/cold start” models at an age of 1 Myr in Table 1 and Figure 6 of SB. Since SB only gives the spectra from 0.8-15 m, we also plot the SEDs from the blackbody having the corresponding planet size and effective temperature (temperatures are labeled along the curves) as the colored dotted curves. For another comparison, the green curve is the SED of the protostar GM Aur (model spectrum from Zhu et al. 2012) scaled to 100 pc.
The peak of the SED (after reddening correction) and/or spectral lines are mainly determined by the maximum temperature of the steady disk model
| (3) | |||||
Thus, a disk around a 1 MJ planet accreting at (labeled with M/yr in the upper left panel of Figure 1) has a similar optical and near-IR SED as the 2300 K blackbody (e.g., a late M-type brown dwarf, Burrows et al. 2001, or a 10 MJ planet with a “hot start” , SB).
The true luminosity of a flat disk is determined by
| (4) | |||||
| (5) |
where is the distance to the system, is the inclination angle of the disk to the line of sight, and is the observed total flux corrected for extinction. Thus, accreting circumplanetary disks can be quite bright. A disk accreting at is as bright as a late-M/early-L type brown dwarf.
Figure 1 shows that, at near to mid IR, the accreting circumplanetary disk is normally brighter than a 1 Myr old 1 MJ planet no matter whether the planet is “cold” or “hot start” as long as M yr-1. Furthermore, the disk spectrum is redder than a single blackbody spectrum, providing a way to distinguish the accretion disk from a planet or a background star. It also demonstrates that direct imaging at longer wavelengths will provide a higher contrast ratio for the circumplanetary disk with respect to the planet.
| Full Disk | Truncated Disk | |||||||||||||
| (K) | J | H | K | L’ | M | N | J | H | K | L’ | M | N | ||
| 10-2 | 1 | 12542 | 2.3 | 2.0 | 1.7 | 0.7 | 0.2 | -1.2 | 2.3 | 2.0 | 1.7 | 1.3 | 1.4 | 1.1 |
| 10-3 | 1 | 7053 | 4.3 | 3.9 | 3.5 | 2.6 | 2.2 | 0.7 | 4.3 | 3.9 | 3.5 | 2.7 | 2.4 | 1.9 |
| 10-4 | 1 | 3966 | 6.5 | 6.0 | 5.6 | 4.5 | 4.1 | 2.6 | 6.5 | 6.0 | 5.6 | 4.5 | 4.1 | 3.0 |
| 610-5 | 1 | 3491 | 7.0 | 6.6 | 6.1 | 4.9 | 4.5 | 3.0 | 7.0 | 6.6 | 6.1 | 4.9 | 4.5 | 3.3 |
| 310-5 | 1 | 2935 | 7.8 | 7.5 | 6.9 | 5.6 | 5.1 | 3.6 | 7.8 | 7.5 | 6.9 | 5.6 | 5.1 | 3.8 |
| 10-5 | 1 | 2230 | 9.3 | 9.2 | 8.3 | 6.6 | 6.0 | 4.5 | 9.3 | 9.2 | 8.3 | 6.6 | 6.0 | 4.5 |
| 610-6 | 1 | 1963 | 10.1 | 9.9 | 8.9 | 7.1 | 6.4 | 4.9 | 10.1 | 9.9 | 8.9 | 7.1 | 6.4 | 4.9 |
| 310-6 | 1 | 1651 | 13.4 | 11.6 | 10.0 | 7.7 | 7.0 | 5.4 | 13.4 | 11.6 | 10.0 | 7.7 | 7.0 | 5.5 |
| 10-6 | 1 | 1254 | 16.0 | 13.6 | 11.6 | 8.9 | 8.0 | 6.3 | 16.0 | 13.6 | 11.6 | 8.9 | 8.0 | 6.3 |
| 610-7 | 1 | 1104 | 17.7 | 15.0 | 12.6 | 9.5 | 8.6 | 6.8 | 17.7 | 15.0 | 12.6 | 9.5 | 8.6 | 6.8 |
| 310-7 | 1 | 928 | 20.6 | 17.3 | 14.4 | 10.6 | 9.5 | 7.4 | 20.6 | 17.3 | 14.4 | 10.6 | 9.5 | 7.4 |
| 10-7 | 1 | 705 | 25.2 | 20.8 | 17.2 | 12.7 | 11.4 | 8.4 | 25.2 | 20.8 | 17.2 | 12.7 | 11.4 | 8.4 |
| 10-2 | 1.5 | 9253 | 2.5 | 2.0 | 1.7 | 0.8 | 0.4 | -1.1 | 2.5 | 2.0 | 1.8 | 1.1 | 1.0 | 0.6 |
| 10-3 | 1.5 | 5204 | 4.5 | 4.0 | 3.6 | 2.7 | 2.3 | 0.8 | 4.5 | 4.0 | 3.6 | 2.7 | 2.4 | 1.6 |
| 10-4 | 1.5 | 2926 | 6.9 | 6.5 | 6.0 | 4.7 | 4.2 | 2.7 | 6.9 | 6.5 | 6.0 | 4.7 | 4.2 | 2.9 |
| 610-5 | 1.5 | 2575 | 7.5 | 7.3 | 6.6 | 5.1 | 4.6 | 3.1 | 7.5 | 7.3 | 6.6 | 5.1 | 4.6 | 3.2 |
| 310-5 | 1.5 | 2166 | 8.5 | 8.4 | 7.5 | 5.8 | 5.2 | 3.7 | 8.5 | 8.4 | 7.5 | 5.8 | 5.2 | 3.7 |
| 10-5 | 1.5 | 1646 | 11.7 | 10.6 | 9.1 | 6.9 | 6.2 | 4.6 | 11.7 | 10.6 | 9.1 | 6.9 | 6.2 | 4.6 |
| 610-6 | 1.5 | 1448 | 13.6 | 11.6 | 9.8 | 7.4 | 6.6 | 5.0 | 13.6 | 11.6 | 9.8 | 7.4 | 6.6 | 5.0 |
| 310-6 | 1.5 | 1218 | 15.4 | 13.0 | 10.9 | 8.1 | 7.3 | 5.6 | 15.4 | 13.0 | 10.9 | 8.1 | 7.3 | 5.6 |
| 10-6 | 1.5 | 925 | 19.8 | 16.4 | 13.6 | 9.8 | 8.6 | 6.5 | 19.8 | 16.4 | 13.6 | 9.8 | 8.6 | 6.5 |
| 610-7 | 1.5 | 814 | 22.0 | 18.2 | 15.0 | 10.9 | 9.5 | 7.0 | 22.1 | 18.2 | 15.0 | 10.9 | 9.5 | 7.0 |
| 310-7 | 1.5 | 685 | 24.8 | 20.3 | 16.6 | 12.1 | 10.7 | 7.7 | 24.8 | 20.3 | 16.6 | 12.1 | 10.7 | 7.7 |
| 10-7 | 1.5 | 520 | 31.2 | 25.2 | 20.4 | 14.3 | 12.5 | 8.8 | 31.2 | 25.2 | 20.4 | 14.3 | 12.5 | 8.8 |
| 10-2 | 2 | 7458 | 2.6 | 2.1 | 1.8 | 0.9 | 0.5 | -1.1 | 2.6 | 2.1 | 1.8 | 1.0 | 0.8 | 0.3 |
| 10-3 | 2 | 4194 | 4.7 | 4.2 | 3.8 | 2.8 | 2.4 | 0.9 | 4.7 | 4.2 | 3.8 | 2.8 | 2.4 | 1.4 |
| 10-4 | 2 | 2358 | 7.3 | 7.1 | 6.4 | 4.8 | 4.3 | 2.8 | 7.3 | 7.1 | 6.4 | 4.8 | 4.3 | 2.9 |
| 610-5 | 2 | 2076 | 8.1 | 7.9 | 7.0 | 5.3 | 4.7 | 3.2 | 8.1 | 7.9 | 7.0 | 5.3 | 4.7 | 3.2 |
| 310-5 | 2 | 1745 | 9.5 | 9.1 | 8.0 | 6.0 | 5.3 | 3.8 | 9.5 | 9.1 | 8.0 | 6.0 | 5.3 | 3.8 |
| 10-5 | 2 | 1326 | 13.8 | 11.6 | 9.7 | 7.2 | 6.4 | 4.7 | 13.8 | 11.6 | 9.7 | 7.2 | 6.4 | 4.7 |
| 610-6 | 2 | 1167 | 15.4 | 12.8 | 10.7 | 7.7 | 6.9 | 5.1 | 15.4 | 12.8 | 10.7 | 7.7 | 6.9 | 5.1 |
| 310-6 | 2 | 981 | 18.1 | 15.0 | 12.3 | 8.7 | 7.7 | 5.7 | 18.1 | 15.0 | 12.3 | 8.7 | 7.7 | 5.7 |
| 10-6 | 2 | 746 | 22.8 | 18.6 | 15.2 | 10.9 | 9.5 | 6.7 | 22.8 | 18.6 | 15.2 | 10.9 | 9.5 | 6.7 |
| 610-7 | 2 | 656 | 25.0 | 20.3 | 16.5 | 11.7 | 10.3 | 7.2 | 25.0 | 20.3 | 16.5 | 11.7 | 10.3 | 7.2 |
| 310-7 | 2 | 552 | 29.1 | 23.4 | 18.8 | 13.1 | 11.4 | 7.9 | 29.1 | 23.4 | 18.8 | 13.1 | 11.4 | 7.9 |
| 10-7 | 2 | 419 | 37.1 | 29.5 | 23.5 | 15.9 | 13.7 | 9.2 | 37.1 | 29.5 | 23.5 | 15.9 | 13.7 | 9.2 |
| 10-2 | 4 | 4434 | 2.9 | 2.4 | 2.0 | 1.1 | 0.7 | -0.8 | 2.9 | 2.4 | 2.0 | 1.1 | 0.7 | -0.3 |
| 10-3 | 4 | 2494 | 5.4 | 5.2 | 4.5 | 3.1 | 2.6 | 1.1 | 5.4 | 5.2 | 4.5 | 3.1 | 2.6 | 1.2 |
| 10-4 | 4 | 1402 | 11.5 | 9.6 | 7.8 | 5.3 | 4.6 | 3.0 | 11.5 | 9.6 | 7.8 | 5.3 | 4.6 | 3.0 |
| 610-5 | 4 | 1234 | 13.2 | 10.8 | 8.7 | 6.0 | 5.2 | 3.4 | 13.2 | 10.8 | 8.7 | 6.0 | 5.2 | 3.4 |
| 310-5 | 4 | 1038 | 15.6 | 12.7 | 10.2 | 6.9 | 5.9 | 4.0 | 15.6 | 12.7 | 10.2 | 6.9 | 5.9 | 4.0 |
| 10-5 | 4 | 789 | 20.4 | 16.4 | 13.2 | 9.1 | 7.7 | 5.0 | 20.4 | 16.4 | 13.2 | 9.1 | 7.7 | 5.0 |
| 610-6 | 4 | 694 | 22.4 | 18.0 | 14.4 | 9.8 | 8.5 | 5.5 | 22.4 | 18.0 | 14.4 | 9.8 | 8.5 | 5.5 |
| 310-6 | 4 | 584 | 26.2 | 20.8 | 16.5 | 11.1 | 9.5 | 6.2 | 26.2 | 20.8 | 16.5 | 11.1 | 9.5 | 6.2 |
| 10-6 | 4 | 443 | 33.8 | 26.6 | 20.9 | 13.8 | 11.7 | 7.4 | 33.8 | 26.6 | 20.9 | 13.8 | 11.7 | 7.4 |
| 610-7 | 4 | 390 | 38.1 | 29.9 | 23.4 | 15.3 | 12.9 | 8.1 | 38.1 | 29.9 | 23.4 | 15.3 | 12.9 | 8.1 |
| 310-7 | 4 | 328 | 44.8 | 35.0 | 27.3 | 17.6 | 14.8 | 9.1 | 44.8 | 35.0 | 27.3 | 17.6 | 14.8 | 9.1 |
| 10-7 | 4 | 249 | 58.0 | 45.0 | 35.0 | 22.1 | 18.6 | 10.9 | 58.0 | 45.0 | 35.0 | 22.1 | 18.6 | 10.9 |
| Mp from SB | (K) | J | H | K | L’ | M | N | |||||||
| 1 MJ, “cold start” | 550 | 19.0 | 19.3 | 18.0 | 15.4 | 13.0 | 12.0 | |||||||
| 1 MJ, “hot start” | 820 | 15.7 | 15.3 | 13.3 | 12.7 | 11.4 | 10.0 | |||||||
| 10 MJ, “cold start” | 700 | 17.3 | 16.8 | 17.2 | 14.1 | 12.6 | 11.9 | |||||||
| 10 MJ, “hot start” | 2300 | 9.5 | 8.7 | 8.1 | 7.8 | 8.3 | 7.5 | |||||||
| GM Aur model | J | H | K | L’ | M | N | ||||||||
| K5 V star with a disk | 3.2 | 2.7 | 2.5 | 2.1 | 1.9 | -0.1 | ||||||||
The absolute , , , , , and -band magnitudes (magnitudes when the disk is at 10 pc away) of the SEDs are given in Table 1 when the disk is observed face on. When the disk is not observed face on, the factor of needs to be multiplied to the luminosity to correct the absolute magnitudes for the geometric effect (Equation 4). The band passes are shown as the thin black curves at the top of each panel in Figure 1. The total absolute magnitude of the planet-disk system can be calculated by
| (6) |
where and are the absolute magnitudes of the planet and disk in Table 1 respectively. Absolute magnitudes for planets with other masses are given in Table 1 of SB.
4. Magnetospheric Accretion
Accretion boundary layers and magnetospheric accretion are important components in the standard accretion disk picture. For a high accretion rate disk around a central object having a weak magnetic field, the Keplerian rotating disk joins the slowly rotating central object through a boundary layer, and half of the accretion energy () is released at the boundary layer (Popham & Narayan 1992). Assuming the boundary layer has a radial width of disk scale heigh (0.1 ), the boundary layer has the typical effective temperature of
| (7) | |||||
| (8) |
Thus the boundary layer would provide strong UV/optical flux. However, we caution that, observationally, the simple boundary layer theory overpredicts the X-ray emission from cataclysmic variables (Fertig et al. 2011) and UV emission from FU Orionis objects (Hartmann et al. 2011). For FU Orionis objects, Equation (2) (with slight modifications described after the equation), which has not included the boundary layer emission, still provides the best match to the observed SED (Zhu et al. 2008, 2009; Hartmann et al. 2011).
On the other hand, when the disk accretion rate is not so high and the planet magnetic fields are strong, the inner disk can be truncated by planet magnetic fields and the planet accretes through magnetospheric accretion (Lovelace et al. 2011). Both dynamics and observational signatures of magnetospheric accretion have been relatively well studied for protostars (Romanova et al. 2008, Calvet & Gullbring 1998, Muzerolle et al. 1998, 2001). Dynamically, locking by the magnetosphere and the disk will spin down the rotation of the central objects. Unlike T Tauri stars that rotate very slowly compared to their breakup rates, Jupiter currently rotates rapidly, implying Jupiter has little magnetosphere when it is surrounded by circumplanetary disks. However, it is unknown whether young exoplanets rotate very rapidly as Jupiter. Observationally, the SED signatures of magnetospheric accretion are different from those of disk accretion. In this section, I will first calculate under what circumstances magnetospheric accretion can occur, then derive the structure of the magnetosphere, and finally discuss the observational signatures of magnetospheric accretion.
The first-order estimate for the truncation radius is derived by equating the ram pressure of a free-falling spherical envelope with the magnetic pressure of a dipolar field (Ghosh & Lamb 1979),
| (9) |
where is the magnetic field strength at the equator of the planet surface. If the results are normalized with the fiducial values of G, , , and we have
| (10) |
where represents . For fast rotators, the truncation radius can be 2 times the estimated above (Lovelace et al. 2011).
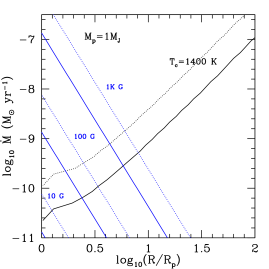
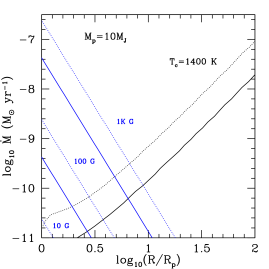
In Figure 2, blue curves are for 1 MJ and 10 MJ planet based on Equation (10). The solid curves are derived by assuming RJ, while the dotted curves assume 2. The magnetic field strength of young planets is unknown. Jupiter has an equatorial field strength of 4.28 G. With such a weak magnetic field, even slow accretion with can crush the magnetosphere to the planet. Young Jupiters may have stronger magnetic field up to 60 G (Sánchez-Lavega 2004). Young protostars can have field strength up to several kG (Johns-Krull et al. 1999). Thus, the truncation radii for planets with of 10, 100, and 1 kG have been calculated. Figure 2 shows that magnetospheric accretion only occurs when for 100 G magnetic field, consistent with Lovelace et al. (2011).
The structure of the magnetosphere around young planets can be calculated by following Hartmann et al. (1994), Calvet & Gullbring (1998) and Muzerolle et al. (2003) which successfully apply magnetospheric accretion theory to classical T Tauri stars (CTTS). During magnetospheric infall, material reaches the planet surface at the free fall velocity of (Calvet & Gullbring 1998)
| (11) | |||||
| (12) |
where
| (13) |
This infall velocity is one order of magnitude smaller than the infall velocity onto a CTTS with solar mass and solar radius.
Knowing the velocity, the density of the magnetospheric accretion column can be estimated using the law of conservation of mass at the given accretion rate
| (14) |
so that
| (15) | |||||
where is the filling factor of the accretion column on the planet surface and it ranges from 0.001 to 0.1 in CTTS (Calvet & Gullbring 1998). This typical density in Equation (15) is two orders of magnitude higher than the typical density of the magnetosphere around a CTTS ( cm-3) with and , which suggests that the emission from the magnetosphere of planets will be more optically thick than that from the magnetosphere of CTTS.
The supersonic magnetospheric infall leads to the shock formation at the planet surface. In classical T Tauri stars (CTTS), the emission from the shock region is responsible for the ultraviolet excess and line veiling (Calvet & Gullbring 1998). The total luminosity from the accretion shock is
| (16) |
When is much larger than or 1, almost entire accretion luminosity () is released at the shock. Since the accretion shock only has a small filling factor () on the stellar surface, the flux from the shock () is
| (18) | |||||
This high flux from the shock can heat up the planet photosphere below the shock. The “heated photosphere” has a temperature of (Calvet & Gullbring 1998). With Equation (18), we have
| (19) | |||||
| (20) |
This temperature is close to the typical value of in CTTS. When the circumplanetary disk has a low accretion rate of , Thp is 3000 K which is consistent with that derived by Lovelace et al. (2011).
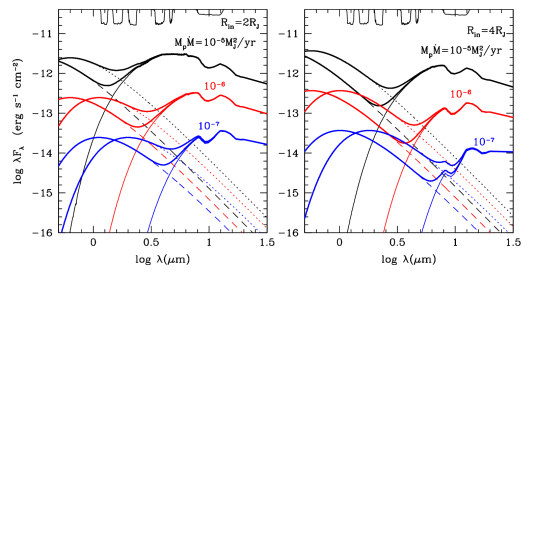
With given by Equation (20) and the assumed filling factor (), we can calculate the SEDs of the heated photosphere due to magnetospheric accretion by making the simplest assumption that the emission from the heated photosphere is a blackbody spectrum. The SEDs of the heated photosphere, together with the SEDs of the accretion disk, are shown in Figure 3. The truncation radius is also the inner radius of the accretion disk . The planet radius is assumed to be RJ. Two filling factors (=0.1 and 0.01) have been assumed. Thus, the total SED from the planet-disk system has three components in the scenario of magnetospheric accretion: emission from the planet (red and blue curves in Figure 1), emission from the heated photosphere with a filling factor of on the planet surface (dotted and dashed curves in Figure 3), and emission from the accretion disk (thin solid curves in Figure 3). Figure 3 shows that the hot heated photosphere can lead to strong optical and near-IR flux, and its SED can be even hotter and brighter than the SED from the planet. The blackbody assumption for the heated photosphere is highly simplified. The SED from the heated photosphere would be closer to that from an atmosphere of the given . Since the total SED consists of these three components, the lines emitted by each component could be shallower/veiled due to the emission from other components.
Besides the UV/optical excess and line veiling, another observational signature of magnetospheric accretion is emission of atomic lines (e.g. Balmer, Paschen and Na D lines). Estimating the line flux is more difficult since these lines come from the whole magnetosphere, and we know little on the heating mechanisms there (e.g. heating by shocks, MHD waves). If we adopt the typical temperature values of the magnetosphere constrained from CTTS ( 8000 K), we can roughly estimate the line flux of Hα. At the typical scale of R⊙ across the magnetosphere of CTTS, Hα is optically thick with 8000 K and cm-3 (Storey & Hummer 1995). Although the magnetosphere of planets is smaller, the density is significantly higher (Equation 15) so that Hα is still optically thick. At cm-3, the lower levels of H are controlled by collisions (Hartmann et al. 1994), so that the source function for Hα is the Planck function. Thus, considering the size of the magnetosphere is , the line luminosity would be
| (21) | |||||
| (22) |
where I assume that the line is a box of width (broadened by the infall) and the height of . Since is the flux at the line center, Equation (22) is the upper limit of the line flux. Another reason for this estimate to be the upper limit is that, at high densities ( cm-3), H can be in local thermal equilibrium and the continuum emission can be as strong as the line emission. Nevertheless, the typical value in Equation (22) is three orders of magnitude lower than the typical value from CTTS (L⊙ in Herczeg & Hillenbrand 2008; Rigliaco et al. 2012) due to one order of magnitude smaller truncation radius and one order of magnitude smaller infall velocity.
Our estimate of upper limit (Equation 22) is consistent with measurements of accreting late M type brown dwarfs by Zhou et al. (2014). The smallest object in Zhou et al. (2014) is GSC 06214-210b with a radius of 1.5 and L⊙. The other two objects in Zhou et al. (2014) (GQ Lup b and DH Tau b) have radii of and RJ with = and L⊙. These values are all close or smaller than our upper limit given by Equation (22).
Equation (22) does not show the known correlation between and (Herczeg & Hillenbrand 2008; Rigliaco et al. 2012). We suggest then that the filling factor, or total azimuthal coverage, of the accretion flow provides the correlation between the accretion rate and the emission-line flux. Realistically, the flow is not azimuthally axisymmetric but is probably separated into discrete magnetic flux tubes or “funnel flows”. This is especially likely if the magnetic field is tilted with respect to the stellar rotation axis, such that accretion will occur preferentially where the field lines bow inward toward the star. In this scenario, higher accretion rates result in a larger number of (or wider) discrete flows, providing a larger emitting region and hence stronger line fluxes. There must be a relatively symmetric distribution of flows around the star, so that the full range of red- and blueshifted velocities are in emission (for instance, a single discrete flow aligned along the line of sight to the star would result in a profile with a highly redshifted peak and little emission blueward of line center, which has not been observed in CTTS, Muzerolle et al. 2001). Overall Equation (22) suggests that Hα luminosity is proportional to the square of the magnetosphere radius so that Hα luminosity may decrease significantly when the objects are in the planet mass regime due to their weak magnetic fields.
5. Discussion
5.1. Caveats
We have made a major simplification by assuming that the circumplanetary disk accretes at a constant rate throughout the whole disk. On the other hand, recent 3-D simulations (Machida et al. 2008, Tanigawa et al. 2012, Szulagyi et al. 2014) have suggested that gas enters the circumplanetary disk almost vertically from the circumstellar disk. This vertical infall can even be significant at two Jupiter radii (Szulagyi et al. 2014). Martin & Lubow (2011) has suggested that the standard accretion disk picture only stands inward of where the vertical entrainment occurs. The spectrum of radiation from the region between the mass infall radius and the outer edge of the disk corresponds to that of a decretion disk (Equation 66 in Martin & Lubow 2011) with instead of for an accretion disk (Pringle 1981, Lee 1991). Furthermore, the mass infall may not occur at a single radius, but instead a wide range of radii. Thus, assuming the disk accretion rate at the disk radius equals to the integrated infall rate beyond , the disk accretion rate decreases with . Both of the decretion disk structure and decreasing lead to steeper temperature profile with radii. To explore this effect, we have calculated the SED of a disk with by multiplying Equation 2 with (again, the temperature at is assumed to be the same as that at ). Assuming and M/yr, the obtained J, H, K, L’, M, N magnitudes are 9.9, 9.8, 9.0, 7.6, 7.1, 6.0, instead of 9.3, 9.2, 8.3, 6.6, 6.0, 4.5 in Table 1. Thus, the disk becomes slightly fainter and the slope of the SED becomes slightly steeper due to the steeper temperature profile.
The standard accretion disk model is based on the assumption that local turbulence is responsible for both angular momentum transport and energy dissipation. However, circumplanetary disks feel strong tidal forces from the central star. This tidal force can drive global spiral arms and shocks in circumplanetary disks, leading to accretion. 2-D and 3-D simulations (Rivier et al. 2012, Szulagyi et al. 2014) have shown that the accretion induced by tidal forces is assuming that dissipation in the circumplanetary disk leads to a steady accretion. However, shock dissipation is unlikely to be uniform throughout the circumplanetary disk and mass may pile up in the disk by shock dissipation. In this case, local turbulence is still needed for accretion onto the planet.
Another mechanism for global angular momentum transport is the disk wind. The wind can lead to significantly less energy dissipation compared with the dissipation in viscous models. Recent MHD simulations by Gressel et al. (2013) have suggested that a magnetocentrifugal wind develops in circumplanetary disks. Future work is required to know the fraction of angular momentum and energy carried by disk wind versus the local turbulence.
Regarding the SED calculations, when with , our assumption that the disk is optically thick marginally stands within the dust sublimation radius where the opacity is dominated by molecular opacity. In this case, the disk may have a different temperature structure than that obtained through the grey atmosphere assumption. Cooling through molecular lines may be quite important in this case.
Finally, we discuss how mass can be transported in circumplanetary disks. The disk needs to be hot enough to sustain MRI. When the disk accretion rate is too low, viscous heating may not provide enough thermal ionization to sustain MRI. By assuming , the disk thermal structure has been calculated (following Zhu et al. 2009) and we plot the radius where the disk midplane temperature reaches 1400 K in Figure 2. As shown, when , MRI cannot be sustained by thermal ionization in the disk. The disk may need to rely on non-thermal ionization at the disk surface to sustain MRI, which is quite uncertain (Fujii et al. 2011, 2014, Turner et al. 2014).
5.2. Observational Signatures
The disk SED calculations suggest that, at near-IR wavelengths (, , bands), a moderately accreting circumplanetary disk () can be as bright as a late M-type brown dwarf or a 10 planet with a “hot start”, since a late M-type dwarf (Basri et al. 2000) and a 10 MJ planet with a “hot start” (SB) both have T 2300 K and the radius of Jupiter. This result implies that recently discovered high mass young planet/brown dwarf candidates that are in protoplanetary disks (Neuhäuser et al. 2005; Itoh et al. 2005; Kraus & Ireland 2012; Quanz et al. 2013) could also be accreting circumplanetary disks around low mass planets.
To distinguish the accretion disk around a low mass planet (e.g., 1 MJ) from a brown dwarf or a hot high mass planet, it is crucial to obtain the photometry at mid-IR bands (, , bands) for these objects. Since the total flux of an accretion disk is from different disk annuli having a wide range of temperatures, the SEDs of accretion disks fall off slower towards longer wavelengths than the Rayleigh- Jeans tail of the SEDs of brown dwarfs or planets (Figure 1).
Searching for circumplanetary disks at radio wavelengths is also appealing due to ALMA’s high sensitively (Isella et al. 2014). However, dust in circumplanetary disks may be depleted due to particle trapping at the planet opened gap edge (Rice et al. 2006, Zhu et al. 2012) or depleted due to radiation pressure from the accreting planets (Owen 2014).
If the planet can have a strong magnetic field, the field can truncate the accreting circumplanetary disk to produce other accretion signatures, including optical/UV excess from the heated photosphere due to accretion shocks, line veiling, and emission from magnetospheric accretion. Gyrosynchrotron radiation modulated at a short period could also be a good indicator for magnetospheric accretion around planets (Lovelace et al. 2011). The heated photosphere produces a high temperature spectrum but from a small emitting area with the filling factor of on the planet surface, which is distinguishable from the emission from the planet and the disk. Close et al. (2014) have detected strong emission within cavities of transitional disks, and Zhou et al. (2014) has suggested that flux can be as high as of the accretion luminosity for disks around late M or L type brown dwarf. On the other hand, we caution that line flux sensitively depends on the size of the magnetosphere, which could be small if the magnetic field of the planet is weak (§4).
The outer region of the circumplanetary disk, which is close to the Roche sphere, may also experience strong dissipation due to shock formation by the infall or Kelvin-Helmholtz instability at the position where infall meets the disk (similar to the ”hot spot” in cataclysmic variables). The observational signatures of the outer disk need further study.
5.3. Application to HD 169142
During the preparation of this manuscript, Reggiani et al. (2014) and Biller et al. (2014) reported the discovery of a companion around the transitional disk star HD 169142. Reggiani et al. (2014) found that the companion has L’=12.2 0.5 and J13.8. Assuming the distance of 145 pc, the absolute magnitude is L’=6.4 0.5 and J8.0. Assuming the circumplanetary disk has an inner radius of RJ and is viewed face on, our Table 1 suggests that M/yr with the prediction of apparent magnitudes: M=11.6 0.5 and N=10.1 0.5. Assuming the inner radius of 4 RJ, Table 1 suggests M/yr with the prediction of apparent magnitudes: M=11.3 0.5 and N=9.5 0.5. If MJ, the circumplanetary disk would accrete at 10, which is reasonable.
Biller et al. (2014) report the non-detection of Hα in this system (Follette et al. In prep). Using our Figure 2, the non-detection could imply that the magnetic field around the planet is weak (e.g. B100 G) and the disk accretion rate is high (e.g., ), which is consistent with the accretion rates obtained from L’.
6. Conclusion
We calculate the spectral energy distributions (SEDs) of circumplanetary disks accreting at a variety of accretion rates. We find that the circumplanetary disks that are even accreting at around a 1 MJ planet can be brighter than the planet itself. At near-IR wavelengths (, , bands), a moderately accreting circumplanetary disk () has a maximum temperature of 2000 K and is as bright as a late M-type brown dwarf or a 10 MJ planet with a “hot start”. To distinguish the accretion disks around low mass planets (e.g., 1 MJ) from brown dwarfs or hot high mass planets, it is crucial to obtain the photometry at mid-IR bands (, , bands) since the disks’ SEDs have flatter slopes towards longer wavelengths than the Rayleigh-Jeans tail of the SEDs of brown dwarfs or planets. If young planets have strong magnetic fields (100 G), the magnetic fields may truncate the slowly accreting circumplanetary disks (10) and lead to magnetospheric accretion, which can provide additional accretion signatures (e.g. UV/optical excess, line veiling and line emission). James Webb Space Telescope will provide enough sensitivity and wavelength coverage (near to mid-IR) to study circumplanetary disks in future.
References
- Ayliffe & Bate (2009) Ayliffe, B. A., & Bate, M. R. 2009, MNRAS, 397, 657
- Basri (2000) Basri, G. 2000, ARA&A, 38, 485
- Basri et al. (2000) Basri, G., Mohanty, S., Allard, F., et al. 2000, ApJ, 538, 363
- Biller et al. (2014) Biller, B. A., Males, J., Rodigas, T., et al. 2014, arXiv:1408.0794
- Burrows et al. (2001) Burrows, A., Hubbard, W. B., Lunine, J. I., & Liebert, J. 2001, Reviews of Modern Physics, 73, 719
- Calvet & Gullbring (1998) Calvet, N., & Gullbring, E. 1998, ApJ, 509, 802
- Calvet et al. (1991a) Calvet, N., Patino, A., Magris, G. C., & D’Alessio, P. 1991a, ApJ, 380, 617
- Calvet et al. (1991b) Calvet, N., Hartmann, L., & Kenyon, S. J. 1991b, ApJ, 383, 752
- Canup & Ward (2002) Canup, R. M., & Ward, W. R. 2002, AJ, 124, 3404
- Castelli (2005) Castelli, F. 2005, Memorie della Societa Astronomica Italiana Supplement, 8, 34
- Castelli & Kurucz (2004) Castelli, F., & Kurucz, R. L. 2004, ArXiv Astrophysics e-prints, arXiv:astro-ph/0405087
- Chabrier & Baraffe (2000) Chabrier, G., & Baraffe, I. 2000, ARA&A, 38, 337
- Close et al. (2014) Close, L. M., Follette, K. B., Males, J. R., et al. 2014, ApJ, 781, L30
- D’Alessio et al. (2001) D’Alessio, P., Calvet, N., & Hartmann, L. 2001, ApJ, 553, 321
- Fertig et al. (2011) Fertig, D., Mukai, K., Nelson, T., & Cannizzo, J. K. 2011, PASP, 123, 1054
- Fujii et al. (2011) Fujii, Y. I., Okuzumi, S., & Inutsuka, S.-i. 2011, ApJ, 743, 53
- Fujii et al. (2014) Fujii, Y. I., Okuzumi, S., Tanigawa, T., & Inutsuka, S.-i. 2014, ApJ, 785, 101
- Ghosh & Lamb (1979) Ghosh, P., & Lamb, F. K. 1979, ApJ, 232, 259
- Gressel et al. (2013) Gressel, O., Nelson, R. P., Turner, N. J., & Ziegler, U. 2013, ApJ, 779, 59
- Hartmann et al. (1994) Hartmann, L., Hewett, R., & Calvet, N. 1994, ApJ, 426, 669
- Hartmann & Kenyon (1996) Hartmann, L., & Kenyon, S. J. 1996, ARA&A, 34, 207
- Hartmann et al. (2011) Hartmann, L., Zhu, Z., & Calvet, N. 2011, arXiv:1106.3343
- Herczeg & Hillenbrand (2008) Herczeg, G. J., & Hillenbrand, L. A. 2008, ApJ, 681, 594
- Hernández et al. (2007) Hernández, J., Hartmann, L., Megeath, T., et al. 2007, ApJ, 662, 1067
- Isella et al. (2014) Isella, A., Chandler, C. J., Carpenter, J. M., Pérez, L. M., & Ricci, L. 2014, ApJ, 788, 129
- Itoh et al. (2005) Itoh, Y., Hayashi, M., Tamura, M., et al. 2005, ApJ, 620, 984
- Johns-Krull et al. (1999) Johns-Krull, C. M., Valenti, J. A., & Koresko, C. 1999, ApJ, 516, 900
- Keith & Wardle (2014) Keith, S. L., & Wardle, M. 2014, MNRAS, 440, 89
- Kley & Nelson (2012) Kley, W., & Nelson, R. P. 2012, ARA&A, 50, 211
- Kraus & Ireland (2012) Kraus, A. L., & Ireland, M. J. 2012, ApJ, 745, 5
- Kurucz et al. (1974) Kurucz, R. L., Peytremann, E., & Avrett, E. H. 1974, Washington : Smithsonian Institution : for sale by the Supt. of Docs., U.S. Govt. Print. Off., 1974., 37
- Kurucz (2005) Kurucz, R. L. 2005, Memorie della Societa Astronomica Italiana Supplement, 8, 86
- Lee et al. (1991) Lee, U., Osaki, Y., & Saio, H. 1991, MNRAS, 250, 432
- Lin & Papaloizou (1986) Lin, D. N. C., & Papaloizou, J. 1986, ApJ, 309, 846
- Lovelace et al. (2011) Lovelace, R. V. E., Covey, K. R., & Lloyd, J. P. 2011, AJ, 141, 51
- Lubow et al. (1999) Lubow, S. H., Seibert, M., & Artymowicz, P. 1999, ApJ, 526, 1001
- Lubow & Martin (2012) Lubow, S. H., & Martin, R. G. 2012, ApJ, 749, L37
- Machida et al. (2008) Machida, M. N., Kokubo, E., Inutsuka, S.-i., & Matsumoto, T. 2008, ApJ, 685, 1220
- Machida (2009) Machida, M. N. 2009, MNRAS, 392, 514
- Marley et al. (2007) Marley, M. S., Fortney, J. J., Hubickyj, O., Bodenheimer, P., & Lissauer, J. J. 2007, ApJ, 655, 541
- Martin & Lubow (2011) Martin, R. G., & Lubow, S. H. 2011, MNRAS, 413, 1447
- Muzerolle et al. (1998) Muzerolle, J., Calvet, N., & Hartmann, L. 1998, ApJ, 492, 743
- Muzerolle et al. (2001) Muzerolle, J., Calvet, N., & Hartmann, L. 2001, ApJ, 550, 944
- Muzerolle et al. (2003) Muzerolle, J., Hillenbrand, L., Calvet, N., Briceño, C., & Hartmann, L. 2003, ApJ, 592, 266
- Neuhäuser et al. (2005) Neuhäuser, R., Guenther, E. W., Wuchterl, G., et al. 2005, A&A, 435, L13
- Owen (2014) Owen, J. E. 2014, ApJ, 789, 59
- Partridge & Schwenke (1997) Partridge, H., & Schwenke, D. W. 1997, J. Chem. Phys., 106, 4618
- Popham & Narayan (1992) Popham, R., & Narayan, R. 1992, ApJ, 394, 255
- Pringle (1981) Pringle, J. E. 1981, ARA&A, 19, 137
- Quanz et al. (2013) Quanz, S. P., Amara, A., Meyer, M. R., et al. 2013, ApJ, 766, L1
- Reggiani et al. (2014) Reggiani, M., Quanz, S. P., Meyer, M. R., et al. 2014, arXiv:1408.0813
- Rice et al. (2006) Rice, W. K. M., Armitage, P. J., Wood, K., & Lodato, G. 2006, MNRAS, 373, 1619
- Rigliaco et al. (2012) Rigliaco, E., Natta, A., Testi, L., et al. 2012, A&A, 548, A56
- Rivier et al. (2012) Rivier, G., Crida, A., Morbidelli, A., & Brouet, Y. 2012, A&A, 548, A116
- Romanova et al. (2008) Romanova, M. M., Kulkarni, A. K., & Lovelace, R. V. E. 2008, ApJ, 673, L171
- Szulágyi et al. (2014) Szulágyi, J., Morbidelli, A., Crida, A., & Masset, F. 2014, ApJ, 782, 65
- Sánchez-Lavega (2004) Sánchez-Lavega, A. 2004, ApJ, 609, L87
- Sbordone et al. (2004) Sbordone, L., Bonifacio, P., Castelli, F., & Kurucz, R. L. 2004, Memorie della Societa Astronomica Italiana Supplement, 5, 93
- Schwenke (1998) Schwenke, D. W. 1998, Chemistry and Physics of Molecules and Grains in Space. Faraday Discussions No. 109, 321
- Spiegel & Burrows (2012) Spiegel, D. S., & Burrows, A. 2012, ApJ, 745, 174 (SB)
- Storey & Hummer (1995) Storey, P. J., & Hummer, D. G. 1995, MNRAS, 272, 41
- Tanigawa et al. (2012) Tanigawa, T., Ohtsuki, K., & Machida, M. N. 2012, ApJ, 747, 47
- Turner et al. (2014) Turner, N. J., Lee, M. H., & Sano, T. 2014, ApJ, 783, 14
- Zhou et al. (2014) Zhou, Y., Herczeg, G. J., Kraus, A. L., Metchev, S., & Cruz, K. L. 2014, ApJ, 783, L17
- Zhu et al. (2007) Zhu, Z., Hartmann, L., Calvet, N., Hernandez, J., Muzerolle, J., & Tannirkulam, A.-K. 2007, ApJ, 669, 483
- Zhu et al. (2008) Zhu, Z., Hartmann, L., Calvet, N., et al. 2008, ApJ, 684, 1281
- Zhu et al. (2009) Zhu, Z., Espaillat, C., Hinkle, K., et al. 2009, ApJ, 694, L64
- Zhu et al. (2012) Zhu, Z., Nelson, R. P., Dong, R., Espaillat, C., & Hartmann, L. 2012, ApJ, 755, 6