Plastic deformation of a model glass induced by a local shear transformation
Abstract
The effect of a local shear transformation on plastic deformation of a three-dimensional amorphous solid is studied using molecular dynamics simulations. We consider a spherical inclusion, which is gradually transformed into an ellipsoid of the same volume and then converted back into the sphere. It is shown that at sufficiently large strain amplitudes, the deformation of the material involves localized plastic events that were identified based on the relative displacement of atoms before and after the shear transformation. We found that the density profiles of cage jumps decay away from the inclusion, which correlates well with the radial dependence of the local deformation of the material. At the same strain amplitude, the plastic deformation becomes more pronounced in the cases of weakly damped dynamics or large time scales of the shear transformation. We showed that the density profiles can be characterized by the universal function of the radial distance multiplied by a dimensionless factor that depends on the friction coefficient and the time scale of the shear event.
pacs:
62.20.F-, 61.43.Fs, 83.10.RsI Introduction
Despite its long history, the prediction of mechanical response of amorphous materials, such as metallic or polymer glasses, remains an area of active research FalkRev10 ; ChengMa11 . The main challenge in this field is to fully characterize the dynamics of atomic scale rearrangements during plastic deformation of glasses BarratCh8 . These localized rearrangements were first observed by Argon and Kuo in two-dimensional bubble rafts Argon79 ; ArgonKuo . Later, Falk and Langer proposed a dynamical mean-field theory of low temperature shear deformation in amorphous solids in terms of the shear transformation zones, which accounts for many of the features seen in simulations, including strain hardening and yield stress Falk98 . A number of studies considered various criteria in order to identify regions susceptible to plastic rearrangement by examining the local density Bailey06 , elastic moduli dePablo04 ; Tsamados09 ; Procaccia10 , short range order Teichler02 ; Albano05 , and “soft spots” from the low-frequency vibrational modes Tanguy10 ; Manning11 ; Schoenholz14 . Athermal quasistatic simulations have clearly shown that heterogeneous plastic flow of two-dimensional amorphous solids involves quadrupolar localized rearrangements and system spanning shear bands Maloney06 ; Tanguy06 ; Tsamados10 ; Maloney12 .
Twenty years ago, Argon and Bulatov Bulatov94 developed a model where plastic flow was treated as a stochastic sequence of local inelastic rearrangements that interact via a long-range elastic field Eshelby57 . In this model, each local rearrangement results in a global stress drop and stress redistribution in its neighborhood, which in turn may drive nearby regions towards their instability threshold and cause secondary plastic events Bulatov94 . In particular, a transition from diffuse plastic flow at high temperatures to localized flow through shear bands at low temperatures was observed Bulatov94 . Recent molecular dynamics simulations of a two-dimensional amorphous system have shown that at finite shear rates long-range interactions between local rearrangements give rise to directional quasilinear avalanches Lemaitre09 .
More recently, the elastic response of a two-dimensional amorphous solid to a local shear transformation was studied using molecular dynamics simulations Puosi14 . The fictitious transformation due to an instantaneous displacement of about twenty particles within a circular region replicated an elementary plastic event in a sheared system. It was found that at small values of the shear strain, the averaged displacement field in the material agrees well with the predictions of the continuum elasticity theory in both the stationary and transient regimes Puosi14 . It was also shown that the propagation of the elastic signal varies from a diffusive transmission for strong damping to a propagative transmission in the case of weakly damped dynamics. One of the motivations of the current study is to investigate the effect of a local shear transformation on plastic deformation of a three-dimensional model glass.
The mechanical response of amorphous materials to oscillatory shear deformations was recently investigated experimentally Arratia13 ; Arratia14 ; Spaepen14 ; Cipelletti14 and by means of atomistic simulations Sastry13 ; Priezjev13 ; Reichhardt13 ; Priezjev14 . It was found that at small strain amplitudes, the amorphous systems gradually settle into dissipative limit cycles where particles are displaced periodically but then return to their original positions Sastry13 ; Reichhardt13 ; Arratia14 . Interestingly, the deformation process involves a number of localized plastic events that are reversible with each cycle Arratia13 ; Reichhardt13 ; Arratia14 . With increasing strain amplitude above a critical value, the rearrangement of particles becomes irreversible, leading to diffusive behavior Sastry13 ; Priezjev13 ; Reichhardt13 ; Arratia14 ; Priezjev14 . It was also shown that the structural relaxation process at finite temperatures involves intermittent bursts of clusters of particles undergoing large displacements Priezjev13 ; Cipelletti14 ; Priezjev14 .
In this paper, molecular dynamics simulations are carried out to study structural relaxation in an amorphous solid induced by a local shear transformation. We introduce a reversible transformation of a spherical inclusion in a quiescent system. From a physical point of view, this situation corresponds to a vibrating inclusion within an amorphous solid (for example, a cyclic thermal or mechanical deformation of an embedded inclusion in an amorphous matrix). The cage detection algorithm is used to identify large particle displacements during the shear event. The spatial distribution of cage jumps is analyzed for different damping conditions, strain amplitudes, and duration of the shear event, and then correlated with the amplitude of the local deformation of the material.
The rest of the paper is organized as follows. The description of molecular dynamics simulation model is given in the next section. In Sec. III, the results for the radial density profiles of cage jumps as a function of the strain amplitude, the shear transformation time scale, and the friction coefficient are presented. The conclusions are provided in the final section.
II Details of molecular dynamics simulations
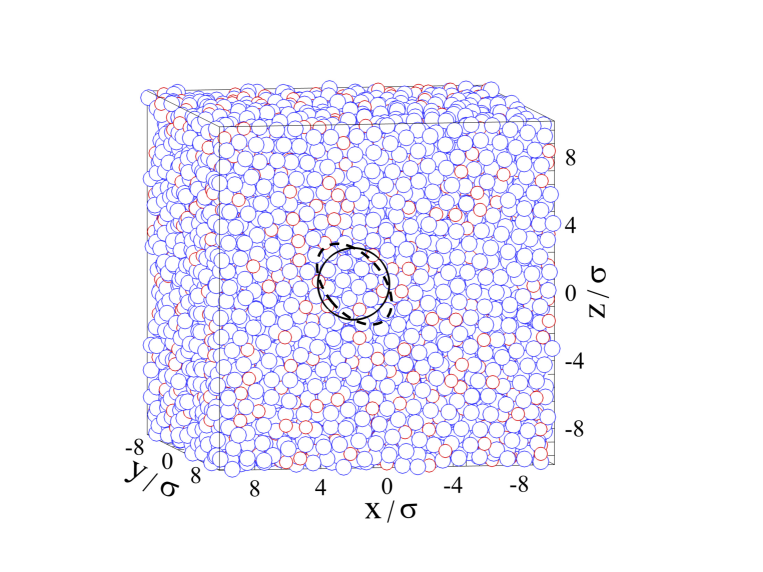
We consider a three-dimensional system composed of particles in a periodic box (see Fig. 1). The model glass is represented by the Kob-Andersen (KA) binary (80:20) mixture with non-additive interaction parameters of the Lennard-Jones (LJ) potential in order to avoid crystallization KobAnd95 . In the KA model, particles interact via the pairwise LJ potential
| (1) |
with the parameters , , , , , and . In all simulations, the cutoff radius was chosen to be twice the minimum position of the LJ potential, i.e., . The units of length, mass, and energy are defined , , and , and, therefore, the unit of time is .
The time evolution of the system is described by the Langevin dynamics. For example, the equation of motion in the direction is given by
| (2) |
where is the total interaction potential, is the friction coefficient, and is a random force with zero mean and variance determined by the fluctuation-dissipation theorem. The Langevin thermostat temperature is set , where is the Boltzmann constant. The equations of motion were integrated using the fifth-order Gear predictor-corrector algorithm Allen87 with a time step .
The model glass was confined into a cubic box with a fixed side length so that the total density remained constant. The glass transition temperature for the KA binary mixture at this density is about KobAnd95 . In our setup, periodic boundary conditions were implemented along all three directions. At first, the system was equilibrated for about MD steps at the temperature and then gradually quenched with the rate to the final temperature . The post-processing analysis was performed in independent samples.
The plastic deformation of the material was induced by a fictitious local shear transformation. In our simulations, the inclusion consists of about 135 atoms within a sphere of radius , which is located at the center of the simulation box (see Fig. 1). The system was first aged for about at the temperature , while the atoms within the inclusion were kept fixed. Then, the inclusion atoms were gradually displaced so that a sphere was transformed into an ellipsoid of the same volume. During this procedure, the major axis of the ellipsoid was always oriented parallel to the direction, as shown in Fig. 1. In the following, the ratio of the length of the ellipsoid semi-major axis and the sphere radius defines the shear strain of the transformation. The shear strain was varied during the time interval according to the following equation
| (3) |
where is the strain amplitude and is the time scale of the shear transformation. After , the inclusion atoms were fixed again at their original positions (before the transformation) and the system was equilibrated for additional , and then the average positions of all atoms were computed again. For each independent sample, the averaged atom positions before and after the shear transformation were stored and then analyzed to determine plastic deformation of the material.
III Results
In the absence of mechanical deformation, the atomic structure of the model glass lacks the long-range order characteristic of a crystal but retains the short-range order, where all atoms remain trapped inside cages formed by their neighbors KobAnd95 . When an amorphous material is strained, the onset of plastic deformation is governed by the localized collective rearrangements of small groups of atoms Falk98 . In this process, each rearrangement creates a long-range elastic field Eshelby57 that leads to a stress redistribution in the system and may drive a nearby region past its instability threshold, which in turn might trigger secondary shear transformations Lemaitre09 . In a driven system, however, this process is difficult to characterize BarratCh8 . An alternative approach to study the effects of the local rearrangement of atoms and propagation of the mechanical signal on the structural relaxation of the material is to apply an artificial shear transformation in a quiescent system Puosi14 .
In our study, the material was sheared by an artificial inclusion that consists of about atoms forming a sphere, which is located at the center of the simulation cell (see Fig. 1). The inclusion atoms do not interact with each other and undergo a reversible displacement during the time interval . In order to maintain the same density of the material, the inclusion was gradually deformed from a sphere into an ellipsoid of the same volume and then back to the sphere with the strain amplitude varied according to Eq. (3). We note that the reversible shear transformation described by Eq. (3) is different from the shear transformation considered in Puosi14 , where a group of atoms forming an inclusion were instantaneously displaced and fixed in the new position, thus mimicking an elementary plastic event occurring in deformed glasses. In our study, the analysis of the plastic deformation was based on the averaged atom positions before and after the shear transformation. Thus, the control parameters in the problem include the strain amplitude , the time scale of the shear transformation , and the friction coefficient that controls the damping term in Eq. (2).
As it was already mentioned in the previous study Puosi14 , if the strain amplitude of the reversible shear transformation of an artificial inclusion is below a few percent, then the material deforms elastically and the average relative displacement of atoms is less than about . In contrast, when the strain amplitude is sufficiently large, the deformation usually involves several localized plastic events. In our study, the strain amplitude is greater than , which typically results in a finite density of atoms that undergo large displacement upon a reversible shear transformation. These large displacements, or cage jumps, can be identified using the cage detection algorithm recently introduced by Candelier et al. BiroliPRL09 and tested for a number of two-dimensional systems BiroliEPL10 ; BiroliPRL10 . In this method, the effective distance between two segments of a particle trajectory is computed and then compared with a typical cage size. Similar to the earlier studies Priezjev13 ; Priezjev14 , in our analysis, a cage jump was detected if the effective distance between particle positions before and after the shear transformation is greater than ; otherwise, a particle returned to its cage.
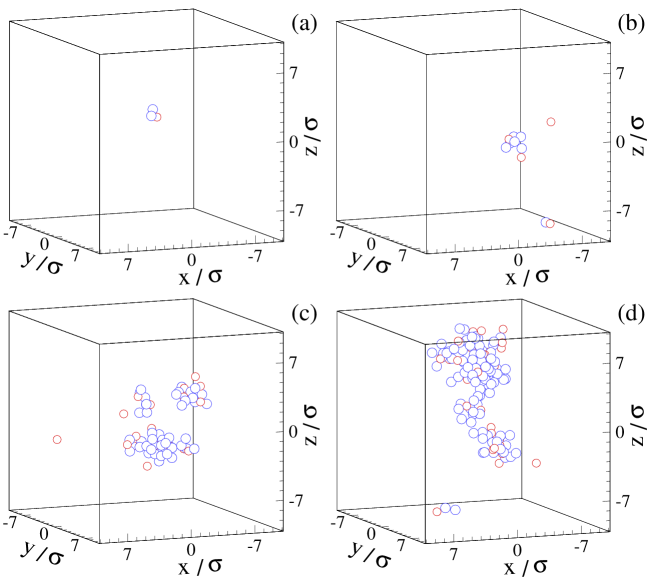
Examples of typical cage jump configurations are presented in Fig. 2 for different strain amplitudes of the induced shear transformation, which occurred during the time interval in a regime of intermediate damping . It can be seen that with increasing strain amplitude, the number of cage jumps increases and they tend to aggregate into compact clusters, although some mobile atoms appear to be isolated (see Fig. 2). In order to quantify the spatial distribution of cage jumps, we computed the radial density profiles, which were averaged in thin spherical shells of . When the radius of the shell was larger than half of the simulation box length, the volume of six spherical caps was subtracted from the volume of the shell to properly normalize the density profiles. Due to insufficient statistics, the data near the corners of the cubic box, , were not reported.
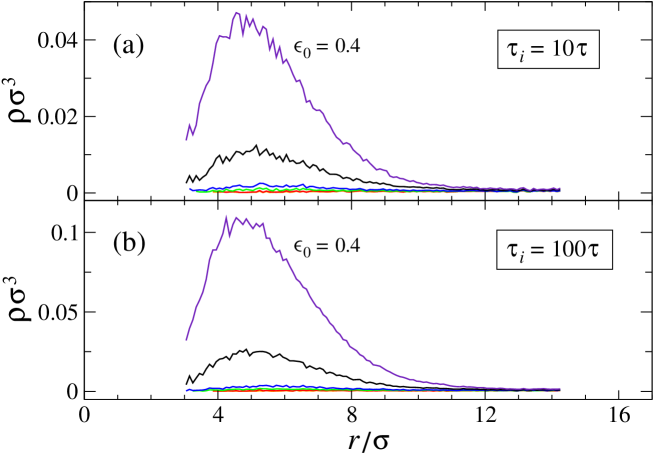
Figure 3 shows the representative radial density profiles of cage jumps for two values of the shear transformation time scale and . In both cases, the average density of cage jumps becomes larger as the strain amplitude increases, however, it remains much smaller than the density of the material, i.e., . Note that, somewhat unexpectedly, the density of cage jumps increases from up to about , despite a relatively large deformation of the material near the inclusion during the shear transformation process. This behavior can be explained by the fact that the outer surface of the inclusion is rough on the molecular scale, and, therefore, the atoms of the material in contact with the inclusion atoms have a part of their cages to be reversibly deformed, thus reducing the probability of irreversible displacement of adjacent atoms. This trend in the density profiles was observed for all control parameters in our study.
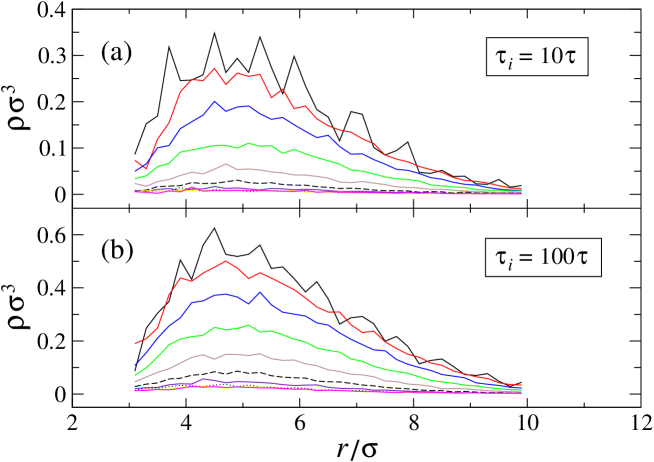
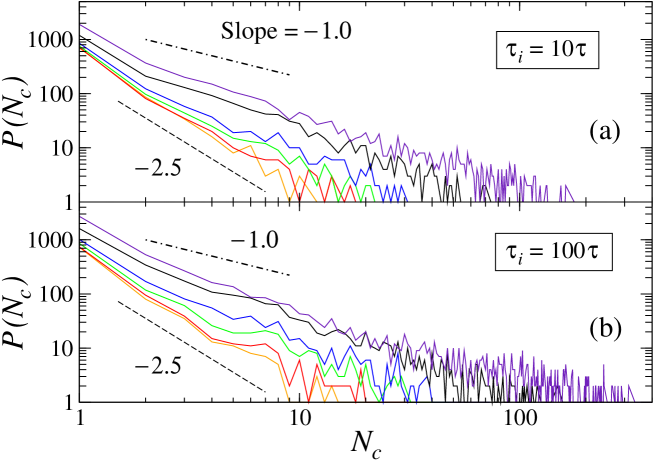
During the shear transformation process, the displacement field around the inclusion has a quadrupolar symmetry with respect to the major axis of the ellipsoid Procaccia13 , and, therefore, the distribution of cage jumps is not expected to be spatially isotropic. We next computed the radial density of cage jumps but averaged it within hollow cones with apex angles ranging from to . Figure 4 shows the radial density profiles of cage jumps for different values of the angle measured with respect to the major axis of the ellipsoid, which is oriented parallel to the vector . It could be seen that the data are somewhat noisy despite a relatively large strain amplitude . However, it is clear that the orientational dependence of the density profiles is highly anisotropic; the density is larger (smaller) in the direction parallel (perpendicular) to the major axis of the ellipsoid. Furthermore, as illustrated in Fig. 2, cage jumps tend to aggregate into clusters. The distribution of cluster sizes is reported in Fig. 5 for and . It is observed that cluster sizes are roughly power-law distributed with the slope varying from at small strain amplitudes to about for with the largest clusters of several hundred atoms.
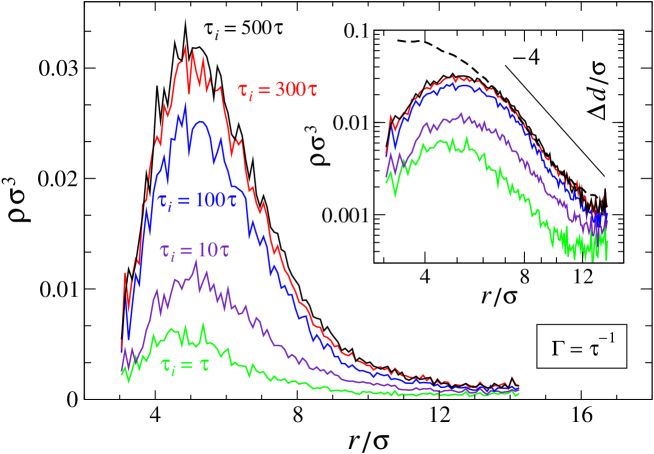
The local deformation of the material that facilitates cage jumps depends on how the mechanical signal propagates in the system and the time scale of the induced shear transformation. In Figure 6, we plot the radial density profiles of cage jumps for different values of in the regime of intermediate damping . It is evident that the density of cage jumps increases with increasing shear transformation time scale. When is small, then the amplitude of the local displacement field in the material during the shear event is smaller than it would be in the limit of quasistatic deformation; and, therefore, the probability of cage-to-cage jumps is reduced. In other words, for a given value of the strain amplitude , the largest particle displacement in the material occurs when the time scale of the shear transformation is larger than the time scale of the propagation of the deformation in the system. As shown in Fig. 6, with further increasing time scale of the shear event, i.e., , the density of cage jumps remains unchanged (within statistical uncertainty).
In order to establish a correlation between the density of cage jumps and deformation of the material during the shear event, we performed a set of separate simulations where the shear strain given by Eq. (3) was varied during the time interval up to a maximum value of . The numerical procedure was applied as follows. Similar to the case of the reversible shear transformation described in Sec. II, the binary glass was first equilibrated while the inclusion atoms were fixed within a sphere of radius . Next, the sphere was transformed into an ellipsoid of the same volume according to Eq. (3) during the time interval . When the maximum strain was attained, the inclusion atoms were fixed again and the system was allowed to evolve for . Then, the average atom positions were collected and the relative displacement of atoms during the sphere-to-ellipsoid transformation was analyzed.
The local deformation of the material after a sphere-to-ellipsoid transformation deviates from the elastic behavior at sufficiently large values of and typically involves several plastic events. Here, we introduce a measure of the local deformation, , based on the relative displacement of neighboring particles. In the undeformed glass, we first identify all tetrahedra formed by nearest-neighbor atoms with mutual distance less than . For each tetrahedron, the difference between the longest and shortest edges, , is computed. After the sphere-to-ellipsoid transformation, the quantity is determined again for the same tetrahedra. Finally, the measure of the local deformation, , is calculated for each tetrahedron by subtracting in the undeformed state from after the transformation, and then averaged over all tetrahedra and all realizations of disorder. In this definition, the quantity is insensitive to a pure rotation or translation of tetrahedra but it takes into account the relative displacement of neighboring atoms.
The radial dependence of the local deformation, , is plotted on a log-log scale in the inset of Fig. 6 along with the density profiles of cage jumps for . It can be seen that the decay of the density profiles for different values of correlates well with for . These results suggest that formation of cage jumps during the reversible shear event is determined by the amplitude of the local deformation of the material. Note that the density profiles are nearly constant at large distances due to periodic boundary conditions. We also comment that the slope of is rather insensitive to the exact value of in the range .
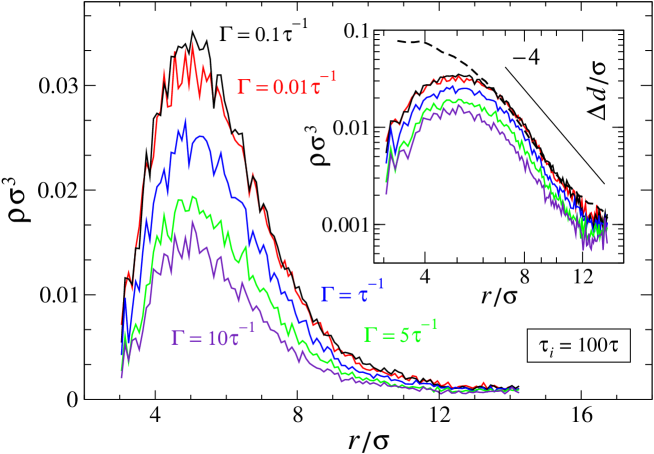
Furthermore, the effect of inertia on the density profiles of cage jumps is shown in Fig. 7 for the relatively large strain amplitude and time scale in order to obtain better statistics. It is observed that with decreasing friction coefficient, the density of cage jumps increases and it appears to saturate for . In the strongly damped cases, and , the propagation of the displacement field occurs at times longer than , which results in a smaller amplitude of the local strain and thus lower density of cage jumps. Similar transient behavior of the elastic response to a local shear transformation was reported in a two-dimensional model glass in the overdamped regime Puosi14 . In the case of weakly damped dynamics, , the transmission of the elastic signal in the system is faster than the duration of the shear event, which leads to the largest amplitude of the displacement field and highest density of cage jumps (shown in Fig. 7).
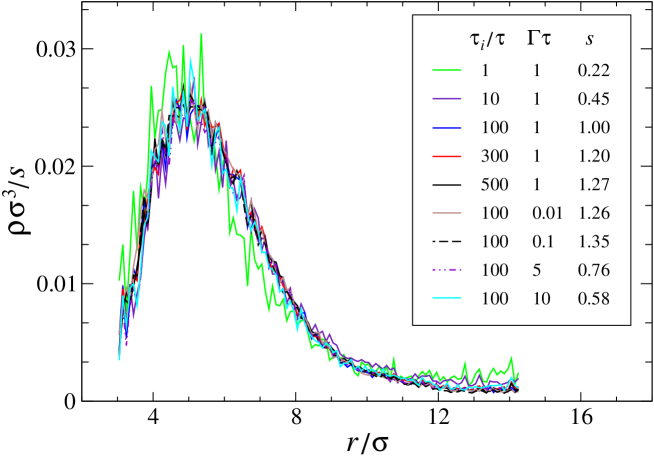
Finally, the data reported in Figs. 6 and 7 can be made to collapse onto a single master curve by plotting the density profiles as , where is a scaling factor. The rescaled density profiles are shown in Fig. 8 for the indicated values of , and . The collapse of the data is quite good, except for the case and , where the amplitude of the density profile is relatively small. The results in Fig. 8 suggest that the density profiles as a function of the distance , the friction coefficient , and the time scale of the shear event obey the remarkable factorization
| (4) |
in a wide range of parameters and . Thus, the shape of the density profiles is determined by the universal function , which exhibits a maximum within about two molecular diameters from the surface of the inclusion and follows a power-law decay at larger distances. Interestingly, the variation of the scaling factor is relatively small despite the fact that parameters and vary over about three orders of magnitude.
IV Conclusions
In summary, molecular dynamics simulations were performed to investigate the effect of a local shear transformation on plastic deformation of an amorphous solid. We considered a spherical inclusion, which was transformed into an ellipsoid with the major axis along one of the diagonals of a cubic box and then converted back into the sphere. At sufficiently large strain amplitudes, the deformation of the material typically involved several plastic events, which were analyzed based on the averaged atom positions before and after the shear transformation. Using the cage detection algorithm, the large particle displacements, or cage jumps, were identified and their spatial distribution was studied as a function of the strain amplitude, the time scale of the shear transformation, and the friction coefficient that controls the damping in the system.
We found that, in general, the density of irreversible cage jumps increases with increasing strain amplitude of the shear transformation. In a narrow region within about two particle diameters from the surface of the inclusion, the probability of cage jumps is reduced because of the strong influence of the inclusion atoms that undergo reversible displacements. It was also shown that cage jumps tend to aggregate into clusters that are approximately power-law distributed. The density profiles of cage jumps decay away from the center of the inclusion, which agrees well with the radial dependence of the local deformation of the material. Furthermore, due to the quadrupolar symmetry of the displacement field, the distribution of cage jumps is highly anisotropic with a preferred direction along the major axis of the ellipsoid. For a given strain amplitude, the density of cage jumps increases upon either increasing time scale of the shear event or decreasing friction coefficient. These trends were rationalized in terms of the maximum amplitude of the displacement field in the material during the shear transformation.
Acknowledgments
Financial support from the National Science Foundation (CBET-1033662) is gratefully acknowledged. Computational work in support of this research was performed at Michigan State University’s High Performance Computing Facility and the Ohio Supercomputer Center.
References
- (1) M. L. Falk and C. E. Maloney, Eur. Phys. J. B 75, 405 (2010).
- (2) Y. Q. Cheng and E. Ma, Prog. Mater Sci. 56, 379 (2011).
- (3) J.-L. Barrat and A. Lemaitre, “Heterogeneities in amorphous systems under shear,” Chapter 8 in the book Dynamical Heterogeneities in Glasses, Colloids, and Granular Media (Oxford University Press, 2011).
- (4) A. S. Argon, Acta Metall. 27, 47 (1979).
- (5) A. Argon and H. Kuo, Mater. Sci. Eng. 39, 101 (1979).
- (6) M. L. Falk and J. S. Langer, Phys. Rev. E 57, 7192 (1998).
- (7) N. P. Bailey, J. Schiotz, and K. W. Jacobsen, Phys. Rev. B 73, 064108 (2006).
- (8) K. Yoshimoto, T. S. Jain, K. van Workum, P. F. Nealey, and J. J. de Pablo, Phys. Rev. Lett. 93, 175501 (2004).
- (9) M. Tsamados, A. Tanguy, C. Goldenberg, and J.-L. Barrat, Phys. Rev. E 80, 026112 (2009).
- (10) S. Karmakar, A. Lemaitre, E. Lerner, and I. Procaccia, Phys. Rev. Lett. 104, 215502 (2010).
- (11) K. Brinkmann and H. Teichler, Phys. Rev. B 66, 184205 (2002).
- (12) F. Albano and M. Falk, J. Chem. Phys. 122, 154508 (2005).
- (13) A. Tanguy, B. Mantisi, and M. Tsamados, Europhys. Lett. 90, 16004 (2010).
- (14) M. L. Manning and A. J. Liu, Phys. Rev. Lett. 107, 108302 (2011).
- (15) S. S. Schoenholz, A. J. Liu, R. A. Riggleman, and J. Rottler, Phys. Rev. X 4, 031014 (2014).
- (16) C. E. Maloney and A. Lemaitre, Phys. Rev. E 74, 016118 (2006).
- (17) A. Tanguy, F. Leonforte, and J.-L Barrat, Eur. Phys. J. E 20, 355 (2006).
- (18) M. Tsamados, Eur. Phys. J. E 32, 165 (2010).
- (19) K. M. Salerno, C. E. Maloney, and M. O. Robbins, Phys. Rev. Lett. 109, 105703 (2012).
- (20) V. V. Bulatov and A. S. Argon, Model. Simul. Mater. Sci. Eng. 2, 167 (1994).
- (21) J. D. Eshelby, Proc. Roy. Soc. London A 241, 376 (1957).
- (22) A. Lemaitre and C. Caroli, Phys. Rev. Lett. 103, 065501 (2009).
- (23) F. Puosi, J. Rottler, and J.-L. Barrat, Phys. Rev. E 89, 042302 (2014).
- (24) N. C. Keim and P. E. Arratia, Soft Matter 9, 6222 (2013).
- (25) N. C. Keim and P. E. Arratia, Phys. Rev. Lett. 112, 028302 (2014).
- (26) K. E. Jensen, D. A. Weitz, and F. Spaepen, Phys. Rev. E 90, 042305 (2014).
- (27) E. D. Knowlton, D. J. Pine, and L. Cipelletti, Soft Matter 10, 6931 (2014).
- (28) D. Fiocco, G. Foffi, and S. Sastry, Phys. Rev. E 88, 020301(R) (2013).
- (29) N. V. Priezjev, Phys. Rev. E 87, 052302 (2013).
- (30) I. Regev, T. Lookman, and C. Reichhardt, Phys. Rev. E 88, 062401 (2013).
- (31) N. V. Priezjev, Phys. Rev. E 89, 012601 (2014).
- (32) W. Kob and H. C. Andersen, Phys. Rev. E 51, 4626 (1995).
- (33) M. P. Allen and D. J. Tildesley, Computer Simulation of Liquids (Clarendon, Oxford, 1987).
- (34) R. Candelier, O. Dauchot, and G. Biroli, Phys. Rev. Lett. 102, 088001 (2009).
- (35) R. Candelier, O. Dauchot, and G. Biroli, Europhys. Lett. 92, 24003 (2010).
- (36) R. Candelier, A. Widmer-Cooper, J. K. Kummerfeld, O. Dauchot, G. Biroli, P. Harrowell, and D. R. Reichman, Phys. Rev. Lett. 105, 135702 (2010).
- (37) R. Dasgupta, O. Gendelman, P. Mishra, I. Procaccia, and C. A. B. Z. Shor, Phys. Rev. E 88, 032401 (2013).