CNRS, IPAG, F-38000 Grenoble, France 3535institutetext: Department of Physics and Astronomy, The University of Leicester, University Road, Leicester, LE1 7RH, United Kingdom 3636institutetext: Nicolaus Copernicus Astronomical Center, ul. Bartycka 18, 00-716 Warsaw, Poland 3737institutetext: Institut für Physik und Astronomie, Universität Potsdam, Karl-Liebknecht-Strasse 24/25, D 14476 Potsdam, Germany 3838institutetext: Laboratoire d’Annecy-le-Vieux de Physique des Particules, Université de Savoie, CNRS/IN2P3, F-74941 Annecy-le-Vieux, France 3939institutetext: DESY, D-15738 Zeuthen, Germany 4040institutetext: Universität Erlangen-Nürnberg, Physikalisches Institut, Erwin-Rommel-Str. 1, D 91058 Erlangen, Germany 4141institutetext: Centre for Astronomy, Faculty of Physics, Astronomy and Informatics, Nicolaus Copernicus University, Grudziadzka 5, 87-100 Torun, Poland 4242institutetext: Department of Physics, University of the Free State, PO Box 339, Bloemfontein 9300, South Africa 4343institutetext: Charles University, Faculty of Mathematics and Physics, Institute of Particle and Nuclear Physics, V Holešovičkách 2, 180 00 Prague 8, Czech Republic 4444institutetext: GRAPPA, Institute of High-Energy Physics, University of Amsterdam, Science Park 904, 1098 XH Amsterdam, The Netherlands
Long-term monitoring of PKS 2155304 with ATOM and H.E.S.S.: investigation of optical/-ray correlations in different spectral states
In this paper we report on the analysis of all the available optical and very high-energy -ray (200 GeV) data for the BL Lac object PKS 2155$-$304, collected simultaneously with the ATOM and H.E.S.S. telescopes from 2007 until 2009. This study also includes X-ray (RXTE, Swift) and high-energy -ray (Fermi-LAT) data. During the period analysed, the source was transitioning from its flaring to quiescent optical states, and was characterized by only moderate flux changes at different wavelengths on the timescales of days and months. A flattening of the optical continuum with an increasing optical flux can be noted in the collected dataset, but only occasionally and only at higher flux levels. We did not find any universal relation between the very high-energy -ray and optical flux changes on the timescales from days and weeks up to several years. On the other hand, we noted that at higher flux levels the source can follow two distinct tracks in the optical flux–colour diagrams, which seem to be related to distinct -ray states of the blazar. The obtained results therefore indicate a complex scaling between the optical and -ray emission of PKS 2155$-$304, with different correlation patterns holding at different epochs, and a -ray flux depending on the combination of an optical flux and colour rather than a flux alone.
Key Words.:
Radiation mechanisms: non-thermal — Galaxies: active — BL Lacertae objects: PKS 2155304 — Galaxies: jets — Gamma rays: galaxies1 Introduction
Blazars are those active galactic nuclei (AGNs) for which the observed radiative output is dominated by a broadband non-thermal emission of a relativistic jet pointing at a very small angle to the line of sight (e.g. Begelman et al., 1984; Urry & Padovani, 1995). This emission, strongly Doppler-boosted in the observer’s rest frame, extends from radio up to high-energy (HE) and very high-energy (VHE) rays, and is strongly variable on different timescales from years down to minutes (e.g. Wagner & Witzel, 1995). The spectral energy distribution (SED) of blazars is characterized by two distinct components manifesting as low- and high-energy peaks in the representation (where is the frequency and is the corresponding flux). The established model for the broadband blazar emission ascribes the low-energy spectral component to the synchrotron radiation of ultra-relativistic electrons accelerated within the inner parts of a magnetized jet (sub-parsec and parsec scales). The high-energy component is widely believed to be due to the inverse-Compton (IC) emission of the same electron population, involving either jet synchrotron photons as seeds for the IC scattering (synchrotron self-Compton model, SSC; e.g. Konigl, 1981; Marscher & Gear, 1985), or various photon fields originating outside of a jet (external-Compton models; e.g. Dermer et al., 1992; Sikora et al., 1994). The emerging picture is that the SSC model is the most appropriate for blazars of the BL Lacertae type which accrete at lower rates than in other blazars and as such lack intense circumnuclear photon fields, while the external-Compton scenarios are best applied in modelling quasar-hosted blazars known for their high accretion rates and rich circumnuclear environment (see e.g. Ghisellini et al., 2010). The high-energy peak can be alternatively modelled in the framework of hadronic scenarios (see e.g. Böttcher, 2007). The frequency of the synchrotron peak in blazars spectrum defines the classification for low-, intermediate- and high-frequency-peaked objects (LBL, IBL, and HBL, respectively) (see, e.g. Padovani & Giommi, 1995; Fossati et al., 1998).
The sourcePKS 2155$-$304 (redshift ), classified as a HBL object is one of the brightest blazars in the southern hemisphere. It was discovered in the radio frequencies as part of the Parkes survey (Shimmins & Bolton, 1974), and identified as a BL Lac-type source by Hewitt & Burbidge (1980). Since then it has been the target of a number of X-ray monitoring programmes. These studies indicated a red-noise type of variability at X-ray frequencies with the characteristic variability timescale of the order of days, and only little power corresponding to intraday flux changes (Zhang et al., 1999, 2002; Tanihata et al., 2001; Kataoka et al., 2001). Frequent X-ray flares are typically characterized by symmetric profiles, superimposed short ( ks) smaller-amplitude flickering, and a variety of soft and hard lags changing from epoch to epoch. The amplitude of the variability correlates with both the flux of the source and the photon energy. The X-ray spectral variations are consistent with the ”harder-when-brighter” behaviour (Zhang et al., 2005, 2006b; Abramowski et al., 2012).
As a particularly bright BL Lac object, PKS 2155$-$304 was also targeted by several extensive optical/UV studies (Courvoisier et al., 1995; Pesce et al., 1997; Pian et al., 1997). These campaigns established the intraday variability nature of the source with the shortest flux doubling timescales of about min, detected, however, in only a few isolated epochs (Paltani et al., 1997; Heidt et al., 1997). The red-noise type of optical variability, comparable to that observed at X-ray frequencies, persists up to variability timescales of about 3 years (Kastendieck et al., 2011). In several epochs a clear bluer-when-brighter evolution of the source has been found (Paltani et al., 1997), a behaviour that appears to beuniversal in BL Lac objects (see e.g. Carini et al., 1992; Ghisellini et al., 1997; Raiteri et al., 2001; Ikejiri et al., 2011).
A comparison between optical/UV and X-ray temporal and spectral characteristics of PKS 2155$-$304 indicates that the peak of its synchrotron continuum is located around UV frequencies, only occasionally shifting to longer (optical) wavelengths (see Foschini et al., 2008). In addition, the variability amplitudes at optical and UV frequencies are always significantly smaller than those observed at X-ray frequencies. In general, a variety of optical/UV–X-ray correlation patterns have been found in different epochs and datasets, although several authors have noted that such correlations are in general stronger and more pronounced at shorter variability timescales and during the enhanced activity epochs of the source: as the flux decreases and variability timescales get longer, the optical/UV–X-ray correlations become weaker, and at the same time the lags between flux changes at optical/UV and X-ray frequencies increase (see e.g. Brinkmann et al., 1994; Urry et al., 1997; Zhang et al., 2006a; Dominici et al., 2004; Osterman et al., 2007).
High-energy and very high-energy -ray emission of PKS 2155$-$304 was discovered with EGRET (Vestrand et al., 1995) in the energy range from 30 MeV to 10 GeV, and with the University of Durham Mark 6 telescope above 300 GeV (Chadwick et al., 1999), respectively. The first detection with the High Energy Stereoscopic System (H.E.S.S.) of the source was made during the July and October 2002 observations (Aharonian et al., 2005a). The first multiwavelength (MWL) campaign targeting the blazar and organized by the H.E.S.S. Collaboration was conducted in 2003 (Aharonian et al., 2005b). The source, found in its low state, was monitored simultaneously in four different bands: in X-rays with RXTE/PCA, in the optical range with ROTSE, at radio frequencies with the Nancay Radio Telescope, and in VHE rays with H.E.S.S. (with an incomplete array). No clear correlations between H.E.S.S. and lower-energy fluxes were found at that time. From 2004 until now PKS 2155$-$304 was frequently observed with the four H.E.S.S. telescopes, and this resulted in the detection of two exceptional -ray flares in July 2006, with the outburst flux 40 times the average flux, and flux doubling timescales in the VHE regime of the order of a few minutes (Aharonian et al., 2007). The MWL data collected around the time of the 2006 flares were presented and extensively discussed in Aharonian et al. (2009a) and Abramowski et al. (2012). These revealed a strong X-ray–VHE flux correlation at high flux levels, weakening however at lower flux levels, and characterized in addition by much smaller X-ray flux changes (factor of ) than those observed in the VHE range. No universal optical–VHE correlations were found in the 2006 flaring data.
Detailed statistical analysis of all the VHE data collected for PKS 2155$-$304 with H.E.S.S. during the period 2005-2007 was presented in Abramowski et al. (2010). The results of the analysis revealed again the red-noise type of the flux changes albeit with relatively short characteristic variability timescales day (in particular during the 2006 flaring period; see also Aharonian et al., 2007), the variability amplitude characterized by fractional r.m.s. correlated with the photon energy, and the excess r.m.s. correlated with the flux. The pronounced spectral changes in the VHE regime were found to be different for the low- and high-flux levels.
Between August 25 and September 6,2008 PKS 2155$-$304 was observed simultaneously with H.E.S.S., Fermi-LAT, RXTE and ATOM (Aharonian et al., 2009b). The source was found again in its low state, with the average GeV flux about of the flux from the Crab Nebula. The ‘night-by-night comparison’ of the VHE and optical fluxes at that time (11 days of observations) indicated, for the very first time in the case of this target, some hints of a positive correlation (Pearson’s correlation coefficient in the range 0.77-0.86 with uncertainties ). In support of the observed trend, the performed broadband SSC modelling confirmed for the broadly expected parameters of the source characterizing its quiescent periods, that these are indeed the electrons emitting synchrotron photons at optical frequencies which produce the bulk of the observed rays via the SSC process. These findings prompted us to analyse all the available optical and VHE data for the source collected simultaneously in 2007-2009 with the ATOM and H.E.S.S. telescopes, respectively, and in addition the X-ray and high-energy -ray data. Except for the short time interval between August 25 and September 6, 2008 discussed in Aharonian et al. (2009b), the MWL data presented here have not been published before.
2 Observations and data analysis
During the last years, PKS 2155$-$304 has been observed multiple times at different frequencies. In this paper we analyse the 2007-2009 data collected with H.E.S.S. in VHE -rays (see Sect.,2.1), Fermi-LAT in HE rays (Sect.,2.2), RXTE in X-rays (Sect.,2.3), and the ATOM telescope in the optical band (Sect.,2.4).
2.1 VHE -ray data from H.E.S.S.
The H.E.S.S. telescopes are designed to observe rays with energies between 100 GeV and 100 TeV, located in Namibia, near the Gamsberg mountain (see Aharonian et al., 2006). Until 2012 the instrument consisted of four Imaging Atmospheric Cherenkov telescopes, now it is an array of five telescopes.
The blazarPKS 2155$-$304 has been observed frequently with H.E.S.S. during each visibility window (May to December) since 2004, being routinely detected on a nightly basis. The data analysed here correspond to all the available observations collected from 2007 to 2009 by an array configuration with three or four telescopes. The data were selected using standard data-quality selection criteria, and this resulted in 12 nights of observations in 2007 (MJD54293-54375), 25 nights in 2008 (MJD54620-54715), and 12 nights in 2009 (MJD55005-55043). We note that the night exposures of PKS 2155$-$304 with H.E.S.S. consist typically of one or a few observational runs, each about 28 minutes long. The data were calibrated using the standard H.E.S.S. calibration method; loose cuts were used for event selection (Aharonian et al., 2006) and the background estimated using the reflected background method (Berge et al., 2007). The standard Hillas analysis (Aharonian et al., 2006) was applied, and the VHE spectra for the different epochs considered were derived using a forward-folding maximum likelihood method (Piron et al., 2001). Similar results to those presented below (Sect.,3) were also obtained using an alternative analysis method (Becherini et al., 2011) and an independent calibration chain.
2.2 HE -ray data from Fermi-LAT
The Fermi Gamma-ray Space Telescope was launched in 2008 June 11. The Large Area Telescope (LAT) onboard the Fermi satellite is a pair conversion telescope sensitive to photons in a very broad energy band from MeV to GeV, uniformly scanning the entire sky every three hours (Atwood et al., 2009).
The LAT observations analysed in this paper include all the data taken from the mission start to MJD54716 (for 2008), as well as the more recent data simultaneous with and fully overlapping the H.E.S.S. exposure of the target in 2009. The LAT Science Tools version v9r31 with the response function P7SOURCE_V6 were used for the LAT data reduction. For the spectral analysis only the events with zenith angle less than and in the energy range from 100 MeV up to 100 GeV were selected, with region of interest (ROI) centred on PKS 2155$-$304. The binned maximum likelihood method (Mattox et al., 1996) was applied in the analysis. The maximum zenith angle cut is chosen to exclude time periods, when part of the region of interest is close to the Earth’s Limb, resulting in elevated background levels. The Limb gamma-ray production by cosmic ray interactions in the Earth’s atmosphere is discussed by Ackermann et al. (2013). The Galactic diffuse background was modelled using the gll_iem_v05 map cube and the extragalactic diffuse and residual instrument backgrounds were All the sources from the Fermi-LAT Second Source Catalog (2FGL, Nolan et al., 2012) inside the ROI of PKS 2155$-$304 were modelled. The sources from 2FGL, which were outside the ROI but bright enough to have an impact on the analysis have also been modelled.
2.3 X-ray data from RXTE
In 2008 and 2009 PKS 2155$-$304 was observed in X-ray range with the Proportional Counter Array (PCA) detector onboard the Rossi X-ray Timing Explorer (RXTE) satellite (Bradt et al., 1993). The 2008 observations discussed here were presented previously in Aharonian et al. (2009b). The unpublished data were collected in July 28 and 31, 2009. For the RXTE/PCA data analysis HEASOFTv6.12 software package was used.
2.4 Optical data from ATOM
Active Galactic Nuclei targeted with H.E.S.S. are monitored with the 75 cm Automatic Telescope for Optical Monitoring (ATOM) located in Namibia at the H.E.S.S. site. The telescope has been operational since November 2006, and is conducting observations in four different filters: (440 nm), (550 nm), (640 nm) and (790 nm). The detailed description of the instrument can be found in Hauser et al. (2004).
The ATOM data analysed in this paper correspond to integration times between 60 s and 200 s for each daily exposure. The photometric flux scale was calibrated using reference stars from the Landessternwarte (Universität Heidelberg, Königstuhl) AGN finding charts111http://www.lsw.uni-heidelberg.de/projects/extragalactic/charts; the photometric accuracy achieved is between mag and mag for and filters. In addition to the standard automatic analysis of the collected data, all the raw images were also checked manually, and data taken during bad weather conditions were rejected from the final dataset. The observed magnitudes have been corrected against the Galactic extinction based on the model from Schlegel et al. (1998) with the most recent recalibration by Schlafly & Finkbeiner (2011), using the NED Extinction Calculator ( mag, mag). In the analysis presented below, the data are also corrected for the contribution of the host galaxy, using the template of an elliptical galaxy provided by Fukugita et al. (1995) and observations in Gunn filter obtained by Falomo et al. (1991), with an assumed de Vaucouleurs profile of the starlight. The measured brightness of PKS 2155$-$304 was transformed to the ATOM aperture of using Eq. (4) in Young (1976).
| Year | ||||||
|---|---|---|---|---|---|---|
| [day] | [day] | [ erg cm-2s-1] | [ erg cm-2s-1] | |||
| 0.188 0.015 | 0.166 0.015 | 3.37 0.10 | 3.97 0.17 | 2.12 0.40 | 1.93 0.33 | |
| 0.117 0.016 | 0.127 0.017 | 5.65 1.00 | 7.63 0.57 | 1.50 0.18 | 1.30 0.17 | |
| 0.288 0.018 | 0.278 0.017 | 6.48 0.64 | 7.51 0.28 | 1.51 0.44 | 1.28 0.37 | |
| 0.327 0.018 | 0.308 0.016 | 4.43 0.46 | 5.16 0.36 | 1.05 0.34 | 0.88 0.29 |
3 Results
3.1 VHE and optical lightcurves
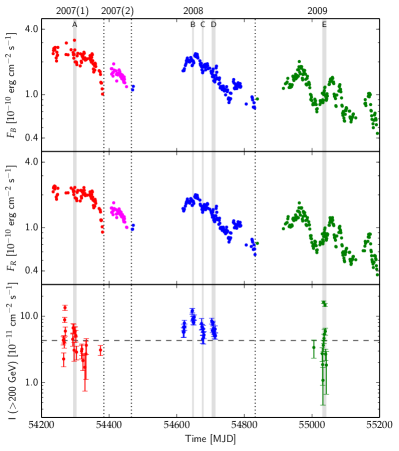
The three-year (2007-2009) lightcurves of PKS 2155$-$304 in and filters are shown in Figure 1 (upper and middle panels). The colour coding in the figure corresponds to the different years of observations and these are the epochs corresponding roughly to the subsequent H.E.S.S. visibility windows. In the case of the 2007 data, we divide them further into 2007(1) and 2007(2) sub-epochs (denoted by red and magenta symbols, respectively), with the borderline date MJD54385, as justified by the results of the analysis presented below. We note that there were no H.E.S.S. data taken during 2007(2). The average energy fluxes in both filters over the analysed intervals are given in Table 1.
The VHE -ray lightcurve of the source for the same time period is shown in the lower panel of Figure 1. Each point in the presented lightcurves corresponds to one night of observation, but integration times differ between the optical and VHE exposures.
3.2 Colour vs. flux diagram
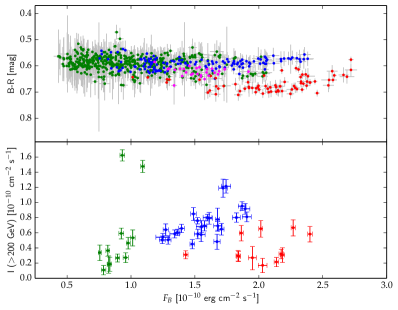
The diagram illustrating the colour vs. -band energy flux for PKS 2155$-$304 during the analysed period 2007-2009 is presented in Figure 2. As shown, at the higher flux levels two distinct branches appear in the diagram: the ‘upper’ branch corresponding predominantly to the 2008 epoch, and the ‘lower’ branch consisting exclusively of the data collected during the 2007(1) epoch and displaying steeper optical spectra (i.e. larger values of the optical spectral index defined for the flux spectral density as ). Both branches are similarly characterized by a flattening of the optical continuum with increasing fluxes, although this ‘bluer–when–brighter’ trend is pronounced for the lower branch only at magnitudes mag, corresponding roughly to the energy fluxes erg cm-2 s-1. The effect can be quantified by the colour-flux Pearson’s correlation coefficients: we derive for the 2008 epoch regardless on the flux level, while and for the 2007(1) epoch taking into account the mag and mag datapoints, respectively.
Since the distinct lower branch in the colour–flux diagram consists of a single-epoch dataset only, care must be taken to check if it is not an artefact of particular weather conditions affecting optical flux measurements. For this purpose we have carefully investigated the ATOM data taken for the other blazars (PKS 2005489 and H 2356309) during the same nights as the 2007-2009 data for PKS 2155$-$304. In all the cases various flux and colour changes were observed, for sources other than PKS 2155$-$304 the 2007(1) epoch does not show separation in the colour–flux diagrams. Distinct colour–flux states are also not observed for the comparison star, which is separated on the sky from PKS 2155$-$304 by arcmin, and which is always present on the same raw images as the blazar. One of the comparison stars has been used as a reference to test the reality of this effect. Thus, we can exclude atmospheric effects as playing a significant role, and conclude that the two distinct optical states manifesting as two branches on the colour-flux diagram at high flux levels are intrinsic to the studied object.
3.3 Optical variability characteristics
In order to characterize quantitatively the mean variability of PKS 2155$-$304 in the optical band during the analysed period, we calculate the fractional r.m.s. of the source defined as
| (1) |
where is the mean flux of measurements, is the mean square error, and is the variance (e.g. Edelson et al., 2002). The value of is calculated in the and bands separately for the different epochs considered, and the results are given in Table 1. As shown, the higher-flux 2007(1) epoch is characterized by a smaller value of the fractional r.m.s. () when compared with the dimmer (on average) 2008 and 2009 epochs (), although the difference is only modest, and as such should not be over-emphasized. The fractional variability amplitudes derived by Bonning et al. (2012) in different optical filters for PKS 2155$-$304 observed with SMARTS in the years 2008-2010 are in agreement with the values provided here. We note that the amplitudes of the optical flux changes observed here are smaller than those typically observed in PKS 2155$-$304 at X-ray or VHE -ray energies, even during quiescent states of the source.
Another parameter characterizing the source variability is the doubling/halving timescale, which provides an important constraint on the spatial scale of the dominant emission region through the causality requirement. This doubling timescale, , may be evaluated as either (i) the smallest value of the quantity
| (2) |
where is a flux of the source at the time for all pairs of points in the lightcurve, or (ii) the mean of the five smallest within the whole dataset (see e.g. Zhang et al., 1999). The two corresponding different values of in the -band for all the considered epochs are given in Table 1. As shown, the 2007(1) epoch is characterized by marginally shorter flux doubling timescales than the subsequent epochs. On the other hand the derived values are smaller than flux doubling timescales claimed by Chatterjee et al. (2012) for the source based on the SMARTS 2008-2010 data ( 22-33 days). It should be stressed that doubling timescales shorter than a day could not be investigated in the presented dataset, as the analysed non-uniformly sampled lightcurves of the source are binned in one-night intervals and hence, according to Equation 2 above, day. We can therefore neither claim nor exclude a presence of intra-day optical flux changes in PKS 2155$-$304 during the analysed period.
3.4 Optical–VHE -ray correlations
The VHE -ray light curve of PKS 2155$-$304 (photon flux ) is shown in the lower panel of Figure 1, where all the selected H.E.S.S. observation runs are combined to derive nightly flux values. The corresponding VHE -ray flux changes as a function of the -band energy flux of the source are presented in the lower panel of Figure 2. The plot shows only the nights when both optical and VHE -ray data are available.
Both the uneven sampling of the lightcurves at optical and VHE frequencies, as well as different integration times between the optical and VHE exposures, complicate the analysis of the optical–VHE -ray flux correlations. We note here again that in Aharonian et al. (2009b) a positive Pearson’s correlation coefficient between the VHE and optical bands was derived for 12 days of simultaneous observations. In the case of the entire 2007-2009 dataset analysed in this paper, some general positive correlation seems to be present in the lower panel of Figure 2, albeit only at low optical flux level, as the correlation is apparently absent for the higher-flux/steep-spectrum state (‘lower branch’ in Figure 2 corresponding to the 2007(1) epoch).
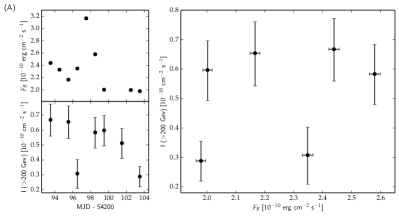
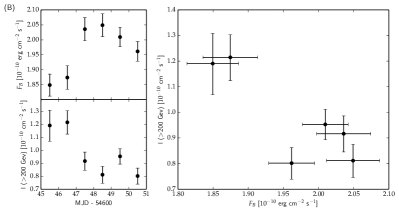
Within the whole analysed 2007-2009 dataset, in addition to the campaign discussed in Aharonian et al. (2009b) and denoted below as ‘interval D’, there are four other intervals (hereafter ‘A-C’ and ‘E’) with simultaneous night-by-night observations involving more than four consecutive nights (in some cases with one-day gaps). These are all presented in different panels of Figure 3. The correlation coefficients and correlation slopes derived for these intervals are listed in Table 2. As shown in the figure and quantified in the table, there is no universal relation between VHE -rays and the optical flux changes on a weekly timescale: the fluxes are correlated on some occasions, but uncorrelated or even anti-correlated on the other occasions. Hence, we conclude that there is not always a positive correlation between the optical and the VHE and that the one reported by Aharonian et al. (2009b) was particular to the state of the source at this epoch.
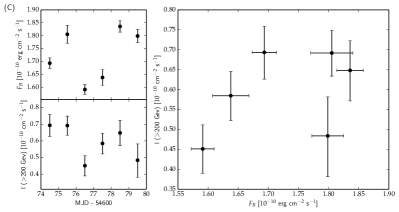
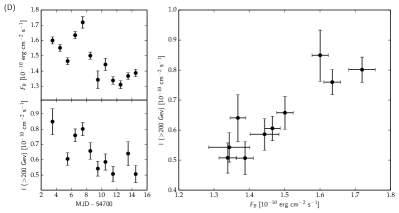
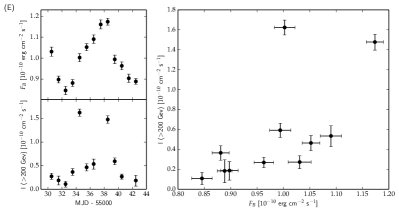
| Interval | Time [MJD] | Correlation coefficient | Correlation slope | Chance probability |
|---|---|---|---|---|
| A | 5429454304 | 0.29 0.23 | – | – |
| B | 5464654651 | 0.84 0.33 | 0.22 | |
| C | 5467554680 | 0.43 0.31 | – | – |
| D | 5470454715 | 0.89 0.24 | 0.05 | |
| E | 5503155043 | 0.63 0.10 | 0.22 |
Similarly, no strict correlation between the VHE -ray fluxes and optical colours can be found for PKS 2155$-$304 during the analysed 2007-2009 period. On the other hand, distinct spectral states of the source discussed in the previous sections (§ 3.2-3.3) are recovered in the VHE flux vs. colour diagram shown in Figure 4.
3.5 Broadband SEDs
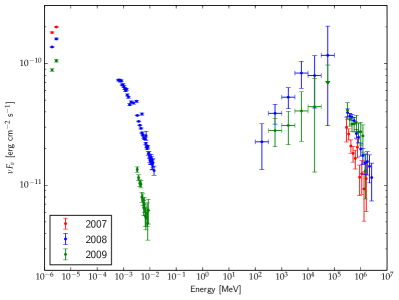
Figure 5 presents the quasi-simultaneous broadband SEDs of PKS 2155$-$304 corresponding to the 2007, 2008, and 2009 epochs (red, blue, and green symbols, respectively). In the figure we included the VHE -ray data from H.E.S.S. corrected for the absorption on the extragalactic background light (EBL) using the EBL model by Domínguez et al. (2011), HE -ray data from Fermi-LAT, X-ray data from Swift and RXTE, and the optical data from ATOM ( and bands), all analysed as described in § 2 and below, and corresponding to the observation dates provided in Table 3.
The H.E.S.S. spectra for different epochs considered are reliably fitted by the power-law model , where is the normalization of the differential photon flux and is the photon index. The derived model parameters are given in Table 4 for the fixed photon energy TeV. The Fermi-LAT spectra were derived here as described in § 2.2, and modelled with power-law distributions with the normalization MeV-1 s-1 cm-2 (for GeV) and the photon index in 2008, and MeV-1 s-1 cm-2 and in 2009. The constant fit to HE light curve during the two analysed epochs returns in 2008 and in 2009. The average RXTE/Swift spectra of PKS 2155$-$304 for the 2008 epoch are taken from Aharonian et al. (2009b). The 2009 X-ray spectrum was derived from the archival RXTE data (see § 2.3), and fitted with a power-law model with a normalization of keV-1 s-1 cm-2 and the X-ray photon index .
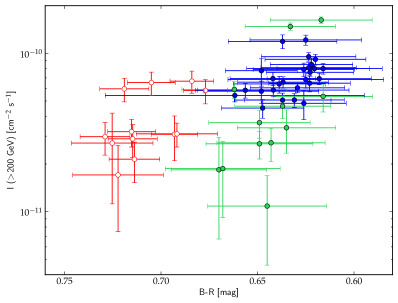
Figure 5 shows that the year-averaged broadband spectra of PKS 2155$-$304 during the analysed period 2007-2009 are characterized by only moderate flux changes at optical, X-ray, HE, and VHE -ray frequencies. However, while a systematic spectral hardening accompanied by the decrease in the total flux can be seen in the optical range between 2008 and 2009, the X-ray spectrum steepens during the same time interval (at least within the RXTE band). In the HE and VHE -ray regimes the uncertainties in the derived values of the photon indices and fluxes are relatively large, precluding therefore any definitive statements on spectral changes, although it seems that these are very minor, if present at all. The 2007(1) epoch remains distinct in the SED representation, because it is characterized by the highest flux and the softest spectrum in the optical range, but at the same time the lowest flux in the VHE range. Unfortunately, no simultaneous X-ray or HE -ray data exist for this epoch.
Another point to notice in Figure 5 is that the overall shape of the ‘two-bump’ optical–to–-ray continuum suggests the peak of the synchrotron spectral component is located around optical/UV frequencies, while the peak of the IC component is located in the HE range. In addition, the synchrotron peak luminosities are very roughly comparable to (but still higher than) the IC peak luminosities for every year considered, so that the bulk of the radiatively dissipated power of the source is emitted at optical/UV frequencies. These are the typical characteristics of an HBL source in its average/quiescent state in general. The caveat to the above comments is a very likely multicomponent character of the broadband spectrum of PKS 2155$-$304 (see Abramowski et al., 2012, and Sect.,4 below).
| Year | Month | H.E.S.S. | Fermi-LAT | RXTE | Swift | ATOM |
| 2007 | June | 14-20 | – | – | – | 20 |
| July | 12-13,15-16, 18-21, 23 | – | – | – | 13,15-16, 18,21, 23 | |
| August | 6-7, 9-11, 13-16, 19 | – | – | – | 6-7, 9-11, 13-16, 19 | |
| October | 1-2 | – | – | – | 1-2 | |
| 2008 | June | 3-7, 29-30 | – | – | – | 5,6, 29-30 |
| July | 1-5, 26-31 | – | – | – | 1-4, 26-28 | |
| August | 1-4, 22-31 | 22-31 | 25-31 | 25-31 | 1,2,4, 23-31 | |
| September | 1-6 | 1-6 | 1-5 | 1-5 | 1-6 | |
| 2009 | June | 24 | 24 | – | – | 24 |
| July | 19-29, 31 | 19-29, 31 | 28, 31 | – | 19-29, 31 |
4 Discussion and conclusions
After the pioneering detections of the brightest HBLs with the previous-generation Cherenkov telescopes, the X-ray/VHE -ray connection was widely studied and analysed in the context of multiwavelength variability of BL Lac objects. The first extensive campaigns revealed that the X-ray and VHE -ray flux changes are closely related, although the exact correlation patterns emerging from the collected datasets seemed to vary from object to object and from epoch to epoch even for the same source (e.g. Krawczynski et al., 2004; Błażejowski et al., 2005; Fossati et al., 2008). These results regarded, however, almost exclusively flaring states of the brightest objects only, as limited sensitivity of the previously available instruments precluded the detection of the dimmer sources or the bright ones in their quiescent states. The situation has changed recently thanks to the operation of the modern-generation Cherenkov telescopes (H.E.S.S., MAGIC, VERITAS), which enabled frequent and less biased (with respect to the flaring activity) observations of bright HBLs, as well as the detections of the dimmer (in the VHE range) blazars in particular ‘low-frequency peaked’ BL Lac objects (LBLs) (e.g. Albert et al., 2007). These new observations revealed or at least suggested positive correlations between the optical and VHE -ray frequencies for many objects, and indeed, the broadband modelling of TeV BL Lac objects in their quiescent states, like Mrk 501 and Mrk 421 (Abdo et al., 2011a, b, respectively) or PKS 2155$-$304 itself (Aharonian et al., 2009b), is consistent with the idea that these are electrons emitting synchrotron photons at optical frequencies which produce the bulk of the observed rays via the SSC process.
The ATOM and H.E.S.S. observations presented and discussed in this paper constitute the most detailed up-to-date insight into the optical–VHE -ray connection for the HBL-type blazar PKS 2155$-$304, spanning a period of three years. During that time, the source was transitioning from its flaring to quiescent optical states, and was characterized by only moderate flux changes at different wavelengths and a synchrotron dominance (energy flux ratio ). The observed optical–VHE correlations are rather convoluted. In particular, we did not find any universal relation between the flux changes in both bands on the timescales from days and weeks up to years. We did find, however, two distinct states of the source at higher optical fluxes, characterized by different optical colours and possibly also different -ray spectral properties.
In the context of the results of our analysis, it is important to note that during the exceptional VHE outbursts of PKS 2155$-$304 in 2006, when ultra-fast variability at -ray frequencies was detected and the source displayed a significant Compton-dominance (Aharonian et al., 2007), no optical–VHE correlations were present (Aharonian et al., 2009a), with the possible exception of the delayed and small-amplitude optical echo (Abramowski et al., 2012). Such states are rare however, not only in the case of PKS 2155$-$304, but also for the other VHE-detected BL Lac objects. And analogously, the states with high-amplitude ultra-fast optical variability also seem to be restricted to rare isolated epochs (Paltani et al., 1997; Heidt et al., 1997). The bulk of the time-averaged radiatively dissipated power of BL Lac objects is therefore released during the extended periods of a source quiescence, characterized by moderate flux changes and longer variability timescales. This general picture is confirmed by the long-term monitoring of PKS 2155$-$304 at different frequencies revealing that the typical state of the source corresponds to the lower-activity epochs with the characteristic variability timescales of the order of a few/several days in X-rays (e.g. Kataoka et al., 2001), and months in optical (Kastendieck et al., 2011). This is exactly the state probed by the observations presented and analysed in this paper.
| Year | ||||||
| (1) | (2) | (3) | (4) | (5) | (6) | (7) |
| 2007 | 3.40 0.09 | 2.48 0.09 | – | – | – | – |
| 2008 | 3.35 0.04 | 4.30 0.07 | 1.75 0.08 | 5.08 0.54 | – | – |
| 2009 | 3.12 0.06 | 5.20 0.18 | 1.88 0.13 | 2.63 0.43 | 3.21 0.16 |
What we find, however, is that even the average state of PKS 2155$-$304 is characterized by complex multiwavelength correlation patterns. Some general trends observed could be explained, at least qualitatively, assuming a modulation in the internal parameters of a single dominant emission zone within the outflow. Higher magnetization, for example, would correspond to the state with the elevated synchrotron luminosity, steeper optical spectrum due to the increased synchrotron cooling rate, but little or no increase in the observed -ray flux, as observed during the first half of 2007. At the same time, a more detailed insight into the data, revealing that the optical and VHE -ray fluxes are correlated for some epochs but uncorrelated or even anti-correlated for the other epochs, may indicate that this dominant emission zone is not a single uniform entity. Instead, it may consist of a superposition of various distinct emission components, characterized by a wider range of the internal parameters. The reason for the formation of such components is uncertain, but relativistic reconnection events and MHD instabilities enabling an enhanced energy dissipation, and generating particle beams or compact blobs moving relativistically within the outflow, are the widely invoked possibilities, particularly in the context of ultra-rapid -ray variability of blazar sources (see e.g. Boutelier et al., 2008; Lenain et al., 2008; Abramowski et al., 2012).
5 Summary
In this paper we presented the results of the analysis of all the available optical and VHE -ray data for PKS 2155$-$304 collected simultaneously with the ATOM and H.E.S.S. telescopes from 2007 until 2009. The gathered data constitute the most detailed and up-to-date insights into the optical–VHE -ray connection for this blazar over the period of three years. During the analysed period, the source was transitioning from its flaring to quiescent optical states, and was characterized by only moderate flux changes at different wavelengths and a ‘bluer–when–brighter’ optical behaviour pronounced at higher flux levels. There is, however, no universal relation between the VHE -ray and the optical flux changes on the timescales from days and weeks to years, as only during the particular epochs is a positive correlation seen. At higher optical flux levels the source can enter a distinct state characterized by a steep optical spectrum and a low -ray activity. We argue that the obtained results suggest a complex structure of the dominant emission zone in the PKS 2155$-$304 jet during the quiescent state, possibly by analogy to the multicomponent emission models discussed before in the context of the spectacular -ray outbursts of the source in July 2006.
Acknowledgements.
The support of the Namibian authorities and of the University of Namibia in facilitating the construction and operation of H.E.S.S. is gratefully acknowledged, as is the support by the German Ministry for Education and Research (BMBF), the Max Planck Society, the French Ministry for Research, the CNRS-IN2P3 and the Astroparticle Interdisciplinary Programme of the CNRS, the U.K. Science and Technology Facilities Council (STFC), the IPNP of the Charles University, the Czech Science Foundation, the Polish Ministry of Science and Higher Education, the South African Department of Science and Technology and National Research Foundation, and by the University of Namibia. We appreciate the excellent work of the technical support staff in Berlin, Durham, Hamburg, Heidelberg, Palaiseau, Paris, Saclay, and in Namibia in the construction and operation of the equipment. A.W. acknowledge support from the National Science Center (grant No. 2011/03/N/ST9/01867).References
- Abdo et al. (2011a) Abdo, A. A., Ackermann, M., Ajello, M., et al. (Fermi-LAT Collaboration). 2011a, ApJ, 727, 129
- Abdo et al. (2011b) Abdo, A. A., Ackermann, M., Ajello, M., et al. (Fermi-LAT Collaboration). 2011b, ApJ, 736, 131
- Abramowski et al. (2012) Abramowski, A., Acero, F., Aharonian, F., et al. (H.E.S.S. Collaboration). 2012, A&A, 539, A149
- Abramowski et al. (2010) Abramowski, A., Acero, F., Aharonian, F., et al. (H.E.S.S. Collaboration). 2010, A&A, 520, A83
- Ackermann et al. (2013) Ackermann, M., Ajello, M., Albert, A., et al. 2013, Phys. Rev. D, 88, 082002
- Aharonian et al. (2009a) Aharonian, F., Akhperjanian, A. G., Anton, G., et al. (H.E.S.S. Collaboration). 2009a, A&A, 502, 749
- Aharonian et al. (2009b) Aharonian, F., Akhperjanian, A. G., Anton, G., et al. (H.E.S.S. Collaboration). 2009b, ApJ, 696, L150
- Aharonian et al. (2005a) Aharonian, F., Akhperjanian, A. G., Aye, K.-M., et al. (H.E.S.S. Collaboration). 2005a, A&A, 430, 865
- Aharonian et al. (2007) Aharonian, F., Akhperjanian, A. G., Bazer-Bachi, A. R., et al. (H.E.S.S. Collaboration). 2007, ApJ, 664, L71
- Aharonian et al. (2006) Aharonian, F., Akhperjanian, A. G., Bazer-Bachi, A. R., et al. (H.E.S.S. Collaboration). 2006, A&A, 457, 899
- Aharonian et al. (2005b) Aharonian, F., Akhperjanian, A. G., Bazer-Bachi, A. R., et al. (H.E.S.S. Collaboration). 2005b, A&A, 442, 895
- Albert et al. (2007) Albert, J., Aliu, E., Anderhub, H., et al. 2007, ApJ, 666, L17
- Atwood et al. (2009) Atwood, W. B., Abdo, A. A., Ackermann, M., et al. 2009, ApJ, 697, 1071
- Becherini et al. (2011) Becherini, Y., Djannati-Ataï, A., Marandon, V., Punch, M., & Pita, S. 2011, Astroparticle Physics, 34, 858
- Begelman et al. (1984) Begelman, M. C., Blandford, R. D., & Rees, M. J. 1984, Reviews of Modern Physics, 56, 255
- Berge et al. (2007) Berge, D., Funk, S., & Hinton, J. 2007, A&A, 466, 1219
- Błażejowski et al. (2005) Błażejowski, M., Blaylock, G., Bond, I. H., et al. 2005, ApJ, 630, 130
- Bonning et al. (2012) Bonning, E., Urry, C. M., Bailyn, C., et al. 2012, ApJ, 756, 13
- Böttcher (2007) Böttcher, M. 2007, Ap&SS, 309, 95
- Boutelier et al. (2008) Boutelier, T., Henri, G., & Petrucci, P.-O. 2008, MNRAS, 390, L73
- Bradt et al. (1993) Bradt, H. V., Rothschild, R. E., & Swank, J. H. 1993, A&AS, 97, 355
- Brinkmann et al. (1994) Brinkmann, W., Maraschi, L., Treves, A., et al. 1994, A&A, 288, 433
- Carini et al. (1992) Carini, M. T., Miller, H. R., Noble, J. C., & Goodrich, B. D. 1992, AJ, 104, 15
- Chadwick et al. (1999) Chadwick, P. M., Lyons, K., McComb, T. J. L., et al. 1999, ApJ, 513, 161
- Chatterjee et al. (2012) Chatterjee, R., Bailyn, C. D., Bonning, E. W., et al. 2012, ApJ, 749, 191
- Courvoisier et al. (1995) Courvoisier, T. J.-L., Blecha, A., Bouchet, P., et al. 1995, ApJ, 438, 108
- Dermer et al. (1992) Dermer, C. D., Schlickeiser, R., & Mastichiadis, A. 1992, A&A, 256, L27
- Domínguez et al. (2011) Domínguez, A., Primack, J. R., Rosario, D. J., et al. 2011, MNRAS, 410, 2556
- Dominici et al. (2004) Dominici, T. P., Abraham, Z., Teixeira, R., & Benevides-Soares, P. 2004, AJ, 128, 47
- Edelson et al. (2002) Edelson, R., Turner, T. J., Pounds, K., et al. 2002, ApJ, 568, 610
- Falomo et al. (1991) Falomo, R., Giraud, E., Melnick, J., et al. 1991, ApJ, 380, L67
- Foschini et al. (2008) Foschini, L., Treves, A., Tavecchio, F., et al. 2008, A&A, 484, L35
- Fossati et al. (2008) Fossati, G., Buckley, J. H., Bond, I. H., et al. 2008, ApJ, 677, 906
- Fossati et al. (1998) Fossati, G., Maraschi, L., Celotti, A., Comastri, A., & Ghisellini, G. 1998, MNRAS, 299, 433
- Fukugita et al. (1995) Fukugita, M., Shimasaku, K., & Ichikawa, T. 1995, PASP, 107, 945
- Ghisellini et al. (2010) Ghisellini, G., Tavecchio, F., Foschini, L., et al. 2010, MNRAS, 402, 497
- Ghisellini et al. (1997) Ghisellini, G., Villata, M., Raiteri, C. M., et al. 1997, A&A, 327, 61
- Hauser et al. (2004) Hauser, M., Möllenhoff, C., Pühlhofer, G., et al. 2004, Astronomische Nachrichten, 325, 659
- Heidt et al. (1997) Heidt, J., Wagner, S. J., & Wilhelm-Erkens, U. 1997, A&A, 325, 27
- Hewitt & Burbidge (1980) Hewitt, A. & Burbidge, G. 1980, ApJS, 43, 57
- Ikejiri et al. (2011) Ikejiri, Y., Uemura, M., Sasada, M., et al. 2011, PASJ, 63, 639
- Kastendieck et al. (2011) Kastendieck, M. A., Ashley, M. C. B., & Horns, D. 2011, A&A, 531, A123
- Kataoka et al. (2001) Kataoka, J., Takahashi, T., Wagner, S. J., et al. 2001, ApJ, 560, 659
- Konigl (1981) Konigl, A. 1981, ApJ, 243, 700
- Krawczynski et al. (2004) Krawczynski, H., Hughes, S. B., Horan, D., et al. 2004, ApJ, 601, 151
- Lenain et al. (2008) Lenain, J.-P., Boisson, C., Sol, H., & Katarzyński, K. 2008, A&A, 478, 111
- Marscher & Gear (1985) Marscher, A. P. & Gear, W. K. 1985, ApJ, 298, 114
- Mattox et al. (1996) Mattox, J. R., Bertsch, D. L., Chiang, J., et al. 1996, ApJ, 461, 396
- Nolan et al. (2012) Nolan, P. L., Abdo, A. A., Ackermann, M., et al. 2012, ApJS, 199, 31
- Osterman et al. (2007) Osterman, M. A., Miller, H. R., Marshall, K., et al. 2007, ApJ, 671, 97
- Padovani & Giommi (1995) Padovani, P. & Giommi, P. 1995, ApJ, 444, 567
- Paltani et al. (1997) Paltani, S., Courvoisier, T. J.-L., Blecha, A., & Bratschi, P. 1997, A&A, 327, 539
- Pesce et al. (1997) Pesce, J. E., Urry, C. M., Maraschi, L., et al. 1997, ApJ, 486, 770
- Pian et al. (1997) Pian, E., Urry, C. M., Treves, A., et al. 1997, ApJ, 486, 784
- Piron et al. (2001) Piron, F., Djannati-Atai, A., Punch, M., et al. 2001, in International Cosmic Ray Conference, Vol. 7, International Cosmic Ray Conference, 2601
- Raiteri et al. (2001) Raiteri, C. M., Villata, M., Aller, H. D., et al. 2001, A&A, 377, 396
- Schlafly & Finkbeiner (2011) Schlafly, E. F. & Finkbeiner, D. P. 2011, ApJ, 737, 103
- Schlegel et al. (1998) Schlegel, D. J., Finkbeiner, D. P., & Davis, M. 1998, ApJ, 500, 525
- Shimmins & Bolton (1974) Shimmins, A. J. & Bolton, J. G. 1974, Australian Journal of Physics Astrophysical Supplement, 32, 1
- Sikora et al. (1994) Sikora, M., Begelman, M. C., & Rees, M. J. 1994, ApJ, 421, 153
- Tanihata et al. (2001) Tanihata, C., Urry, C. M., Takahashi, T., et al. 2001, ApJ, 563, 569
- Urry & Padovani (1995) Urry, C. M. & Padovani, P. 1995, PASP, 107, 803
- Urry et al. (1997) Urry, C. M., Treves, A., Maraschi, L., et al. 1997, ApJ, 486, 799
- Vestrand et al. (1995) Vestrand, W. T., Stacy, J. G., & Sreekumar, P. 1995, ApJ, 454, L93
- Wagner & Witzel (1995) Wagner, S. J. & Witzel, A. 1995, ARA&A, 33, 163
- Young (1976) Young, P. J. 1976, AJ, 81, 807
- Zhang et al. (2006a) Zhang, Y. H., Bai, J. M., Zhang, S. N., et al. 2006a, ApJ, 651, 782
- Zhang et al. (1999) Zhang, Y. H., Celotti, A., Treves, A., et al. 1999, ApJ, 527, 719
- Zhang et al. (2002) Zhang, Y. H., Treves, A., Celotti, A., et al. 2002, ApJ, 572, 762
- Zhang et al. (2005) Zhang, Y. H., Treves, A., Celotti, A., Qin, Y. P., & Bai, J. M. 2005, ApJ, 629, 686
- Zhang et al. (2006b) Zhang, Y. H., Treves, A., Maraschi, L., Bai, J. M., & Liu, F. K. 2006b, ApJ, 637, 699