High velocity blue-shifted FeII absorption in the dwarf star-forming galaxy PHL293B: Evidence for a wind driven supershell?
Abstract
X-shooter and ISIS WHT spectra of the starforming galaxy PHL 293B also known as A2228-00 and SDSS J223036.79-000636.9 are presented in this paper.
We find broad (FWHM = 1000km/s) and very broad (FWZI = 4000km/s) components in the Balmer lines, narrow absorption components in the Balmer series blueshifted by 800km/s, previously undetected FeII multiplet (42) absorptions also blueshifted by 800km/s, IR CaII triplet stellar absorptions consistent with [Fe/H] and no broad components or blushifted absorptions in the HeI lines. Based on historical records, we found no optical variability at the 5 level of 0.02 mag between 2005 and 2013 and no optical variability at the level of 0.1mag for the past 24 years.
The lack of variability rules out transient phenomena like luminous blue variables or SN IIn as the origin of the blue shifted absorptions of HI and FeII. The evidence points to either a young and dense expanding supershell or a stationary cooling wind, in both cases driven by the young cluster wind.
keywords:
galaxies: abundances – galaxies: dwarfs1 Introduction
Early studies of emission line galaxies have shown that objects that spectroscopically resembled HII regions both in line emission intensities and widths, constituted about 80 per cent of total samples, the rest being galaxies of Seyfert type (see e.g. French, 1980, and references therein). Some of these objects are also characterised by their compacticity and blue excess as shown on photographic plates and represent the overlap between blue compact galaxies (BCG) and HII galaxies. PHL 293 B is one of these objects. It was found by Haro & Luyten (1962) in the “Palomar-Haro-Luyten” survey of faint blue objects. Kinman (1965) obtained its optical spectrum and described it as having a faint continuum with unresolved emission in the Balmer series and [OIII] 5007,4959 and 4363Å that makes of it, to our knowledge, one of the first detections of the [OIII]4363Å auroral line in a star forming galaxy. We nowadays recognize this fact as the one allowing a trustworthy derivation of the gas elemental abundances in regions of star formation showing an emission line spectrum. In the case of PHL 293 B, these abundances are amongst the lowest known, less than one tenth of the solar value (French, 1980; Izotov, Thuan & Stasińska, 2007; Asplund et al., 2009) and in the border line of what is considered to be an extremely metal deficient galaxy (e.g. Kunth & Östlin, 2000). The galaxy was included in the sample studied by French (1980) who lists its absolute magnitude and size as -13.6 and 0.2 kpc respectively. PHL 293B also looks compact in the images obtained by Cairós et al. (2001), and Geha et al. (2006) give an effective radius for this galaxy of only 0.4 kpc. Its absolute magnitude according to the Sloan Digital Sky Survey (SDSS) is, Mg = -14.77. These facts make of it a very low luminosity and compact HII galaxy.
One of the characteristics of HII galaxies is their high star formation rate that takes place in a very small volume and probably in short duration episodes, thus making these galaxies easily observable. Given the large value of the equivalent width of their emission lines, it is the current burst of star formation that dominates their luminosity at blue and visible wavelengths. The low metallicity of these objects guarantees that they are in a chemically unevolved stage probably similar to what is expected in galaxies at early cosmological times. The evolution of their massive young stars, responsible for the gas ionisation, is conditioned by their low metallicity as is probably the case for Pop III stars. The evolution of high mass stars is short and encompasses phases with intense episodes of mass loss, therefore the presence of low intensity broad components or wings in the otherwise narrow emission lines typical of star-forming regions (SFR), are relatively common in high S/N medium resolution spectra. Well known examples are: NGC 604, a giant HII region in the spiral galaxy M 33 (Díaz et al., 1987; Terlevich et al., 1996); NGC 5471, a giant HII region in the spiral galaxy M 101 (Castañeda, Vilchez, & Copetti, 1990), NGC 2363, a giant HII region in the irregular galaxy NGC 2366 (Roy et al., 1992; González-Delgado et al., 1994) and 30 Dor in the LMC, one of the largest extragalactic HII regions in the local universe (Melnick, Tenorio-Tagle, & Terlevich, 1999). This is also the case, as expected, for HII galaxies and strong line BCG (see e.g. Izotov et al., 1996), since it is the dominant star forming region that dominates their integrated spectra.
The most likely origin of the extended line wings observed in SFR is related to the evolution of very massive stars and the feedback processes between them and the surrounding interstellar medium. Given the large number of these stars present in a relatively small volume, it may be expected that the combination of their powerful winds gave rise to complex kinematical components in both permitted and forbidden lines. Also multiple supernova events have been invoked as the possible cause (see Roy et al., 1992, for the case of NGC 2363). However, some of these massive stars like Luminous Blue Variables (LBV), can be so luminous as to be capable of producing visible effects by themselves particularly in nearby resolved system and some of them may even end their lives as supernovae hence dominating for some time the galaxy luminosity output. This evolutionary path may be the one followed by the most massive stars of low metallicity for which the inefficiency of line-driven stellar winds would translate in a low mass-loss rate and failure in becoming a WR star. Some of these stars might be the progenitors of type IIn supernovae in which the narrow line spectrum arises from the interaction of the supernova blast wave with the circumstellar shell. These supernovae can be very luminous and also very long lived (Aretxaga et al. 1999; Smith et al. 2007).
Another mechanism accounting for the presence of low intensity broad line components in HII galaxies or BCG spectra may be mass accretion onto an intermediate-mass black hole (103 - 105 M☉). Up to now there are no bona fide low metallicity objects (about one tenth of solar) harbouring massive black holes. In fact, it is intrinsically difficult to identify these objects in commonly used diagnostic diagrams (e.g. Stasińska et al., 2006). The overlapping of their broad component H luminosities and those of supernovae and even stellar winds, makes this identification even harder. Yet, from the point of view of galactic evolution to firmly establish the existence of these objects would be of the greatest importance. In this sense the detection of X rays emission would be a major discriminant.
In this work we analyse recently obtained moderate to high resolution spectra of PHL 293B which is a low luminosity, low metallicity HII galaxy that shows low intensity broad wings and blue shifted narrow absorptions in the hydrogen recombination lines, in order to try to shed some light on their origin. §2 gives a description of the data, §3 presents the results obtained from them and §4 is devoted to their analysis. A discussion is presented in §5 and the conclusions of our work are given in §6.
2 Description of the data
PHL 293B, also known as HL 293B, Kinman’s dwarf, A2228-00 and SDSS J223036.79-000636.9 is a very low luminosity galaxy (MB = -14.37; Cairós et al., 2001) at a distance of 23.1 Mpc obtained from the radial velocity (Mould et al., 2000) taken from NASA/IPAC Extragalactic Database (NED) corrected for Virgo Infall, Great Attractor and Shapley, with a Hubble constant of 73 km s-1 Mpc-1. Its metallicity was first measured by French (1980) who gave a value of 12+log(O/H) = 7.78 and, more recently, by Izotov, Thuan & Stasińska (2007) who derive a value of 12+log(O/H) = 7.66 from SDSS data.
2.1 Spectroscopic data
We have compiled spectroscopic data of PHL 293B for 4 different epochs spanning more than 10 years. Archival spectroscopic data have been extracted from DR7 of the Sloan Digital Sky Survey (Abazajian et al., 2009), SDSS(J223036.79-000636.9); ESO VLT-UVES [Programme ID 70.B-0717(A)]; Science Verification (SV) VLT-X-shooter [ESO program 60.A-9442(A)]. To these data we have added new observations obtained with the ISIS spectrograph attached to the 4.2m WHT at the Observatorio del Roque de los Muchachos in the island of La Palma (Spain).
The data from SDSS were taken on the 22nd of August 2001 and cover the spectral range from 3800 to 9200Å at a resolution R = 1800-2200. The UVES data were obtained on the 18th of November 2002 in both the blue and red arms covering a total wavelength range from 3100 to 6800 Å with 0.2 Å spectral resolution. X-shooter (Vernet, 2011) observations were performed during Science Verification on the nights of the 16th August and 28th September 2009. The data simultaneously cover the spectral range from UV( Å) to K′ (2.5 m) and were reduced using the ESO Recipe Execution Tool (EsoRex) following standard procedures with minor adaptations for these SV data.
ISIS data were obtained on the 30th of November 2011 using an EEV12 detector attached to the blue arm of the spectrograph. The R300B grating was used covering the unvignetted wavelength range 4800-7200 Å (centred at = 6000 Å), giving a spectral dispersion of 0.86 Å/pixel which combined with a slit width of 1 arcsec yields a resolution of about 3.4 Å. The observations were made at paralactic angle, at an airmass of 1.3 and with a seeing of 0.5 arcsec. Several bias and sky flat-field frames were taken at the beginning and at the end of the night. In addition, two lamp flat-fields, before and after the observation, and one calibration lamp exposure were performed. The calibration lamp used was CuNe+CuAr. The spectra were processed and analysed with IRAF routines111IRAF: the Image Reduction and Analysis Facility is distributed by the National Optical Astronomy Observatories, which is operated by the Association of Universities for Research in Astronomy, Inc. (AURA) under cooperative agreement with the National Science Foundation (NSF). following standard procedures that include removal of cosmic rays, bias subtraction, division by a normalized flat-field and wavelength calibration. In the last step, the spectra were corrected for atmospheric extinction and flux calibrated. Four standard star observations were used: BD+17 4708, Wolf1346, G191B2B and Feige34 allowing a good spectrophotometric calibration with an estimated accuracy of about 5 per cent.
2.2 Photometric data
The photometric optical data was compiled from 3 different sources: the Catalina Sky Survey (CSS) second release (Drake et al., 2009) provides for PHL 293B, accurate magnitudes for 80 nights from April 2005 to October 2012. Most nights have 4 different observations inside one hour total observing time. In addition, the SDSS provides photometric parameters for the night of 22/08/2001, and Cairós et al. (2001) published their photometry for PHL 293B obtained in October 1988 with the 3.5m telescope of the Calar Alto Observatory (Spain). Kinman (1965) provides the earliest brightness estimates based on the Palomar Sky Survey (PSS) plates and photographic images taken with the Lick Observatory 20-inch Astrograph in 1949 and 1965 and at the prime focus of the Lick 120-inch telescope.
PHL 293B was observed also using the ACIS-S camera on board the Chandra X-rays observatory in 2009 september 25th. Data cover the energy range 0.4 - 10 keV and the exposure time was about 7.7 ks (ObsID 11294).
3 Results
3.1 Spectroscopy
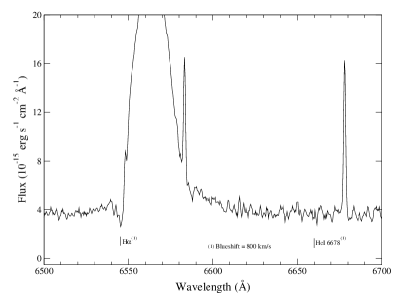
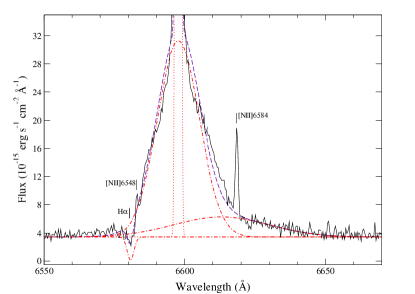
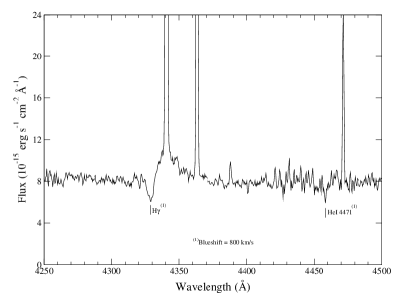
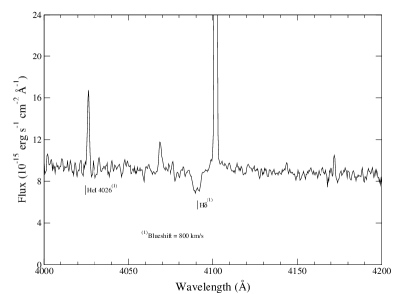
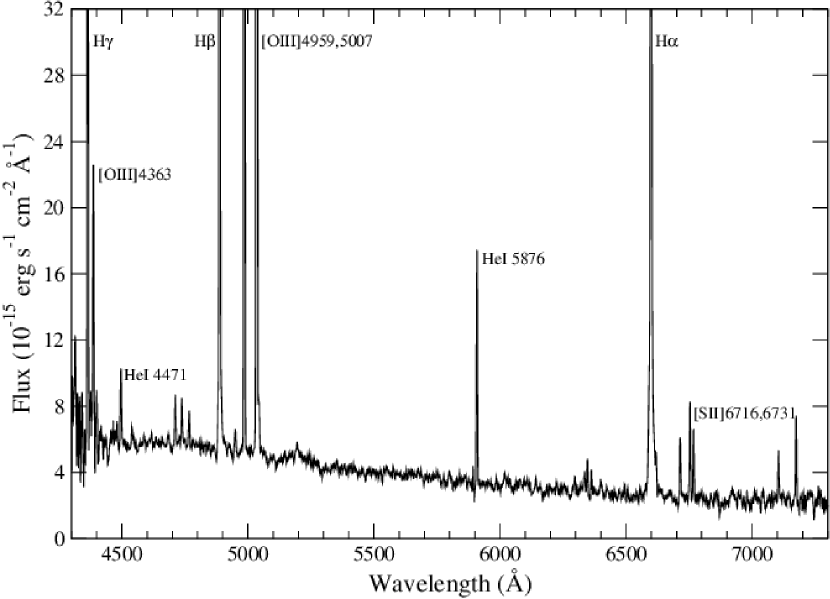
The blue to visual spectrum of PHL 293B shows the usual strong emission lines found in star-forming galaxies: recombination lines from hydrogen and helium and collisionally excited lines of different ions: [OII], [OIII], [NII], [SII], [SIII], etc. The most striking feature of the spectral lines is the presence of broad components in the hydrogen recombination lines, already reported by Izotov et al. (2007), which are undetected in the corresponding helium lines. These broad components that can be seen in Figures 1 through 5 for the Balmer lines: H, H, H and H, have FWHM between 1000 and 400 km/s (Izotov & Thuan, 2009; Izotov et al., 2011) and relatively low intensities. They are redshifted by about 50 km/s with respect to the narrow emission lines reference frame as determined by the centroid of the [OIII] 4959 Å line. Figure 2 shows a detail of the multigaussian fit performed on the X-shooter spectrum H profile. Details of measurements performed in SDSS and X-shooter spectra are listed in Tables 1 and 2, using the normal notation for equivalent widths as positive for lines in absorption, negative for emission. In what follows, we will call the reference frame defined by the [OIII] 4959 Å line, the galaxy reference frame. The fluxes in the narrow component of H and H (measured from the SDSS spectrum) are 4.86 and 1.54 10-14 erg s-1 cm-2 respectively and the ratio of broad to narrow components in both lines is about 0.25.
Errors in measurements depend strongly on flux uncertainties. Individual errors are determined from profile fitting routines. These errors rely on a good determination of errors present in the spectra, which is directly obtained for the SDSS spectra and had to be modeled for the X-shooter data. They are below 1% for radial velocity and 10% for dispersion determinations in strong narrow line profiles but can raise to tens of km s-1for broader components. Uncertainties in flux range from 3% in strong lines and/or components but can grow up to 20% in weak absorption lines. Equivalent widths share a few percent to 20% uncertainty based on relatively low counts level for the continuum flux.
From the X-shooter data the measured narrow line H and H fluxes are and erg s-1 cm-2, respectively. The ratio H/H between the narrow line components is the same in both spectra within the observational errors. The ratio between the narrow and broad components for these lines are also the same within the observational errors. Hence the differences in the flux measurements between the SDSS and the X-shooter spectra can be attributed to aperture effects. Since the aperture used for the SDSS observations is larger than the one used for the X-shooter one, we hereafter use the SDSS measurements for the line fluxes and EWs. Additional features of the Balmer lines are an ultra-broad component with FWZI 4000Km/s redshifted by about 500 km/s and a P Cygni like absorption blueshifted by 800 km/s with respect to the reference frame (see table 2).
To summarise, the complex H line profile shows a narrow component at the galaxy reference frame, a broad component FWHM 1000 km/s redshifted by about 50 km/s with respect to the galaxy reference frame, an ultra-broad component with FWZI 4000 km/s redshifted by about 500 km/s and a P Cygni like narrow absorption blueshifted by 800 km/s.
These features are also seen in the other Balmer lines, except for the ultra-broad component which is seen only as a red wing. A weak red wing is also visible in [OIII]5007Å corresponding possibly to the ultra-broad component. All these features are visible both in the X-shooter data analysed here and in the SDSS spectrum. The broad component represents about 20% of the total H emision flux. The blue shifted absorption is weaker in H than in the other Balmer lines, although the continuum is difficult to fit in the blue wing of H.
The HeI lines show only narrow components.
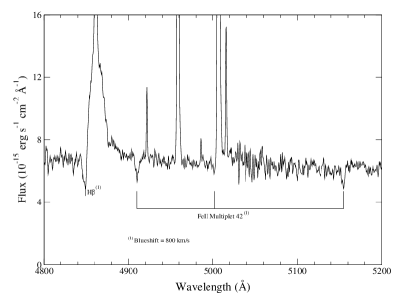
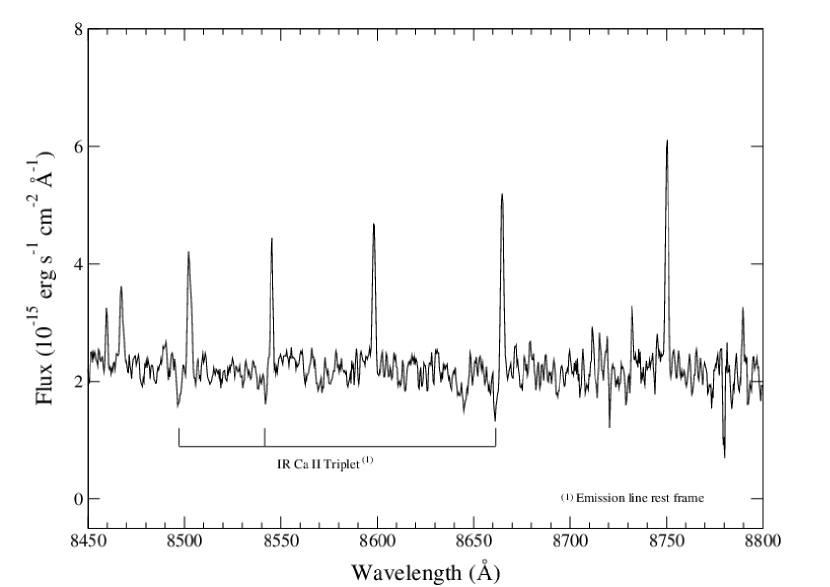
We have identified a conspicuous absorption feature at 5183 Å. This absorption line has no emission counterpart and coincides with the wavelength of the FeII multiplet 42 (laboratory wavelength 5169.03 Å) line blueshifted by the same 800 km/s displayed by the Balmer P Cygni like components. Companion lines of the same multiplet blueshifted by the same velocity have also been found at 5031, 4939 Å and they are indicated in Figure 3. Further absorption lines are observed in the far red spectral region, corresponding to the CaII triplet (CaT) lines at 8498, 8542, 8662 Å in the galaxy rest frame (see Figure 6). Although these lines, being close to the left of the adjacent Paschen lines at 8505, 8548, 8667 Å, can mimic P Cygni profiles, the CaII lines are clearly separated from the Paschen ones. Furthermore, there is no hint of a P Cygni like component in the 8601 Å Paschen line.
Although the X-shooter infrared spectrum is not a very good one, we can identify hydrogen recombination lines of the Paschen and Brackett series, HeI lines and a hint of the H2 line at 2.122 m rest frame. There is no evidence for broad components or P Cygni like profiles in any of these lines.
The WHT-ISIS spectrum covering from 4300 Å to 7500 Å (observations set-up described in §2.1) is shown in Figure 7. The strongest emission lines are labelled.
| Id. | Radial Vel. | Flux | EW | ||
|---|---|---|---|---|---|
| (Å) | km s-1 | km s-1 | 1014 erg s-1 cm-2 | (Å) | |
| FeII(42) 1 4924 | 4939.6 (0.5) | 955 (31) | 133 (33) | 1.0 (23%) | |
| FeII(42) 2 5018 | 5030.3 | 710: | 56: | 0.5: | |
| FeII(42) 3 5169 | 5183.0 (0.4) | 810 (20) | 33 (20) | 0.67 (23%) | |
| H | 4364.6 (0.02) | 1665 (1) | 59 (2) | 0.7 (1.5%) | -36 (1.5%) |
| H (narrow) | 4888.4 (0.01) | 1672 (1) | 25 (1) | 1.5 (1.2%) | -82 (1.2 %) |
| H (broad) | 4890.4 (0.5) | 1793 (30) | 321 (34) | 0.3 (8%) | -21 (8%) |
| H (absorption) | 4874.6 (0.3) | 818 (17) | 302 (19) | 1.1 (16%) | |
| H (narrow) | 6599.5 (0.01) | 1678 (1) | 36 (1) | 4.7 (0.5%) | -489 (0.5%) |
| H (broad) | 6601.2 (0.7) | 1756 (30) | 681 (33) | 1.3 (5%) | -138 (5%) |
| [OIII]5007 | 5034.8 (0.01) | 1675 (0.2) | 18.3 (0.1) | 8.6 (1%) | -594 (1%) |
| Id. | Radial Vel. | Flux | EW | ||
|---|---|---|---|---|---|
| (Å) | km s-1 | km s-1 | Relative to total line flux | (Å) | |
| H (absorption) | 4874.1 (0.1) | 789 (6) | 130 (11) | -0.01 | 2 (10%) |
| H (narrow) | 4887.0 (0.01) | 1582 (1) | 26 (01) | 0.84 | -96 (3%) |
| H (broad) | 4887.8 (0.2) | 1629 (12) | 466 (13) | 0.19 | -21 (2%) |
| FeII(42) 1 4924 | 4936.7 (0.2) | 777 (12) | 115 (15) | 1 (12%) | |
| FeII(42) 3 5169 | 5181.6 (0.2) | 733 (12) | 99 (15) | 1 (10%) | |
| [OIII]5007 | 5033.3 (0.002) | 1588 (0.1) | 22 (0.1) | -584 (1%) | |
| H (absorption) | 6580.8 (0.16) | 823 (7) | 91 (08) | -0.01 | 6 (10%) |
| H (narrow) | 6597.8 (0.02) | 1599 (1) | 17 (01) | 0.77 | -530 (3%) |
| H (broad) | 6598.2 (0.2) | 1620 (9) | 394 (10) | 0.20 | -136 (3%) |
| H (red wing) | 6617.7 | 2510 | 172 | 0.04 | -29 |
| Ca II 8498 | 8542.6 (0.2) | 1575 (5) | 30 (6) | 0.7 (17%) | |
| Ca II 8542 | 8587.7 (0.3) | 1604 (10) | 26 (10) | 0.4 (12%) | |
| Ca II 8662 | 8707.7 (0.1) | 1577 (3) | 24 (3) | 0.7 (13%) |
| Spectra | H | FeII(42) | [OIII]4959 | |||||||||
|---|---|---|---|---|---|---|---|---|---|---|---|---|
| 1 | 3 | |||||||||||
| Wav. | EqW | Vr | Wav. | EqW | Vr | Wav. | EqW | Vr | Wav. | Flux | EqW | |
| (Å) | (Å) | km s-1 | (Å). | (Å) | km s-1 | (Å). | (Å) | km s-1 | (Å). | (Å) | ||
| SDSS | 4847.3 | 1.1 | -866. | 4912.2 | 1.0 | -715. | 5154.5 | 0.67 | -843. | 4959.1 | 164 | -171. |
| UVES | 4848.1 | 2.0 | -816. | —- | —- | —– | 5154.7 | 0.88 | -832. | 4959.0 | 192 | -208. |
| XShooter | 4848.0 | 1.1 | -822. | 4910.8 | 0.91 | -800. | 5154.5 | 0.68 | -843. | 4959.0 | 186 | -197. |
| ISIS | 4847.9 | 1.0 | -829. | 4912.0 | 0.71 | -727 | 5154.7 | 0.57 | -832. | 4959.1 | 220 | -211. |
3.2 Photometry
We have extracted from the Catalina Sky Surveys (CSS) data release 2 database (Drake et al., 2009) 353 photometric points for PHL 293B corresponding to 91 observing nights over the 8.4 years from 16/5/2005 to 27/9/2013. Most nights have 4 independent observations inside a 60 minutes total span. Nightly averages are shown (plus symbols) in Figure 8 and have a typical r.m.s. scatter of 0.040 magnitudes. The yearly averages are shown with filled rhomboids. The average brightness for the whole dataset, indicated with a thin line, is 17.056 0.004.
The SDSS published Petrosian r magnitude is P17.04 0.01 which combined with the colour g-r=0.03 and the SDSS colour transformations yield a Petrosian v magnitude P17.07 0.01 observed on the 22/08/2001. The SDSS value is indicated with an x in Figure 8.
Cairós et al. (2001) provided an earlier photometric point for the object. Their October 1988 observation with the 3.5m telescope of the Calar Alto Observatory gives V=17.02 0.01.
Kinman (1965) published the earliest magnitude estimates for PHL 293B: m16.7. We quote from his paper: “a very rough estimate of the B magnitude is 17.7 on the Sky Survey plates and about a half magnitude fainter on the 120-inch plates”. Kinman attributes this difference to the scale difference between the PSS and the Lick 120-inch plates given that there is no variability between 1949 and 1965 in plates taken with the Lick 20-inch Astrograph. Bearing in mind that they are based on eye estimates of the PSS plates from 1949 and photographic images taken at the prime focus of the Lick Observatory 120-inch telescope in 1965, errors of about 0.5 magnitudes are expected.
There is no detection of X-rays emission in the ACIS-Chandra image. The point source sensitivity of this camera in the 0.4 to 6 keV energy range is erg cm-2 s-1 for an exposure time of 10 ks (Table 6.1 of The Chandra Proposers’ Observatory Guide, 2013). It gives for the PHL 293B Chandra observation of 7.7 ks a point source sensitivity of about erg cm-2 s-1.

4 Analysis
4.1 Ionising cluster age, mass and abundance
PHL 293B is a low luminosity (MB = -14.37; Cairós et al., 2001), low metallicity [12+log(O/H) = 7.61; Izotov et al. 2007] BCG. The comparison of our measured narrow H to H flux ratio with the case B recombination theoretical value yields a logarithmic extinction at H of c(H) = 0.12. For our SDSS flux measurements and the assumed distance of 23.1 Mpc (NED) this gives an extinction corrected H luminosity of 1.3 1039 erg s-1. The total Lyman continuum photon rate for a given region can be derived from the H luminosity (e.g. Leitherer & Heckman, 1995):
Taking into account that the number of Lyman continuum photons per unit mass of the ionising population decreases with age, and using the equivalent width of H (EW(H)) as an age parameter (Dottori, 1981), it is possible to calculate the mass of the ionising star cluster under certain assumptions about the initial mass function (IMF). For a Salpeter IMF with lower and upper mass limits of 0.8 and 120 M☉ respectively, we have (Díaz et al., 2000):
where the vertical bars indicates modulus.
For an EW(H) = -100 Å, that represents the total EW of H (see Table 1), the resulting ionising star cluster mass is Mion= 1.66 105 M☉.
According to the models of Mollá, García-Vargas, & Bressan (2009), an EW(H) = -100 Å may be produced by a cluster of 3.43105 M☉ with an age of about 7106 yr, for a metallicity of Z=0.0004 or a cluster of 2.06105 M☉ with an age of about 5106 yr, for a metallicity of Z=0.004. The ionised gas metallicity of PHL 293B is about Z=0.002, i.e. in between the values of the two models quoted, hence intermediate values for the mass of the ionising cluster and the age can be expected. The observed equivalent width may be affected by the continuum of an underlying older stellar population or a bright stellar component like for example a SN or an LBV; therefore it has to be considered as a lower limit for the equivalent width of the ionising cluster, and our mass and age estimates are in consequence upper limits.
4.2 CaT lines
The IR CaII triplet at nominal 8498, 8542, 8662 Å is clearly seen in absorption in the spectrum of PHL 293B (see Figure 6) at the same redshift shown by the narrow emission lines. The CaT index definition (Díaz, Terlevich & Terlevich, 1989; Terlevich, Díaz & Terlevich, 1990) that uses the two strongest lines of the triplet, measures approximately 2 Å, which, if taken literally, suggests [Fe/H] for giant or supergiant stars (see e.g. Díaz et al., 1989). This index has to be corrected for the contribution of the nebular continuum. For the model of log(age)=6.86 and Z=0.0004 chosen above, this contribution amounts to 0.55 Å per line and hence the corrected CaT index would be 3.1 Å, consistent with the values calculated by García-Vargas, Mollá, & Bressan (1998) from single stellar population synthesis models for the lowest abundance they consider, Z=0.004.
For the assumed mass, age and metallicity of the ionising cluster the models by Mollá et al. (2009) predict no WR stars and only one or two RSG stars.
4.3 Ionised gas mass
PHL 293B is unusual as an HII galaxy due to the presence of broad permitted and narrow forbidden lines in its optical spectrum. The absence of a strong broad forbidden [OIII]5007 component indicates that the density of the gas producing the broad component is high enough to collisionally de-excite [OIII]5007 (a condition for which the electron density has to be N). An upper limit to the mass of the ionised gas in the broad line region can be estimated using the observed L(H) (Macchetto et al., 1990) and the electron density lower limit,
therefore,
The ionized gas mass of the narrow line region is, assuming an electron density of 100 cm-3 (derived from the [SII] doublet ratio in our ISIS data),
similar to the ionising star cluster mass determined in §4.1.
4.4 Photometric Variability (or lack of it)
From the nightly averaged data (pluses) in Figure 8 no variability is detected. Dividing the data into 9 groups of one year duration each (filled diamonds in the same figure) reduces the r.m.s. scatter to 0.009 per group as expected for a non variable sample and again no systematic trend in the luminosity is apparent; furthermore a cursory analysis indicates that there is no periodic variation.
Based on the CSS data we can infer that at 3 level any long term variability, i.e. over a few years, cannot be larger than 0.02 magnitudes and that any medium term variability, i.e. over a few months, should be less than 0.04 magnitudes. Further still, including the data from Cairós et al. (2001), Kinman (1965) and SDSS we can safely conclude that there is no variability at the level of few tenths of magnitude over a period of 25 years.
5 Discussion
5.1 P Cygni profiles
To generate relatively narrow P Cygni like absorption profiles such as the ones observed in PHL 293B, the absorbing material must cover a substantial fraction of the continuum source, in this case a young stellar cluster several parsecs in size. These absorptions may be produced in an expanding dense supershell created by the interaction of combined stellar winds with the circumcluster medium. An expanding supershell has been postulated to explain the blueshifted metal absorption detected in the UV spectrum of several nearby and high redshift HII galaxies (Tenorio-Tagle et al., 1999; Mas-Hesse et al., 2003).
Alternatively the observed blueshifted narrow absorptions could be associated with a single star in a very luminous transient phase like an LBV or a SN IIn.
5.2 P Cygni profiles and the HeI lines
The possibility that the P Cygni like profiles in PHL 293B are originated in the powerful wind of an LBV has been extensively discussed by Izotov et al. (2011). These authors suggested that the absorptions seen at 4939 Å and 5031Å are in fact the blue shifted absorptions associated with the HeI lines at rest wavelengths 4921 Å and 5016 Å in accordance with the P Cygni profile of the Balmer lines.
Figure 9 shows the spectral regions around the HeI optical lines from the X-shooter data. The dotted line corresponds to a blueshift of 800 km s-1 consistent with what is observed in the Balmer lines. The top row displays all the HeI lines with the same flux scale in order to show the relative importance of the emissions. The bottom row shows the spectra normalised to the same amplitude for the emission line and the continuum to illustrate the differences in strength of the associated absorptions.
It is clear that while the HeI 4921 Å emission is the weakest, the absorption to the blue is the strongest and furthermore it is redshifted with respect to the 800 km s-1 line. Izotov et al. (2011) attributed this difference in velocity between Balmer and HeI lines P Cygni like profiles to the different formation depth of the core of each line in an accelerated wind. However there are several difficulties with this suggestion. Firstly the broad absorption to the blue of HeI 4921 Å has an equivalent width similar to that of the P Cygni like absorption of , probably too large to be associated with such a weak HeI line. Secondly, it is not clear why much stronger HeI lines like 5876, 6678 and 7065 Å do not show a blueshifted absorption as can be seen in figure 9, although HeI 5876Å seems to have, at the noise level, an associated weak absorption.

5.3 The absorption lines of FeII multiplet 42
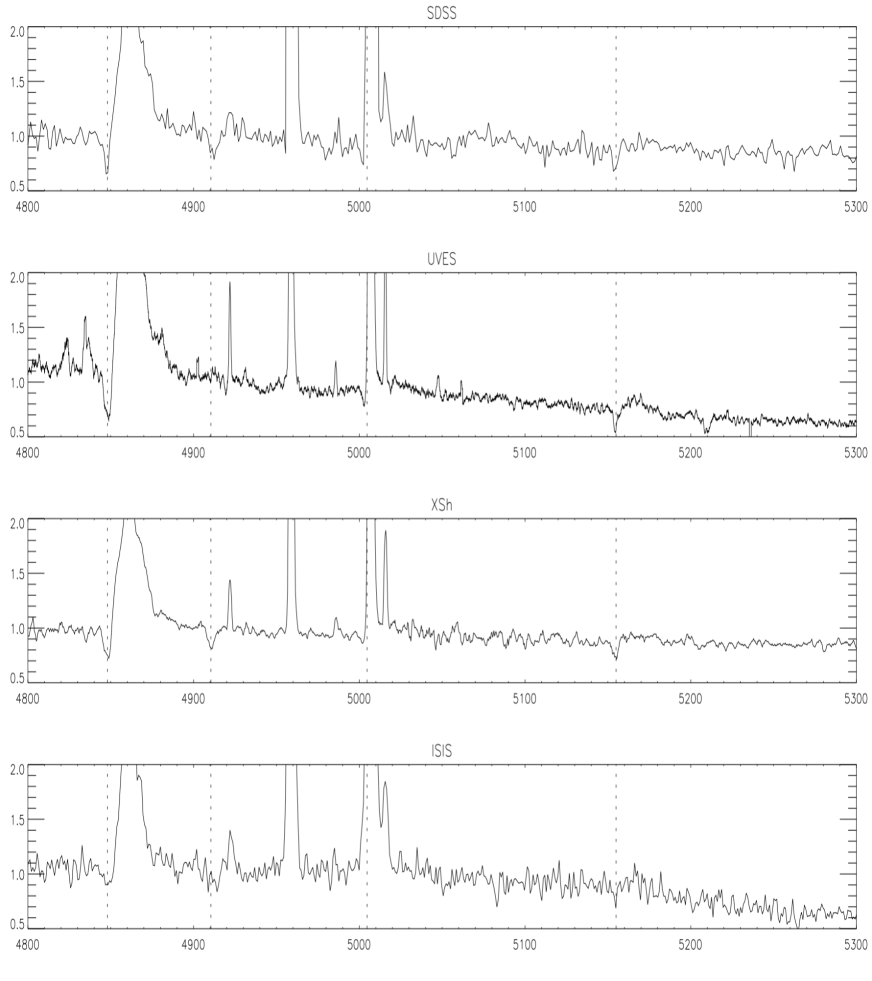
An important clue for an alternative interpretation of the absorptions seen at 4939 Å and 5031 Å is given by the discovery of a previously unidentified absorption at 5183 Å (Fig. 3) corresponding to 5155 Å in the rest frame of the forbidden lines and 5169 Å in the rest frame of the blue shifted Balmer absorptions. This absorption is real and is present in the spectra from SDSS, VLT-UVES, VLT-X-shooter and WHT-ISIS that were taken in four different epochs (see Fig. 10). Although the 5183 Å absorption could be attributed to Mg2 5172 Å present in late star spectra, this possibility can be readily dismissed given that the observed wavelength would imply a shift of 1050 km s-1with respect to the galaxy rest frame and definitely inconsistent with the presence of the CaII triplet lines at the galaxy velocity rest frame.
A more plausible interpretation is that we are in fact detecting the FeII multiplet (42) 4923.93,5018.44,5169.03Å blueshifted by the same amount as the Balmer absorption features i.e. 800 km/s to 4911,5005,5155 Å. These absorptions have already been detected in a variety of transient luminous objects like the LBV candidate NGC 2366V1 or SN IIn like 1995G, 1999el or 1999eb among others (see Figure 2 of Di Carlo et al., 2002).
LBVs represent a short ( 104 yr) phase in the evolution of massive stars during which the star undergoes luminous outbursts associated with large mass loss events. During these short phases lasting few years the LBV can reach, in extreme cases, 106 L⊙ or Mv -10 and luminosity variations of 1 mag. The luminosity changes are in general correlated with spectral changes. The typical absolute magnitude of an LBV in quiescent state is Mv -6. In general information about LBVs is very sparse given that only 35 candidates have been identified in our galaxy (Clark et al., 2005). Only two of these, Car and P Cygni, were observed during an outburst. Extragalactic examples are known due to either photometric or specific spectral variability. The mechanism responsible for the outbursts remains unidentified.
It is important to mention that the wind terminal velocities quoted by Izotov et al. (2011, 700-850 km s-1) are significantly larger than the usual range for LBVs (100-250 km s-1 up to 500 km s-1 for Car) (Leitherer et al., 1994). This discrepancy is attributed by Izotov et al. to PHL 293B very low metallicity.
There are two striking examples of LBVs in low metallicity dwarf galaxies, one in NGC 2366 and the other one in IC1613.
NGC 2366 is a giant HII region (similar to 30 Dor in the LMC) located in the metal poor (12+log(O/H)=7.9, i.e. O/H 0.16 solar, González-Delgado et al., 1994) dwarf galaxy NGC 2363, a member of the M81 group. The variable star NGC 2366-V1 showed a big eruption similar to an LBV with an amplitude of 3.5 mag in 4 years reaching a maximum of about Mv=-10.2 (Drissen, Roy, & Robert, 1997). After the outburst it started a decline of about 0.25 magnitudes in 6 years accompanied by 0.2 mag dips lasting about a year each. Regarding its spectral evolution, the Fe II lines (4923, 5018, and 5171) present between 1997 and 2000 disappeared later while the HeI transitted from absorption to emission and the P Cygni feature in H disappeared (Petit, Drissen, & Crowther, 2006). These authors reported an average wind terminal velocity of 300 km s-1 for NGC 2366-V1.
IC 1613 is a dwarf irregular galaxy in the Local Group with a metallicity of log(O/H)12 = 7.800.10 as determined from its B-supergiants (Bresolin et al., 2007). Nebular abundance estimates vary between 7.60 and 7.90 (Lee, Grebel, & Hodge, 2003), similar to the metallicity values shown by NGC 2363 and PHL 293B.
The peculiar variable star V39 (Sandage, 1971) was studied in detail by Herrero et al. (2010). Its spectrum shows strong Balmer and FeII P Cygni profiles combined with weak HeI emission similar to the early stages of the evolution of the NGC 2366-V1 LBV star. The equivalent width of the H P Cygni profile was 45 Å in emission and 2.3 Å in absorption with a blue shift or wind terminal velocity of 400 km/s. Its absolute magnitude reached Mv = -8.1.
The FeII (42) absorptions in these two transient objects show equivalent widths of about 2 Å while the observed value in the spectrum of PHL 293B is just under 1Å. The contribution of the nebular continuum at the FeII wavelengths is 25 per cent (see above), which increases this value to 1.3 Å. This implies that under this hypothesis, about 30 percent of the observed continuum should be due to the transient object itself. But, the absolute magnitude of PHL 293B is Mv = -14.5 while a very luminous LBV during outburst would reach Mv -10, thus contributing less than 2 percent of the total luminosity i.e. more than one order of magnitude smaller than what is needed to explain the observed strength of the FeII absorptions (see Table 3).
It seems important to notice that these two LBVs, both located in low metallicity environments, show wind terminal velocities that are typical of LBV (100-250 km s-1) while Car, belonging to a region that is not metal poor (12 + log O/H=8.36 0.03; Pilyugin, Ferrini, & Shkvarun, 2003), has a larger wind terminal velocity (up to 500 km s-1) .
Wind velocities between 100 km/s and 1000 km/s are reported for transient events or “supernova impostors” that could be related to powerful eruptions of LBVs (Smith, 2011), and in a very interesting recent work Koss et al. (2014) report an unusual variable source in the nearby dwarf galaxy MRK 177 (UGC 239) that they suggest can be explained as an LBV eruption followed by a SN IIn like event in 2001.
Nazé, Rauw, & Hutsemékers (2012) discussed the X-rays properties of the Galactic LBVs. They found that their X-ray luminosities in the 0.5-8 keV range are between and erg s-1. The estimated minimum luminosity for a point source to be detected in the ACIS-Chandra image of PHL 293B is about erg s-1 (see section §3.2) about three orders of magnitud higher than the largest reported values for Galactic objects.
5.4 Lack of optical variability
One fact supporting the hypothesis of the presence of a transient object would be the detection of long term variability in the flux from PHL 293B. However, as stated in §4.4, we can conclude that there is no variability at the level of a few hundredths of magnitude over 25 years. This implies that any long term variable component has to be fainter than V 21.5. For a distance modulus (m-M)31.8 this upper limit means that any long term variable component has to be fainter than M-10.5. However, this does not exclude the possibility that we are observing such a transient object during a non variable phase. The caveat in that case is that, if the variable component is that faint in relation with the ionising cluster, it will be difficult to explain the observed strength of the Balmer and FeII absorptions.
5.5 An old SN type IIn?
An alternative scenario for the broad lines and pseudo P Cygni profiles in PHL 293B is that they are originated in an evolved SN type IIn. It is usually assumed that SN IIn explode inside the circumstellar material previously ejected in the form of a slow dense wind by the red supergiant SN progenitor. What is observed is the result of the interaction between the ejecta and this slowly expanding dense circumstellar medium (CSM) which transforms the mechanical energy of the ejecta into radiation. These events are known as SN IIn or compact supernova remnants (see e.g. Chugai, 1991; Terlevich et al., 1992; Turatto, 2003). In this interaction, radiative cooling can become catastrophic and these remnants rapidly radiate most of the mechanical energy in a relatively short time scale and so they are highly luminous. The energy output is mostly in the extreme UV and X-ray regions of the spectrum. The optical continuum is a mixture of young stars and the emission from the SN IIn with fast moving high density gas producing the broad line emission.
The spectra of some SN IIn associated with HII regions like 1995G, 1999el or 1999eb among others, present broad Balmer components with relatively narrow P Cygni like absorptions plus narrowish FeII absorption with multiplet (42) being the strongest (see figure 2 of Di Carlo et al., 2002). A significant constraint on the SN IIn/compact remnant scenario is the long term lack of variability in PHL 293B. The secular variability of the broad lines in this scenario comes from the evolution of the interaction of the ejecta and the circumstellar medium, i.e. the evolution of the compact remnant. The evolution of the blue light-curve can be parametrized as (Aretxaga & Terlevich, 1994; Aretxaga, Cid Fernandes & Terlevich, 1997) with its peak luminosity being a function of the circumstellar density (). These are analytical approximations and their predicted values should be taken as such.
We note that the observed absolute magnitude of PHL 293B () is fainter than the absolute magnitude of a single compact remnant near peak ( for cm-3). This, together with the upper limit for the rate of change for the last 30 years, is only consistent with the very late stages of the evolution of a compact remnant, i.e. when its light curve flattens. Using the time dependence of the luminosity as an indicator, we find that a compact remnant of age years evolving in a medium with density cm-3 would have shown a decline of about 1.5 magnitudes since maximum and of about 0.1 magnitudes in the last 10 years.
We can estimate its line luminosities using the models of Terlevich et al. (1992). The observed luminosity of the broad component of H is:
From the analytical solutions of Terlevich et al. (1992) and tables 1.1 and 1.2 of Terlevich (1994) it is possible to estimate that a compact remnant evolving in a medium with cm-3 would have a shock velocity of 800 km/s at an age defined by of about 112 yr. Predicted values for the shock parameters and H corresponding to such age are:
and the FWZI of the broad component is about twice the shock velocity or 1600 km s-1. Given its temperature, the remnant is expected to emit in X rays up to about few keV with a luminosity just below erg s-1. These values are too large compared with the observed upper limit of erg s-1. Furthermore, the expected drop in luminosity 7.5 years later i.e. at an age of 119.5 yr is 10 % or about 0.1 magnitudes and the drop in luminosity in 20 years is about 0.2 magnitudes, thus we can safely conclude that the observed upper limit on the variability of PHL 293B makes it very difficult for the observed absorptions and broad emission to be originated in a SN type IIn.
In summary, we have evidence that an old compact remnant could explain the observed broad lines and the dense shell responsible for the blue-shifted absorptions in PHL 293B. But, while the observed line properties are in rough agreement with a compact remnant slightly older than 100 years, this age is much smaller than the age derived from the absolute blue magnitude limit imposed by the lack of variability and furthermore the expected variability in H at 100 years is also too large compared with the limits deduced from the data.
5.6 Spectral variability (or lack of it)
To see if there is some information in the data regarding the spatial distribution of the absorbers, we compared in Table 3 the EW measurements of the hydrogen absorptions that are supposed to cover most of the source of the continuum, with the ones of the FeII lines taking as reference the EW of [OIII]5007 that is expected to extend beyond most of the ionising cluster continuum but to be still inside the host galaxy continuum.
The EW of the H and FeII absorptions are, within errors, basically the same in all four sets of data.
To check for aperture effects we measured the EW of [OIII]5007 and the results are displayed in Table 3. As expected there is a slight increase in the EW measured with the smaller X-shooter aperture (1 arcsec) compared with the 3 arcsec circular aperture of the SDSS spectrum (although determination of faint continuum contribution can also account for such variations among spectra).
We have also checked for possible variability in the broad emission components. The broad and narrow components of H are listed in Tables 1 and 2. Their ratio of the broad to total H flux is, for both SDSS and X-Shooter observations, the same within errors, about 0.21 showing no indication of variability as already discussed.
5.7 The expanding supershell and stationary cooling wind scenarios.
The lack of variability imposes a strong constraint for scenarios involving discrete transient sources like LBV or SN IIn. At the same time the lack of variability suggests that the origin of the blue shifted absorptions could be associated with a global process involving a large part of the ionising cluster. Furthermore we have to address the fact that what we are witnessing in the FeII lines and perhaps also in the Balmer series in PHL 293B are blue shifted absorptions without the associated narrow emissions typical of classical P Cygni profiles. This lack of associated emissions indicates that the material responsible for the detected absorptions, while covering a large part of the continuum source, is not an extended circum-cluster medium (CCM). If it was it would have produced the so far undetected associated emission lines.
Luminous regions of star formation in the nearby universe like Orion or NGC 3606 in our galaxy, 30-Doradus in the LMC or NGC 604 in M33, to name just a few of the nearest ones, all show gaseous filaments surrounding the ionising cluster. This fact and the observed lack of variability over many years suggest a scenario where the blueshifted absorptions found in PHL 293B are formed in an expanding supershell generated by the cluster wind interacting with a moderately dense gas closely surrounding the star-forming region. The cluster wind drives a shock into the CCM and a recombined dense shell is formed in the post-shock region. This dense shell expanding at 800 km/s produces the observed blue shifted absorptions in H and Fe following catastrophic radiative cooling in a scenario similar to the case of the compact supernova remnant described above. The main difference being that instead of an instantaneous input of energy and mass the wind scenario involves a constant rate. As the cluster wind shocks the surrounding ISM it will generate, given adequate conditions, a post shock high density supershell that will be ionised by the cluster UV output modified by the radiative shock emission.
As already mentioned, a supershell scenario has been postulated to explain the diversity of Ly profiles observed in starbursts (see Tenorio-Tagle et al., 1999; Mas-Hesse et al., 2003, and references therein) where also blueshifted UV ISM metal absorption lines are observed. In this scenario the Ly emission and the blueshifted metal absorption lines are formed in an expanding supershell generated by the interaction of the combined stellar winds and supernova ejecta from the young starburst, with an extended gaseous halo.
Among the many intrinsic parameters of a star-forming region that can affect the properties of the observed emission line profiles, velocity, density and ionisation distributions of the gas along the line of sight are by far the dominant ones. The expulsion of dust and gas from young clusters due to the action of stellar winds and supernovae has been discussed by many authors (see for example Tutukov, 1978; Goodwin & Bastian, 2006; Bastian & Goodwin, 2006) as well as the resultant cluster “infant mortality” effect (see for example Grosbøl & Dottori, 2013).
The strength of a weak absorption line depends on its oscillator strength , its wavelength and column density N. If the element is mostly in one ion state and there is no line saturation the relation between the column density N and the EWλ is given by Morton (1991):
From the X-shooter spectra of PHL 293B we have measured EW = 0.91 Å and 0.68 Å for the FeII lines 4923Å and 5169Å respectively. The corresponding oscillator strengths are 0.0104 and 0.0226 (Kramida et al., 2012; Giridhar & Arellano Ferro, 1995). With these values for the oscillator strength we can compute the column density,
and
for the FeII lines 4923Å and 5169Å respectively. The column density values are in good agreement with each other within observational errors.
If the supershell is formed from shocked CCM, it must have abundances similar to those observed in the ionised gas. If Fe/O is solar, this implies for the supershell Fe/H and therefore the hydrogen column density associated with is,
or
if Fe/O is half solar. Given that we do not know the hydrogen ionization fraction, these values should be taken as an estimate of the total, i.e. neutral plus ionized, hydrogen column density.
Following the same procedure we can estimate from the Balmer absorptions the column density of neutral hydrogen. For a measured EW = 6 Å and 2 Å for H and H the column densities estimates of neutral hydrogen are respectively:
and
The comparison of the column density of “total” and neutral hydrogen suggests a high degree of ionisation in the gas that is producing the blueshifted absorptions.
An interesting variant of this scenario is provided by the Super Star Cluster (SSC) cooling wind model of Silich et al. (2004), Tenorio-Tagle et al. (2007) and collaborators. This group has shown that in the case of a very massive and extremely compact young cluster its wind may radiatively cool in a stationary condition close to the outer radius of the cluster. This cool ejecta should be the responsible agent for the broad emission and blue shifted absorptions observed (see figure 4a of Tenorio-Tagle et al., 2007)). We expect to see soon detailed model calculations for the supershell and stationary cooling wind scenarios and the comparison of the theoretical predictions with the observed parameters of PHL 293B.
If the FeII absorptions are formed in a stationary cooling wind the metal abundances will be those of the combined ejecta of stellar winds and SNe. In this scenario Fe/H will be much higher than that of the ISM in PHL 293B and consequently the estimated column density will be proportionally lower than those estimated above. Assuming solar abundances for the cluster wind, the estimated ionized hydrogen column density will be:
A question that is raised in these relatively long lived cluster wind scenarios is: why is it that among several thousand HII galaxies known, only PHL 293B is known to have simultanously narrow blue shifted Balmer and FeII absorptions? or equivalently, why is this type of event so rare?
The answer may be related to the fact that we are witnessing an event that produces weak narrow absorptions that are detectable only with high dispersion and high S/N spectra.
6 CONCLUSIONS
We have analysed spectra of the low metallicity starforming galaxy PHL 293B corresponding to four epochs obtained in four different combinations of telescopes and spectrographs, the SDSS, VLT-UVES, VLT-X-shooter and WHT-ISIS.
We find moderate narrow absorption components in the Balmer series blueshifted by 800km/s. We detected also the IR CaII triplet lines at the galaxy velocity rest frame, i.e. the rest frame defined by the ionised gas narrow emission lines. We also find narrow absorptions at 4911Å at 5004Å (partially filled up by [OIII] 5007Å) and a previously unidentified absorption at 5183Å. We interpret these narrow absorptions as the FeII multiplet (42) 4923.93,5018.44,5169.03Å, similar to those detected in a variety of transient luminous objects like the LBV candidate NGC 2366 V1 or SN type IIn 1995G, 1999el or 1999eb, blueshifted by the same amount as the Balmer absorption features i.e. 800 km/s to 4911,5005,5155 Å.
The analysis of the photometric data provided by the CSS puts a strong upper limit to the possible variability of PHL 293B. Basically any optical yearly variability allowed by the data should be smaller than 0.02 magnitudes at the 3 sigma level in the 8.5 years between April 2005 and September 2013. The possibility of any secular trend in the luminosity of PHL 293B in the last 15 years (considering only CCD data) is also limited to at most 0.02 magnitudes at the 3 sigma level.
This lack of variability and the observed strength of the Balmer and FeII absorptions rule out any transient of the type of an LBV or SN type IIn as the origin of the blue shifted absorptions of H and FeII.
The evidence points to either a young and dense expanding supershell or a stationary cooling wind, both driven by the young cluster wind. We suggest that the observed absorptions and broad Balmer emissions are originated in one of these scenarios which seem capable of explaining the observed spectral features, the constant (within errors) photometric history and the rarity of the phenomenon.
Many starbursts, both nearby and at high z, show blueshifted far UV ISM narrow absorption lines. On that basis, coupled with the observational evidence, we expect that the far UV spectrum of PHL 293B will show blue shifted ISM lines and moderate Ly emission with perhaps a P Cygni-like profile.
We have to bear in mind that there are not many HII galaxies known to show prominent broad wings in their emission lines and none with the quality of the data presented here for PHL 293B. This leaves open the possibility that we are witnessing an event not detected in other systems due to low S/N data. Even if it is true that we haven’t been actively looking for them, and that data of the quality and variety discussed here is not widely available, it is still puzzling that Fe absorptions have not been detected in other star forming HII galaxies. A search should be performed in high dispersion, high signal-to-noise spectra of HII galaxies to investigate the presence of supershells in starbursts with or without strong broad components in the Balmer lines. Until such data is gathered and analysed, the fact that we do not see many HII galaxies showing spectra similar to PHL 293B means that this may be a relatively short duration stage in the evolution of compact and massive stellar clusters, lasting perhaps only a few thousand years.
Acknowledgments
ET and RT are grateful to the Mexican Research Council (CONACYT) for support under grants 2008-103365 and 2010-01-155046. Financial support for this work has also been provided by the Spanish Ministerios de Educación y Ciencia and Ciencia e Innovación under grants AYA2007-67965-C03-03 and AYA2010-21887-C04-03. Our team enjoyed the hospitality of the Institute of Astronomy, Cambridge, of the Departamento de Física Teórica of the Universidad Autónoma de Madrid and of the Observatorio Astronómico of the Universidad Nacional de La Plata (Argentina) during fruitful visits when this paper was started and developed. We thank Vahram Chavushyan for suggesting the identification of the FeII absorption features in 4911, 5155 Å and discussions with Daniel Kunth helped to clarify the estimates of the analysis of these FeII features. Greatly enjoyed were discussions with Guillermo Tenorio-Tagle, Sergiy Silich and Sergio Martínez-González, from which a picture of the stationary wind scenario started to emerge. We are grateful to Vital Fernández for helping with the reduction of the WHT data. We thank the X-shooter data reduction team for valuable help and suggestions and an anonymous referee whose questionings greatly improved the clarity of the paper.
The CSS survey is funded by the National Aeronautics and Space Administration under Grant No. NNG05GF22G issued through the Science Mission Directorate Near-Earth Objects Observations Program. The CRTS survey is supported by the U.S. National Science Foundation under grants AST-0909182. This research has made use of the NASA/IPAC Extragalactic Database (NED) which is operated by the Jet Propulsion Laboratory, California Institute of Technology, under contract with the National Aeronautics and Space Administration.
References
- Abazajian et al. (2009) Abazajian K. N., et al., 2009, ApJS, 182, 543
- Aretxaga & Terlevich (1994) Aretxaga I., Terlevich R.,1994, MNRAS, 269, 462
- Aretxaga, Cid Fernandes & Terlevich (1997) Aretxaga I., Cid Fernandes R., Terlevich R., 1997, MNRAS, 286, 271
- Aretxaga et al. (1999) Aretxaga I., Benetti S., Terlevich R.J., Fabian A.C., Cappellaro E., Turatto M., della Valle M., 1999, MNRAS, 309, 343
- Asplund et al. (2009) Asplund M., Grevesse N., Sauval A. J., Scott P., 2009, ARA&A, 47, 481
- Bastian & Goodwin (2006) Bastian N., Goodwin S. P., 2006, MNRAS, 369, L9
- Bresolin et al. (2007) Bresolin F., Urbaneja M. A., Gieren W., Pietrzyński G., Kudritzki R.-P., 2007, ApJ, 671, 2028
- Cairós et al. (2001) Cairós L. M., Vílchez J.M., González Pérez J.N., Iglesias-Páramo J., Caon N., 2001, ApJS, 133, 321
- Castañeda, Vilchez, & Copetti (1990) Castañeda H. O., Vilchez J. M., Copetti M. V. F., 1990, ApJ, 365, 164
- The Chandra Proposers’ Observatory Guide (2013) The Chandra Proposers’ Observatory Guide, Issue 16.0, 2013, Chandra X-ray Center (http://cxc.harvard.edu/proposer/POG/)
- Chugai (1991) Chugai N.N., 1991, MNRAS, 250, 513
- Chugai et al. (2004) Chugai N.N., Blinnikov S. I., Cumming R. J., Lundqvist P., Bragaglia A.,Filippenko A. V., Leonard D. C., Matheson T., 2004, MNRAS, 352, 1213
- Clark et al. (2005) Clark J.S., Larionov V.M., Arkharov A., 2005, A&A, 435, 239
- Díaz et al. (1987) Díaz A. I., Terlevich E., Pagel B. E. J., Vilchez J. M., Edmunds M. G., 1987, MNRAS, 226, 19
- Díaz et al. (1989) Díaz A.I., Terlevich E., Terlevich R., 1989,MNRAS, 239, 325
- Díaz, Terlevich & Terlevich (1989) Díaz A.I., Terlevich E., Terlevich R., 1989,MNRAS, 239, 325
- Díaz et al. (2000) Díaz A. I., Castellanos M., Terlevich E., Luisa García-Vargas M., 2000, MNRAS, 318, 462
- Di Carlo et al. (2002) Di Carlo E., Massi F., Valentini G., et al., 2002, ApJ, 573, 144
- D’Odorico et al. (2006) D’Odorico S. et al., 2006, SPIE, 6269, 626933
- Dottori (1981) Dottori H. A., 1981, Ap&SS, 80, 267
- Drake et al. (2009) Drake,A.J. et al. 2009, ApJ, 696, 870
- Drissen, Roy, & Robert (1997) Drissen L., Roy J.-R., Robert C., 1997, ApJ, 474, L35
- Fassia et al. (2001) Fassia, A., et al. 2001, MNRAS, 325, 907
- Filippenko (1989) Filippenko A.V.,1989, AJ, 97, 726
- Filippenko (1997) Filippenko A.V.,1997, ARA& A, 35, 309
- French (1980) French H. B., 1980, ApJ, 240, 41
- García-Vargas, Mollá, & Bressan (1998) García-Vargas M. L., Mollá M., Bressan A., 1998, A&AS, 130, 513
- Geha et al. (2006) Geha M., Blanton M. R., Masjedi M., West A. A., 2006, ApJ, 653, 240
- Giridhar & Arellano Ferro (1995) Giridhar S., Arellano Ferro A., 1995, Rev.Mex.A.A., 31,23GTT07
- González-Delgado et al. (1994) González-Delgado R. M., et al., 1994, ApJ, 437, 239
- Goodwin & Bastian (2006) Goodwin S. P., Bastian N., 2006, MNRAS, 373, 752
- Grosbøl & Dottori (2013) Grosbøl P., Dottori H., 2013, A&A, 551, L13
- Hägele et al. (2009) Hägele G.F., Díaz A.I., Cardaci M.V., Terlevich E., Terlevich R., 2009, MNRAS, 396, 2295
- Haro & Luyten (1962) Haro G., Luyten W. J., 1962, BITon, 3, 37
- Herrero et al. (2010) Herrero A., Garcia1 M., Uytterhoeven K., Najarro F., Lennon D. J., Vink J. S., Castro N., 2010, A&A, 513, A70
- Izotov et al. (1996) Izotov Y. I., Dyak A. B., Chaffee F. H., Foltz C. B., Kniazev A. Y., Lipovetsky V. A., 1996, ApJ, 458, 524
- Izotov & Thuan (2009) Izotov Y. I., Thuan T.X., 2009, ApJ, 690, 1797
- Izotov, Thuan & Stasińska (2007) Izotov Y. I., Thuan T.X., Stasińska G., 2007, ApJ, 662, 15
- Izotov et al. (2011) Izotov Y. I., Guseva N. G., Fricke K. J., Henkel C., 2011, A&A, 533, A25
- Kinman (1965) Kinman,T.D., 1965, ApJ, 142, 1241
- Koss et al. (2014) Koss M., Blecha L., Mushotzky R., Hung Ch.L., Veilleux S., Trakhtenbrot B., Schawinski K., Stern D., Smith N., Li Y., and 5 coauthors, 2014, arXiv:1401:6798v1
- Kramida et al. (2012) Kramida, A., Ralchenko, Yu., Reader, J. and NIST ASD Team (2012). NIST Atomic Spectra Database (version 5.0), [Online]. Available: http://physics.nist.gov/asd
- Kunth & Östlin (2000) Kunth D., & Östlin G., 2000, A&AR, 10, 1
- Lee, Grebel, & Hodge (2003) Lee H., Grebel E. K., Hodge P. W., 2003, A&A, 401, 141
- Leitherer et al. (1994) Leitherer, C., Allen, R., Altmer, B., et al. 1994, ApJ, 428, 292
- Leitherer & Heckman (1995) Leitherer C., Heckman T. M., 1995, ApJS, 96, 9
- Macchetto et al. (1990) Macchetto F., Colina L., Golombek D., Perryman M. A. C., di Serego Alighieri S., 1990, ApJ, 356, 389
- Mas-Hesse et al. (2003) Mas-Hesse,M.J. ,Kunth,D., Tenorio-Tagle,G., Leitherer,C., Terlevich R.J., Terlevich,E., 2003, ApJ, 598, 858
- Melnick, Tenorio-Tagle, & Terlevich (1999) Melnick J., Tenorio-Tagle G., Terlevich R., 1999, MNRAS, 302, 677
- Mollá, García-Vargas, & Bressan (2009) Mollá M., García-Vargas M. L., Bressan A., 2009, MNRAS, 398, 451
- Mollá et al. (2009) Mollá M., García-Vargas M. L., Bressan A., 2009, MNRAS, 398, 451
- Morton (1991) Morton,D.,1991, ApJS, 77, 119
- Mould et al. (2000) Mould J. R., et al., 2000, ApJ, 529, 786
- Nazé, Rauw, & Hutsemékers (2012) Nazé Y., Rauw G., Hutsemékers D., 2012, A&A, 538, A47
- Petit, Drissen, & Crowther (2006) Petit V., Drissen L., Crowther P. A., 2006, AJ, 132, 1756
- Pilyugin, Ferrini, & Shkvarun (2003) Pilyugin L. S., Ferrini F., Shkvarun R. V., 2003, A&A, 401, 557
- Roy et al. (1992) Roy J.-R., Aube M., McCall M. L., Dufour R. J., 1992, ApJ, 386, 498
- Silich et al. (2004) Silich S.,Tenorio-Tagle G.,Rodríguez-González A. 2007, ApJ, 610, 226
- Sandage (1971) Sandage A., 1971, ApJ, 166, A70
- Smith (2011) Smith, N., Li, W., Silverman, J. M., Ganeshalingam, M., & Filippenko, A. V. 2011, MNRAS, 415, 773
- Stasińska et al. (2006) Stasińska G., Cid Fernandes R., Mateus A., Sodré L., Asari N. V., 2006, MNRAS, 371, 972
- Tenorio-Tagle et al. (1999) Tenorio-Tagle, G., Silich, S. A., Kunth, D., Terlevich, E., Terlevich, R. 1999, MNRAS, 309, 332
- Tenorio-Tagle et al. (2007) Tenorio-Tagle G., Wünsch R., Silich S., Palous J. 2007,ApJ 658, 1196
- Terlevich, Díaz & Terlevich (1990) Terlevich E., Díaz A.I., Terlevich R., 1990,MNRAS, 242, 271
- Terlevich et al. (1990) Terlevich E., Díaz A.I., Terlevich R., 1990,MNRAS, 242, 271
- Terlevich et al. (1996) Terlevich E., Díaz A. I., Terlevich R., González-Delgado R. M., Pérez E., García Vargas M. L., 1996, MNRAS, 279,1219
- Terlevich et al. (1992) Terlevich R., Tenorio-Tagle G., Franco J., Melnick J.,1992, MNRAS, 255, 713
- Terlevich (1994) Terlevich R., 1994, in: Circumstellar Media in Late Stages of Stellar Evolution, Proceedings of the 34th Herstmonceux Conference held in Cambridge, July 12-16, 1993. Edited by R.E.S. Clegg, I.R. Stevens and W.P.S. Meikle. Cambridge, UK: Cambridge University Press, p.153
- Turatto (2003) Turatto M., 2003, in: Supernovae and Gamma-Ray Bursters. Ed. K. Weiler., Lecture Notes in Physics, vol. 598, p.21-36
- Turatto (2005) Turatto M., 2005, in: Cosmic Explosions, On the 10th Anniversary of SN1993J. Proceedings of IAU Colloquium 192. Edited by J.M. Marcaide and Kurt W. Weiler. Springer Proceedings in Physics, vol. 99. Berlin: Springer, 2005., p.151
- Tutukov (1978) Tutukov A. V., 1978, A&A, 70, 57
- Vernet (2011) Vernet J., Dekker H., D’Odorico S., Kaper L., Kjaergaard P., Hammer F., Randich S., Zerbi F., Groot P. J., Hjorth J., and 80 coauthors, 2011, A&A, 536A, 105
- Vestergaard & Peterson (2006) Vestergaard M., Peterson B.M., 2006, ApJ, 641, 689