A Partial Eclipse of the Heart: The Absorbed X-ray Low State in Mrk 1048
Abstract
We present two new XMM-Newton observations of an unprecedented low flux state in the Seyfert 1 Mrk 1048 (NGC 985), taken in 2013. The X-ray flux below 1 keV drops by a factor of 4–5, whereas the spectrum above 5 keV is essentially unchanged. This points towards an absorption origin for the low state, and we confirm this with spectral fitting, finding that the spectral differences can be well modelled by the addition of a partial covering neutral absorber, with a column density of cm-2 and a covering fraction of . The optical and UV fluxes are not affected, and indeed are marginally brighter in the more recent observations, suggesting that only the inner regions of the disk are affected by the absorption event. This indicates either that the absorption is due to a cloud passing over the inner disk, obscuring the X-ray source but leaving the outer disk untouched, or that the absorber is dust-free so the UV continuum is unaffected. We use arguments based on the duration of the event and the physical properties of the absorber to constrain its size and location, and conclude that it is most likely a small cloud at cm from the source.
keywords:
galaxies: active – galaxies: Seyfert – galaxies: accretion – galaxies: individual: Mrk 10481 Introduction
Low flux states in active galactic nuclei (AGN) are of particular interest as they can show very extreme behaviour, such as drops by factors of 10 or more in flux over the 2–10 keV band on time scales of months to days (e.g. Grupe et al., 2007). The nature of these low states may have important implications for our understanding of the behaviour of AGN in general, and may be relevant to measurements of spin.
One of the key questions for any such low state is whether the drop in flux is intrinsic to the source (as in 1H 0707-495; Fabian et al., 2012) or can be attributed to intervening material (as in NGC 1365; Risaliti et al., 2013). In the former case, observations of low states in AGN may allow use to probe the very inner edge of the accretion disk and make very accurate measurements of the spin (Fabian et al., 2014, Parker et al., submitted), while in the latter these observations can be used to observe the environment surrounding AGN, including outflows (Kaastra et al., 2014), broad line region (BLR) clouds and the edge of the torus (Maiolino et al., 2010; Lohfink et al., 2012), and constrain the size of the X-ray emitting corona (Sanfrutos et al., 2013). Unfortunately, these two different causes for low-flux states can be hard to distinguish (e.g. Schartel et al., 2007), due to low count spectra and intrinsically similar spectral shapes. Interestingly, a dramatic but more gradual decline in the luminosity (including the X-ray luminosity) from Mrk 509 appears to have coincided with a change in the Seyfert classification of the source (Denney et al., 2014).
Mrk 1048 (also known as NGC 985) is a Seyfert 1 galaxy (Veron-Cetty et al., 1983) at redshift 0.0427. The galaxy itself has a clear ring structure, which suggests that it is going through a merger (de Vaucouleurs & de Vaucouleurs, 1975). The presence of warm absorption in the X-ray spectrum of this source is well known, and was first suggested based on ROSAT observations by Brandt et al. (1994). These features were then confirmed using ASCA by Nicastro et al. (1999), and have also been seen with grating spectra by Chandra and XMM-Newton (Krongold et al., 2005, 2009). In this work we present XMM-Newton observations of an unusual low flux state in Mrk 1048, detected using Swift monitoring.
2 Observations and Data Reduction
In an ongoing search for AGN in deep low-states (e.g. Schartel et al., 2010), we noticed the low Swift flux of Mrk 1048, and then triggered our dedicated XMM-Newton follow-ups. We use an archival XMM-Newton observation from 2003, when the source was not in a low state, for comparison with the new data.
2.1 XMM-Newton
Mrk 1048 was observed three times with XMM-Newton (Jansen et al., 2001), once in 2003 and twice in 2013. The details of the observations are given in Table 1. We used the XMM-Newton Science Analysis System (SAS) v13.5.0 for all data reduction, using the epproc task to produce cleaned EPIC-pn (Strüder et al., 2001) event files. evselect was then used to extract spectra, filtering for background flares and using only single and double events. Response matrices were generated using the rmfgen and arfgen tasks. Source and background spectra were extracted from 40” circular regions for all observations, and all spectra are source-dominated until keV. The background regions are selected to avoid contaminating sources and copper lines from the detector. The RGS data were reduced using the rgsproc ftool, and filtered for background flares. All spectral fitting is performed using Xspec version 12.8.1l (Arnaud, 1996), and the spectra are binned to a minimum of 30 counts per bin using grppha. We use statistics for the fits presented in this work, but we also checked the validity of our fits using Cash statistics (cstat in xspec; Cash, 1979) and find no significant differences in the acceptability of the fits or in the values of model parameters. The Optical Monitor (OM) data was extracted using omichain, and corrected for Galactic reddening using the reddening curve of Cardelli et al. (1989).
| Obs. ID | Start Date | Exposure time | Count Rate | 0.3–2 keV Flux | 2–10 keV Flux |
|---|---|---|---|---|---|
| (ks) | (s-1) | erg cm-2 s-1 | erg cm-2 s-1 | ||
| 0150470601 | 2003-07-15 | 31.14 | |||
| 0690870101 | 2013-07-20 | 15.92 | |||
| 0690870501 | 2013-08-10 | 71.62 |
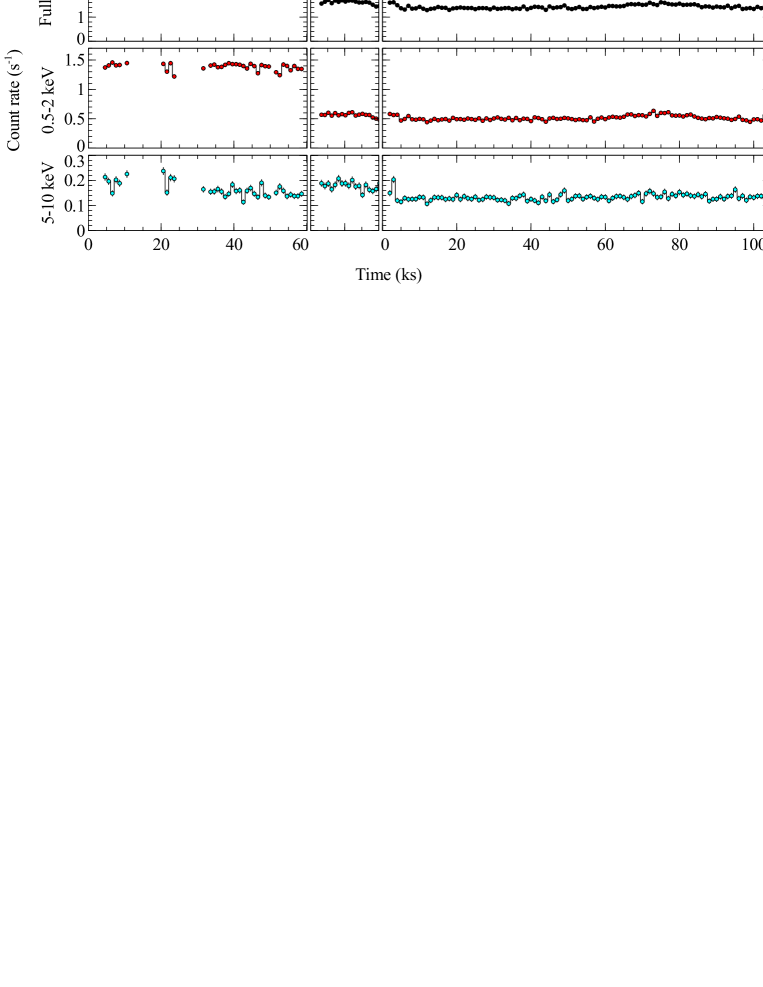
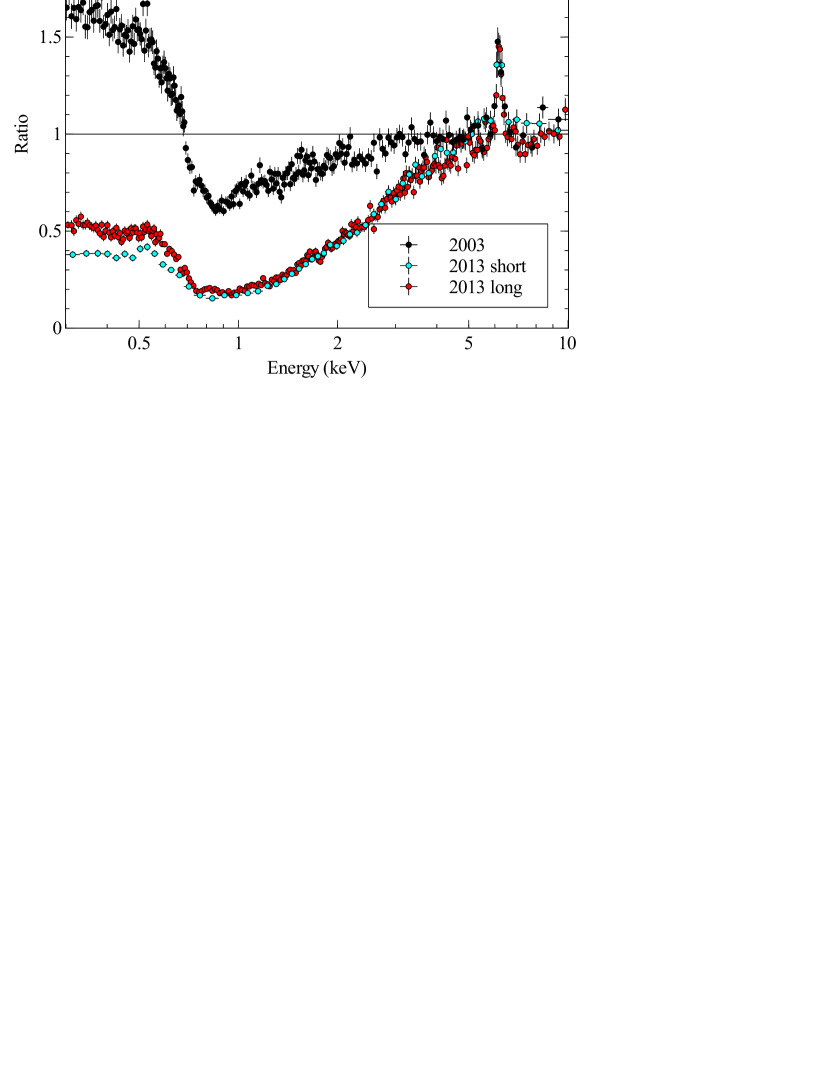
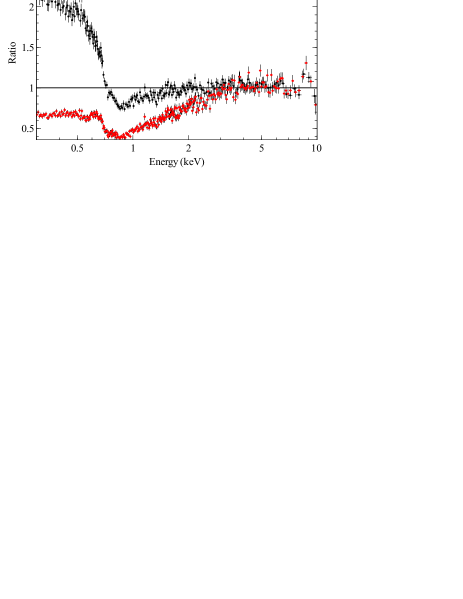
In Fig. 1 we show the EPIC-pn lightcurves for Mrk 1048. There is a large drop (a factor of ) in flux between the 2003 observation and the 2013 observations, which is concentrated in the 0.5–2 keV band, with almost no changes in flux over the 5–10 keV band. We show the three spectra in Fig. 2 as ratios to a powerlaw, modified by galactic absorption, fit from 5–10 keV. It is clear from this figure that almost all of the variability takes place at low energies, and a narrow iron line and warm absorption are clearly visible.
2.2 Swift
Mkn 1048 was a target of a Swift fillin program between 2007 July and 2008 June (Grupe et al., 2010) and was observed 5 times during that period. When Swift observed Mkn 1048 again on 2013-July-07 it discovered Mkn 1048 in a low X-ray flux state. consequentially we requested further Swift observations between 2013-July 12 and August 11. These observations are listed in Table 2.
All observations with the Swift X-ray Telescope (XRT, Burrows et al., 2005) were performed in photon counting mode (Hill et al., 2005). XRT data were reduced with the the task xrtpipeline version 0.12.6., which is included in the HEASOFT package 6.12. Source counts were collected in a circular region with a radius of 94.3 and the background in a close-by source-free region with a radius of 282.9. The auxiliary response files (ARFs) were created by the FTOOL xrtmkarf and we used the most recent response file swxpc0to12s6_20010101v013.rmf. All spectra were rebinned with 20 counts per bin, except for the data in segments 008 and 012 which were binned with one count per bin, due to the low number of total counts in these observations. These spectra were fitted in XSPEC using Cash statistics, and all others were fitted with statistics.
The photometric data taken by the UV-Optical Telescope (UVOT, Roming et al., 2005) were analyzed with task uvotsource. Source counts were selected in a circular region with a radius of 5 and a nearby source-free region with a radius of 20. Count rates were converted into fluxes and magnitudes based on the most recent UVOT calibration as described in Poole et al. (2008) and Breeveld et al. (2010). The UVOT data were corrected for Galactic reddening of (Schlegel et al., 1998). The correction factor in each filter was calculated with equation (2) in Roming et al. (2009) who used the standard reddening correction curves by Cardelli et al. (1989).
| Exposure time (s) | ||||
|---|---|---|---|---|
| ID | Segment | Start Date | XRT | UVM2 |
| 91616 | 001 | 2013-07-07 | 2148 | 526 |
| 36530 | 006 | 2013-07-12 | 2400 | 582 |
| 007 | 2013-07-20 | 1051 | 247 | |
| 008 | 2013-07-25 | 1049 | 1038 | |
| 009 | 2013-07-29 | 952 | 962 | |
| 010 | 2013-08-02 | 967 | 954 | |
| 012 | 2013-08-10 | 974 | 981 | |
| 013 | 2013-08-11 | 849 | 199 | |
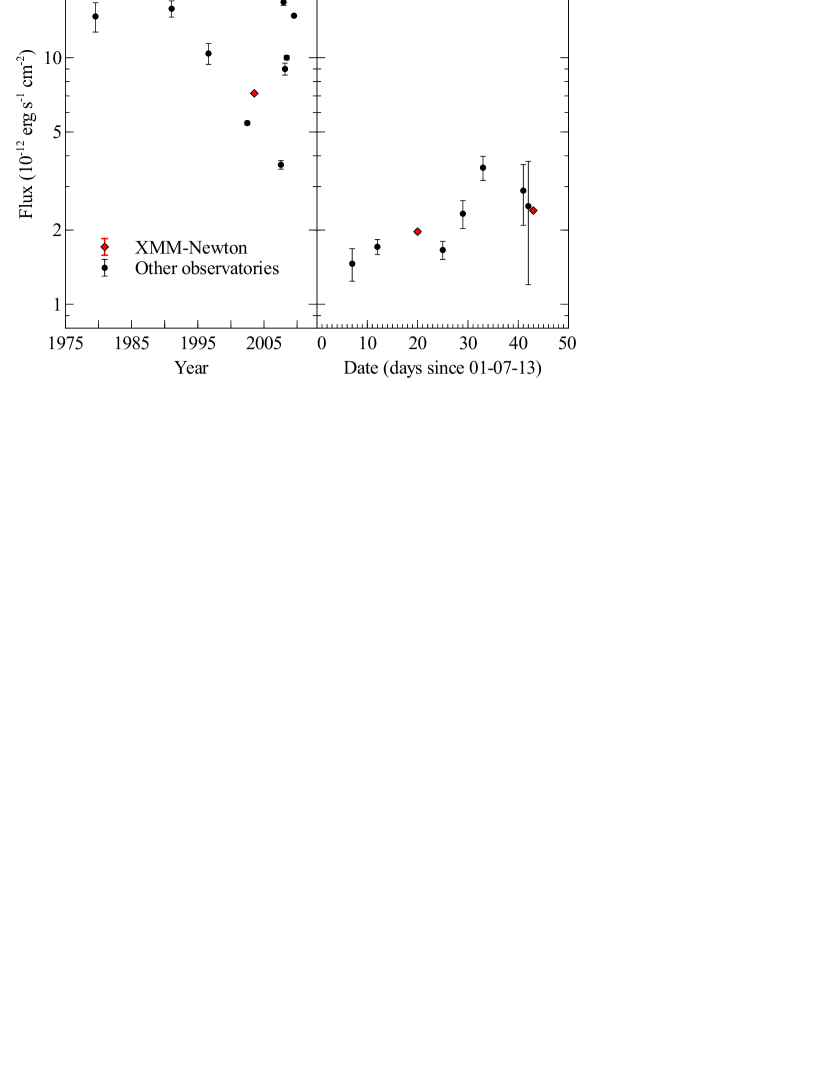
In Fig. 3 we show the long term lightcurve of Mrk 1048, which has been observed by every major X-ray mission. The source flux has never been observed to drop as low as in the 2013 low state, which is around 20 times fainter than Mrk 1048 at its brightest. The additional data used in this plot comes from EINSTEIN (Fabbiano et al., 1992); ASCA (Nicastro et al., 1999); Suzaku (Winter et al., 2012); Swift (Grupe et al., 2010) and Chandra (Krongold et al., 2005).
3 Spectral Analysis
3.1 2003 XMM-Newton data
We initially focus on the data from the 2003 observation, with the aim of establishing a baseline model from which to examine the changes in the low flux state observations of 2013.
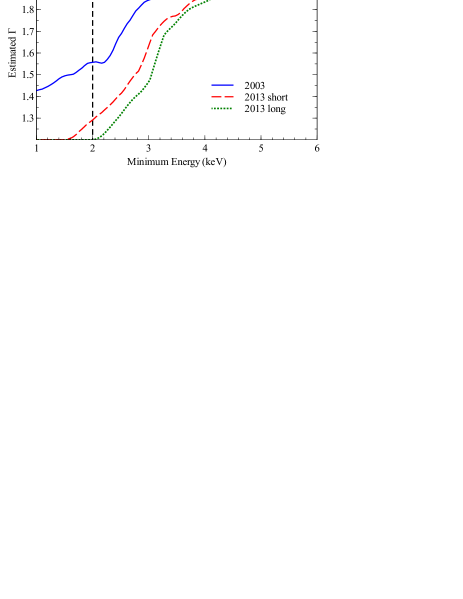
In previous work analysing the 2003 data, the EPIC-pn data are first fit from 2–10 keV, and the fit is then extrapolated down to lower energies, showing clear evidence of warm absorption and a soft excess. However, as we show in Fig. 4, the estimated power law index from such a fit is highly dependent on the energy band chosen, and this can have a very large effect on the extrapolated low energy ( keV) power law flux. For the fitting in Fig. 4, we use a simple power law plus distant reflection model, including galactic absorption, using xillver (García et al., 2013) with to model the distant reflection. The full Xspec model used is tbabs*(powerlaw+xillver), and we fix the column density of the galactic absorption to cm-2 (Kalberla et al., 2005). As shown in the figure, a much harder powerlaw index is obtained when this model is fit from 2–10 keV than from 5–10, which indicates that there is still spectral curvature from the warm absorption present above 2 keV. Based on the flattening of the plots above keV and the consistency between the different observations, it seems likely that the powerlaw index should be steeper than that found from the 2–10 keV band, around 1.9. Extrapolating such a power law model to lower energies does not show a low energy excess, rather it leaves a deficit which could potentially be explained by the warm absorption (Fig. 4, right panel). This plot shows the impact of extrapolating the continuum from two different energy bands. The model extrapolated from the 2–10 keV band shows a very strong soft excess, whereas no such feature is present when the model is extrapolated from the 5–10 keV band. The indices for these fits are and , respectively. Because of this result, we do not include a separate soft excess component in our fits.
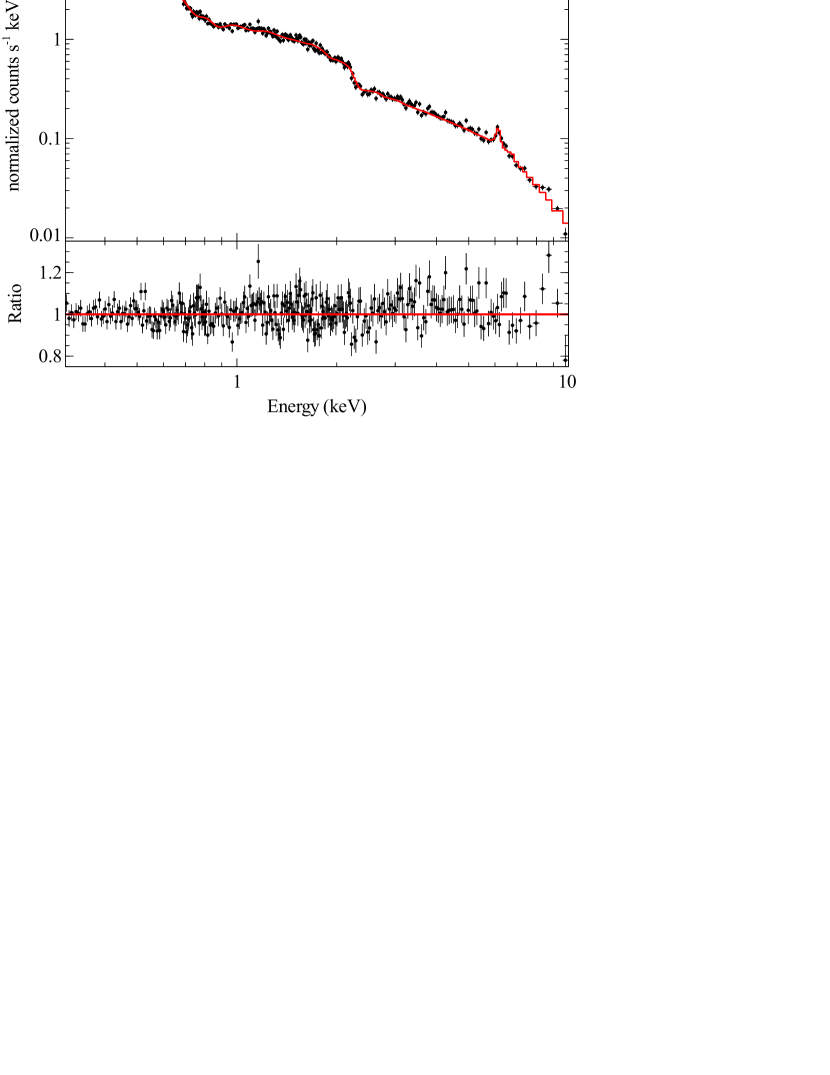
To investigate the full spectrum (from 0.3–10 keV) we use an xstar grid to fit the warm absorption. A fit with a single warm absorption zone (tbabs*(xstar*powerlaw+xillver+zgauss)) gives an excellent fit (), and this is not significantly improved by the addition of a second absorbing zone. The parameters of this fit are shown in the first row of Table 4. An additional narrow line is included (modelled with zgauss) at 6.55 keV, as a significant excess is found in the fit to all observations (see § 3.3), with its parameters fixed at the best fit values from the joint fit to all 3 observations.
3.2 Differences between observations
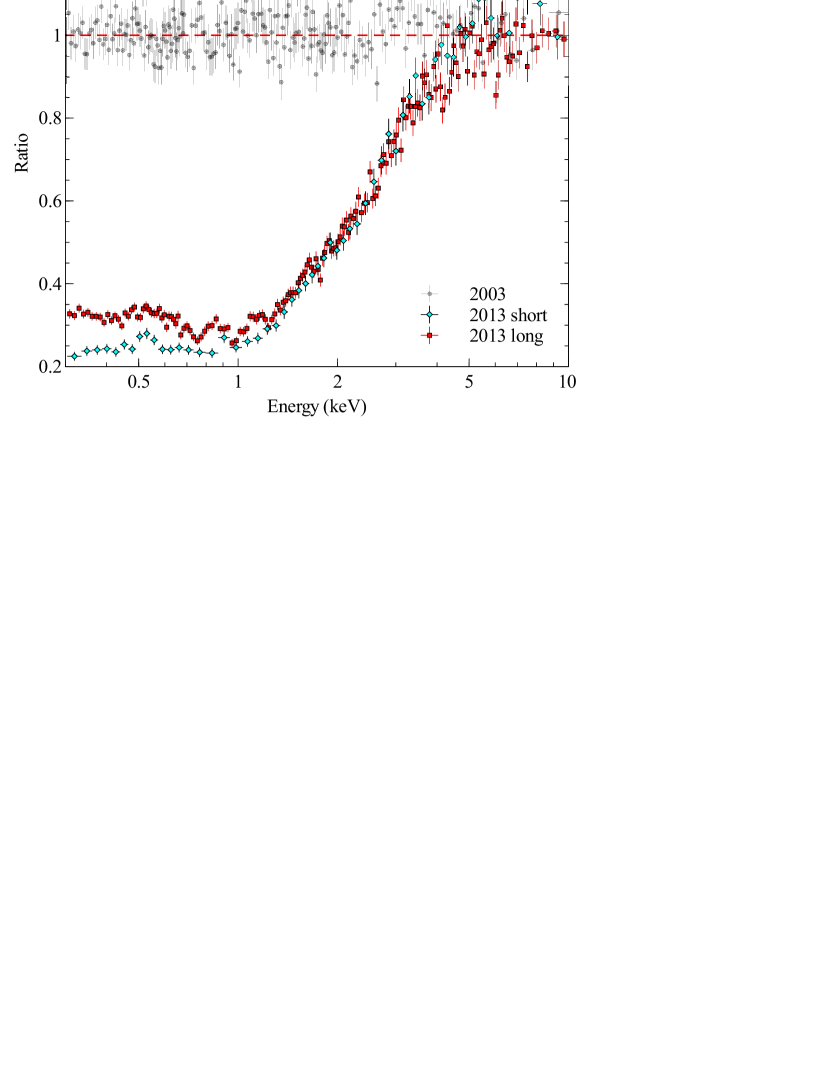
For the purposes of comparing the observations, we first plot the 2013 low state observations as a ratio to the best-fit model of the 2003 data (Fig. 6). For this plot, the 2003 model can be effectively regarded as a phenomenological fit. The figure clearly shows that the spectral changes take place almost exclusively below 5 keV, with a sharp drop down to keV where it flattens again. This spectral shape, with low and high energy breaks and no strong features, is exactly that predicted by partial covering neutral absorption, and we therefore focus on modelling this interpretation.
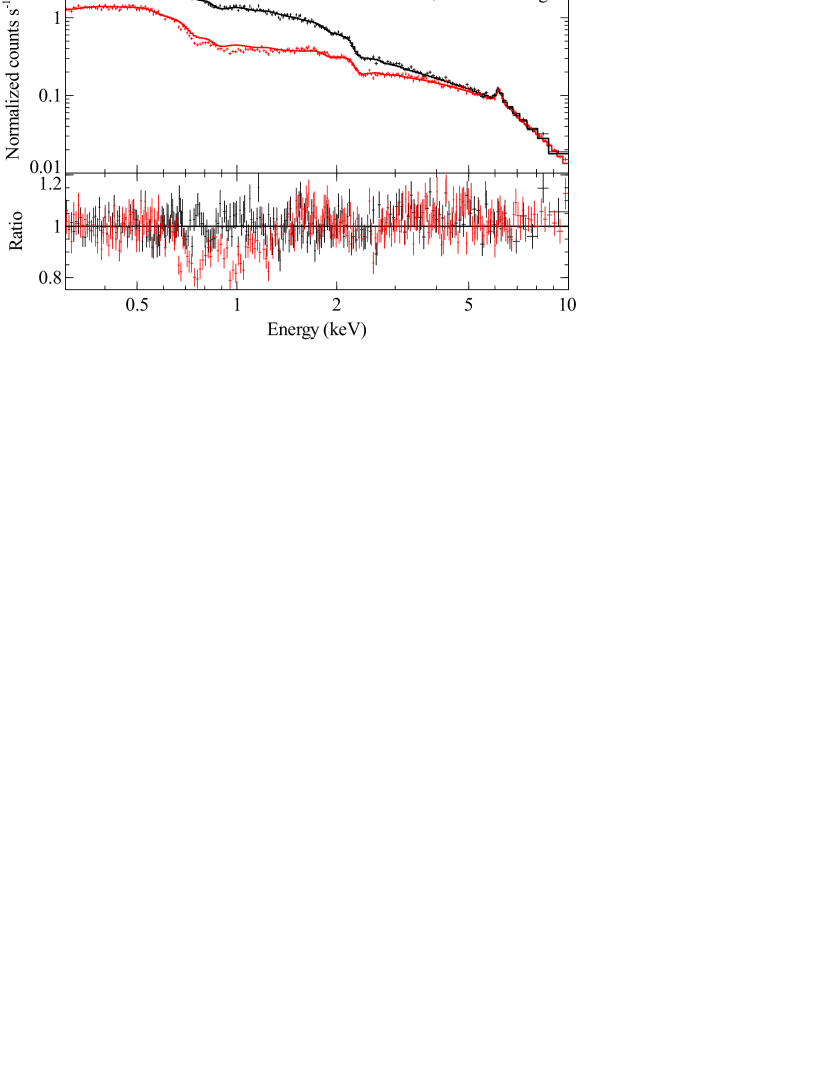
To investigate potential changes in the warm absorber(s), we simultaneously fit the 2003 and 2013 long observations with the best fit model discussed in § 3.1. To this model, we add a partial covering neutral absorber, modelled with pcfabs in Xspec. The covering fraction and column density are fixed at zero in the 2003 spectrum, and free to vary in the 2013 observation. We exclude the 0.5–1 keV band from the 2013 data, where there are small absorption features visible in Fig. 6, then jointly fit the data. The resulting residuals are shown in the lower panel of Fig. 7, showing clear evidence of changes in the ionised absorption.
| Line | Energy (eV) | Flux (10 erg s-1 cm-2) |
|---|---|---|
| Ovii triplet | 561 | |
| 569 | ||
| 574 | ||
| Oviii Kα | 653 |
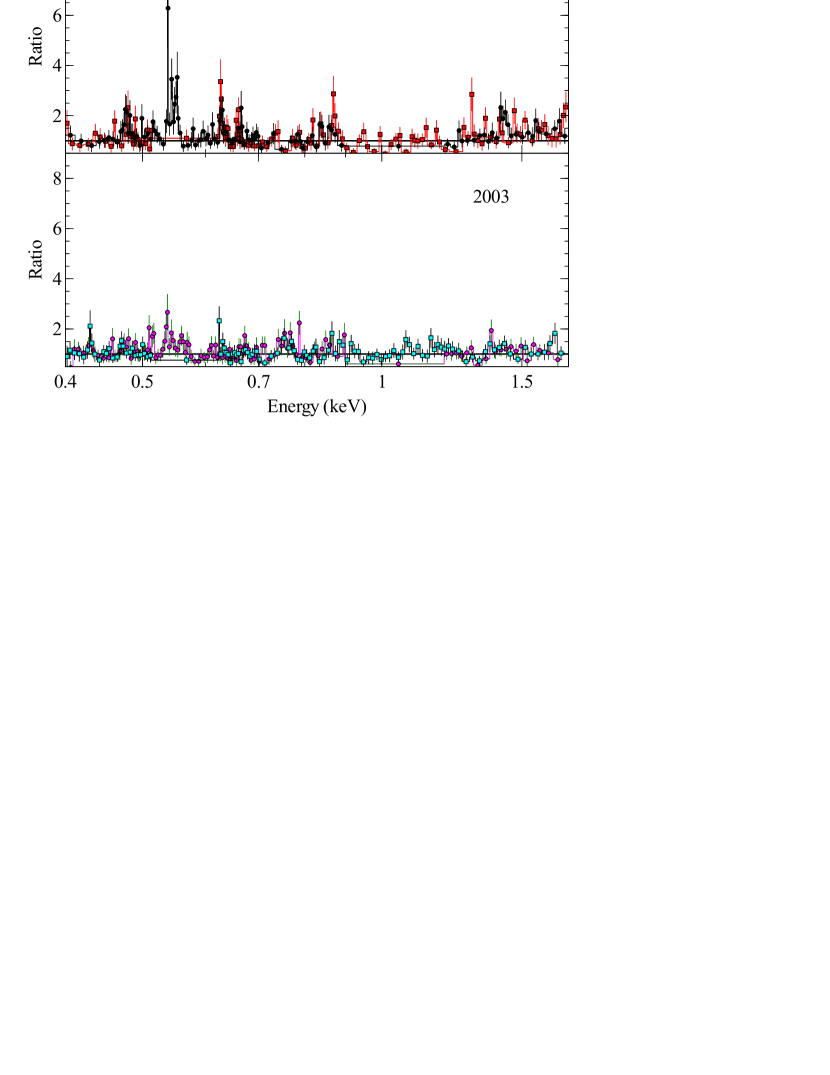
While detailed modelling of the RGS data is beyond the scope of this work, we can use the spectra to investigate potential changes in the absorption and emission between the observations. In Fig. 8 we show the data/model ratios for the 2003 observation and the 2013 long observation, where both spectra are fit with the full model including partial covering and warm absorption (see § 3.3), but with the distant reflection component removed. Strong narrow emission lines are clearly visible in the 2013 data, and are either not detected or much weaker in the 2003 spectrum. The strongest emission feature here is the Ovii triplet, which is also the strongest feature predicted in this band by the distant reflection model (Fig. 9, right panel). These lines do not correspond to strong absorption features in the model (with the exception of the feature above 0.7 keV in the 2003 data, which corresponds to the iron UTA), and therefore are genuine emission features. This suggests that while the primary continuum is highly absorbed, the reflection component is unaffected, leaving much more prominent emission lines.
Fitting narrow Gaussian lines to the low flux spectrum at the energies of the four lines identified by Krongold et al. (2009) in the high state returns line fluxes which are consistent with those found by Krongold et al., although the errors are large (Table 3). This supports the conclusion that the distant reflection has not changed between the observations, and certainly has changed much less than the continuum.
3.3 Fits to all observations
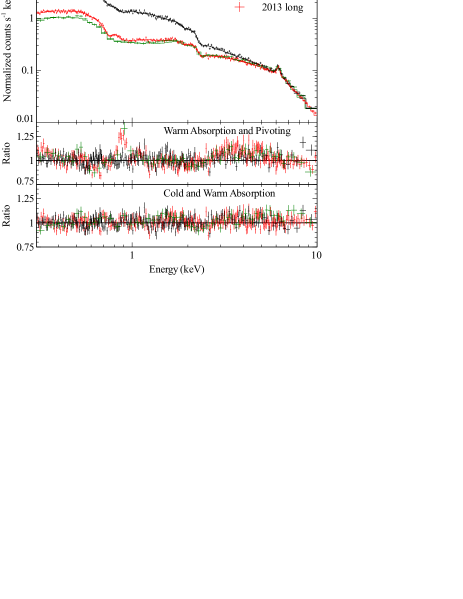
To investigate the spectral changes in detail, we simultaneously fit the EPIC-pn spectra from all three observations. In all the models discussed here, we find that an additional narrow iron line is required to properly model the high energy spectrum. The typical energy for this feature (from the best fit model) is keV, and the equivalent width is 38 eV. We do not find significant variability in the strength or energy of the line either between observations or between models.
As expected, based on the large drop in flux (Fig. 6) and only small changes in the absorption lines (Fig. 7), a model without an additional cold absorber (allowing changes in the ionisation and column density of the warm absorber only) gives a poor fit (). Similarly, allowing only the continuum and reflection to vary (both in spectral index and normalisation) between the observations also gives a poor fit (). Allowing both the underlying spectrum and warm absorption to change gives a much better fit (), although significant residuals remain around 0.8–0.9 keV, where a strong oxygen absorption edge is present in the ionised absorption model, but absent in the data. Adding additional warm absorption zones does not significantly improve this fit, as the (very small) drop in is offset by the drop in degrees of freedom.
| Neutral absorber | Warm absorber | Powerlaw | Distant reflection | ||||||
| Model | Covering Fraction | d.o.f. | |||||||
| cm | cm | (log[erg cm s-1]) | (solar) | (degrees) | |||||
| 1 | 1099/1094 | ||||||||
| 2a | 3629/3122 | ||||||||
| 2b | - | - | - | ||||||
| 2c | - | - | - | ||||||
| 3a | 0* | 0* | 3423/3127 | ||||||
| 3b | - | - | - | - | - | - | |||
| 3c | - | - | - | - | - | - | |||
| 4a | 0* | 0* | 3165/3118 | ||||||
| 4b | - | - | - | ||||||
| 4c | - | - | - | ||||||
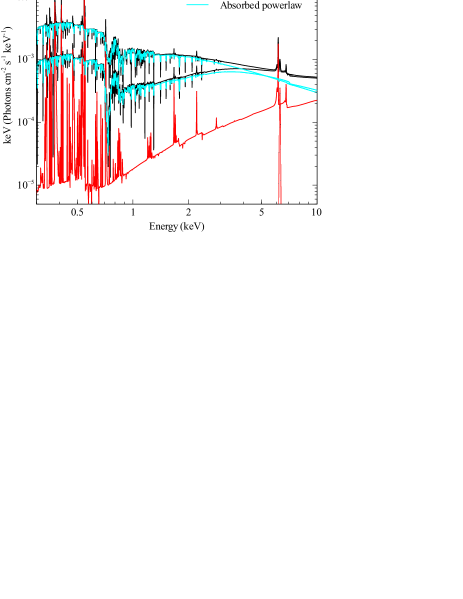
We next investigate the addition of a cold absorber, modelled using zpcfabs (full model: tbabs * (zpcfabs * xstar * powerlaw + xillver + zgauss)). Keeping all parameters apart from the covering fraction and column density tied between the observations, we find a much improved fit over the spectral pivoting models (), with a of -206 for 5 more degrees of freedom. However, as shown in Fig. 7 there do appear to be changes in the ionised absorption between the 2003 and 2013 observations, once cold absorption is taken into account. For our final best-fit model we allow the column density and ionisation of the warm absorber to change between observations, along with the photon index and flux of the power law. This gives a very good fit (), with no significant residual features. The bulk of the spectral changes are caused by the cold absorption, with only minor changes needed in the continuum and warm absorption. We show the fits to all three datasets in the left panel of Fig. 9, both with and without the cold absorber. The best fit model is shown in the right panel of Fig. 9. Based on this model, after correcting for both Galactic and intrinsic absorption, we find X-ray luminosities of erg s-1 and erg s-1.
4 Optical Monitor and Swift Data
The X-ray and UV fluxes from Swift monitoring are shown in Table 5. We show only the UWM2 flux, as the other filters were not used for half of the 2013 observations. The XRT flux shows a very large (a factor of 17) drop from 2008 to 2013, but the UV flux actually increases over that interval. Over the course of the 2013 monitoring, the UV flux is very stable, with only small changes in flux, whereas the X-ray flux varies considerably (a factor of 2.5).
| ID | Segment | ||
|---|---|---|---|
| 36530 | 0011 | 3.68 | — |
| 0031 | 17.00 | 57.11.5 | |
| 91616 | 001 | 0.990.10 | 39.01.2 |
| 36530 | 006 | 1.43 | 40.81.2 |
| 007 | 0.99 | 38.11.2 | |
| 008 | 1.26 | 38.11.2 | |
| 009 | 1.72 | 41.11.2 | |
| 010 | 2.51 | 43.51.2 | |
| 012 | 1.95 | 41.41.2 | |
| 013 | 1.70 | 40.81.2 |
This is confirmed by the OM data (Table 6), which shows a significant increase in UV flux in the 2013 observations over the 2003 observation.
| UV Flux | Optical Flux | |||||
|---|---|---|---|---|---|---|
| Obs. | UVW1 | UVW2 | UVM2 | U | B | V |
| 0150470601 | - | - | - | |||
| 0690870101 | ||||||
| 0690870501 | ||||||
5 Discussion
While it is clear that multiple models can fit the underlying spectrum of this source (e.g. with and without a separate soft excess), this does not change our conclusions about the dominant cause of spectral variability between 2003 and 2013. The model used for the underlying spectrum can effectively be treated as a phenomenological fit, until more detailed data or modelling can distinguish the different models. The spectral differences will still be well modelled with partial covering neutral absorption, regardless of the intrinsic spectrum. While the high-state RGS data from 2003 were well-suited to a two-component warm absorber model (Krongold et al., 2009) the low state data do not provide additional constraints on the absorption features, but reveal strong emission features. These lines appear to be consistent in flux with those found by Krongold et al., and appear much more prominent due to the reduced continuum flux. The constancy of these features implies that they are caused by reflection outside the region being obscured, potentially from a dusty torus or gas in the broad or narrow line regions.
Unlike other observations of AGN low states Mrk 1048 does not show any features of relativistic reflection. Several sources show strong, broad iron lines in these low states (e.g. PG 2112+059 and 1H 0707-495: Schartel et al., 2010; Fabian et al., 2012), and a recent NuSTAR observation of Mrk 335 in a low flux state shows both a strong broad iron line and Compton hump (Parker et al., submitted). We do not see any evidence for relativistic reflection in any of the observations presented here, and unlike the other sources the drop in flux in Mrk 1048 is strictly confined to low energies.
The OM and UVOT data presented in § 4 do not show the large drop in flux seen in the X-ray spectrum of Mrk 1048 in 2013. This suggests that only the inner regions of the disk are affected by this event. Similarly, the Swift monitoring in 2013 reveals that the X-ray flux is much more variable than the UV throughout this period. As the majority of the flux variability in the X-ray band appears to be driven by neutral absorption, this suggests that the cold absorption identified here is not affecting the UV or optical flux. There are two possible explanations for this: firstly, the absorption could be caused by a small cloud or clouds passing in front of the disk, blocking the emission from the compact X-ray emitting region (Dai et al., 2010) but not impacting flux from the much larger UV and optical emitting regions; alternatively, if the absorber is dust-free there will be no extinction of the UV continuum, and the absorber could be much larger.
In the following, we use the results of the analysis shown in this paper to better constrain the location and size of the absorber. With this aim, we use the observed duration of the obscuration event (at least 40 days), the limited variations of the absorption parameters during the event (Table 4 fit 4b and 4c), and the values of those parameters. In particular, we use the non-unity covering fraction (0.6–0.7) and the column density (2.5–4.4 cm-2). We also use the fact that the UV emission is not affected by the absorption event, and the low ionization (consistent with being neutral) of the obscuring material.
The absorption event in 2013 clearly lasted for at least 40 days, based on the long-term light curve (Fig. 3), with only small variations in the covering fraction and column density. This suggests a single large absorber or multiple small clouds passing over the disk, as a single small cloud should cause more rapid variability. However, the effect of a large cloud or multiple small clouds passing over the disk might be expected to be noticeable in the UV band, unless they were dust free. Another issue is the covering fraction. A large absorber (i.e. one significantly larger than the X-ray emitting region) would be expected to fully cover the source. If we assume, based on the non-unity covering fraction, that the absorbing cloud is around the same size as the X-ray emitting region, we can calculate a lower limit on the orbital radius of the cloud. We assume a black hole mass of (Kim et al., 2008; Vasudevan et al., 2009) and a diameter of 10 cm for the corona (based on microlensing constraints, e.g. Dai et al., 2010) and the same for the cloud diameter, . Using the equation for the total orbit duration in terms of the cloud size and Keplerian velocity from Risaliti et al. (2007), we find that in order to have an eclipse that lasts longer than 1 month a small cloud must be located at a radius cm from the source. This corresponds to , which is consistent with a cloud in the broad line region.
For a larger cloud, where the cloud diameter is significantly greater than that of the source, the equation from Risaliti et al. (2007) simplifies such that the eclipse time scales as . We can calculate an upper limit on where such a cloud could lie based on the dust sublimation radius111We note that this estimate assumes that the cloud originated at larger radii - if the cloud had come from inside the sublimation radius, it could have formed dust-free and moved outwards., as the cloud must be dust free in order to not obscure the UV emission. Assuming a bolometric correction factor (Vasudevan & Fabian, 2007) based on the low Eddington ratio (, Vasudevan et al., 2009) and an ionizing flux equal to half the bolometric flux ( erg s-1, Vasudevan et al., 2009), we find a dust sublimation radius of cm using equation 5 from Barvainis (1987). This radius is only marginally smaller than the radius inferred for a cloud of size similar to the X-ray emitting region. Therefore, for a cloud at this radius, the required size to produce an eclipse with a duration greater than 40 days is only marginally larger than the X-ray source, and partial covering of the source is plausible.
A final constraint on the location of the obscuring medium comes from the ionization of the gas (e.g. Risaliti et al., 2007). By replacing the neutral partial covering absorber with an ionized one (modelled using zxipcf, Reeves et al., 2008), we calculate an upper limit on the ionization of . From the definition of , this implies a minimum radius of cm for a cloud with , the density of the gas, given by (see Table 4). This distance scales as , so a larger absorber would have to be further out. However, this constraint is inconsistent with the requirement that a larger cloud lies within the dust sublimation radius, so we conclude that the cloud is most likely to be small (around 1014–1015 cm) and at a radius cm from the source. We note that the density inferred for such a cloud, cm-3, is low compared to that generally assumed for BLR clouds (109–1011 cm-3) or observed in other sources (e.g. Risaliti et al., 2011). One possible explanation for this is that we are not viewing the source through the dense core of the cloud, rather through the more diffuse outer regions (see e.g. Maiolino et al., 2010). This should not greatly affect our estimate of the cloud location or size, as the dust sublimation constraint is independent of the cloud size, the ionization constraint will still apply to the outer regions of the cloud, and partial covering becomes implausible if the cloud is a great deal larger.
Mrk 1048 has a very unusual morphology, with a prominent ring structure (de Vaucouleurs & de Vaucouleurs, 1975) and a gas-rich double nucleus (Perez Garcia & Rodriguez Espinosa, 1996). It is interesting to speculate that this remarkable morphology and recent merger may be responsible for absorption of the AGN, by allowing cold gas to fall in towards the nucleus.
We note that there appears to be a small emission line at around 9 keV in the spectrum of the 2003 observation (Fig. 5 and 4). This feature also appears to be present in the spectra shown in Krongold et al. (2009), although it is difficult to see as the residuals are plotted in standard deviations, rather than as a ratio. The origin of this feature is unclear, as we have selected our source and background regions to avoid contamination from the copper emission in the detector. Regardless, this feature is too small to have a significant impact on any of the results and conclusions based on the data from this observation.
6 Conclusions
We have presented new XMM-Newton observations of a low flux state in Mrk 1048. The spectra show a drop in flux by a factor of below 1 keV compared to an archival observation from 2003, while above 5 keV the spectrum is unaffected.
We find that the source spectrum can be well modelled with a single warm absorption zone, applied to a power law continuum and distant reflection. Based on fits to different energy bands we find that the large soft excess identified in previous work is a model dependent result. The soft excess can be well modelled by warm absorption and distant reflection when the continuum is carefully extrapolated from bands unaffected by absorption.
The drop in flux can be described simply by the addition of a partial covering neutral absorber, with some additional minor changes in the warm absorption. Reflection dominated models can be discounted by the lack of relativistic reflection features and the total absence of variability above 5 keV, and low states driven by intrinsic spectral changes, warm absorption, or both are ruled out by spectral fitting.
We conclude that the low flux state in Mrk 1048 is caused by obscuration of the inner disk by cold gas and find that this is most likely due to an obscuring cloud at a radius of a few cm from the source.
Acknowledgements
The authors would like to thank the anonymous referee for their detailed and helpful comments, and Dom Walton for the xstar grids used in this work. MLP acknowledges financial support from the Science and Technology Facilities Council (STFC), and would like to thank Ranjan Vasudevan and Matt Middleton for helpful discussions. This work is based on observations obtained with XMM-Newton, an ESA science mission with instruments and contributions directly funded by ESA Member States and NASA. At Penn State we acknowledge support from the NASA Swift program through contract NAS5-00136.
References
- Arnaud (1996) Arnaud K. A., 1996, in Astronomical Society of the Pacific Conference Series, Vol. 101, Jacoby G. H., Barnes J., ed, Astronomical Data Analysis Software and Systems V, p. 17
- Barvainis (1987) Barvainis R., 1987, ApJ, 320, 537
- Brandt et al. (1994) Brandt W. N., Fabian A. C., Nandra K., Reynolds C. S., Brinkmann W., 1994, MNRAS, 271, 958
- Breeveld et al. (2010) Breeveld A. A. et al., 2010, MNRAS, 406, 1687
- Burrows et al. (2005) Burrows D. N. et al., 2005, Space Sci. Rev., 120, 165
- Cardelli et al. (1989) Cardelli J. A., Clayton G. C., Mathis J. S., 1989, ApJ, 345, 245
- Cash (1979) Cash W., 1979, ApJ, 228, 939
- Dai et al. (2010) Dai X., Kochanek C. S., Chartas G., Kozłowski S., Morgan C. W., Garmire G., Agol E., 2010, ApJ, 709, 278
- de Vaucouleurs & de Vaucouleurs (1975) de Vaucouleurs G., de Vaucouleurs A., 1975, ApJ, 197, L1
- Denney et al. (2014) Denney K. D. et al., 2014, ArXiv e-prints
- Fabbiano et al. (1992) Fabbiano G., Kim D.-W., Trinchieri G., 1992, ApJS, 80, 531
- Fabian et al. (2014) Fabian A. C., Parker M. L., Wilkins D. R., Miller J. M., Kara E., Reynolds C. S., Dauser T., 2014, MNRAS
- Fabian et al. (2012) Fabian A. C. et al., 2012, MNRAS, 419, 116
- García et al. (2013) García J., Dauser T., Reynolds C. S., Kallman T. R., McClintock J. E., Wilms J., Eikmann W., 2013, ApJ, 768, 146
- Grupe et al. (2007) Grupe D., Komossa S., Gallo L. C., 2007, ApJ, 668, L111
- Grupe et al. (2010) Grupe D., Komossa S., Leighly K. M., Page K. L., 2010, ApJS, 187, 64
- Jansen et al. (2001) Jansen F. et al., 2001, A&A, 365, L1
- Kaastra et al. (2014) Kaastra J. S. et al., 2014, Science, 345, 64
- Kalberla et al. (2005) Kalberla P. M. W., Burton W. B., Hartmann D., Arnal E. M., Bajaja E., Morras R., Pöppel W. G. L., 2005, A&A, 440, 775
- Kim et al. (2008) Kim M., Ho L. C., Peng C. Y., Barth A. J., Im M., Martini P., Nelson C. H., 2008, ApJ, 687, 767
- Krongold et al. (2009) Krongold Y. et al., 2009, ApJ, 690, 773
- Krongold et al. (2005) Krongold Y., Nicastro F., Elvis M., Brickhouse N. S., Mathur S., Zezas A., 2005, ApJ, 620, 165
- Lohfink et al. (2012) Lohfink A. M., Reynolds C. S., Miller J. M., Brenneman L. W., Mushotzky R. F., Nowak M. A., Fabian A. C., 2012, ApJ, 758, 67
- Maiolino et al. (2010) Maiolino R. et al., 2010, A&A, 517, A47
- Nicastro et al. (1999) Nicastro F., Fiore F., Brandt N., Reynolds C. S., 1999, Nuclear Physics B Proceedings Supplements, 69, 501
- Perez Garcia & Rodriguez Espinosa (1996) Perez Garcia A. M., Rodriguez Espinosa J. M., 1996, AJ, 112, 1863
- Poole et al. (2008) Poole T. S. et al., 2008, MNRAS, 383, 627
- Reeves et al. (2008) Reeves J., Done C., Pounds K., Terashima Y., Hayashida K., Anabuki N., Uchino M., Turner M., 2008, MNRAS, 385, L108
- Risaliti et al. (2007) Risaliti G., Elvis M., Fabbiano G., Baldi A., Zezas A., Salvati M., 2007, ApJ, 659, L111
- Risaliti et al. (2013) Risaliti G. et al., 2013, Nature, 494, 449
- Risaliti et al. (2011) Risaliti G., Nardini E., Salvati M., Elvis M., Fabbiano G., Maiolino R., Pietrini P., Torricelli-Ciamponi G., 2011, MNRAS, 410, 1027
- Roming et al. (2005) Roming P. W. A. et al., 2005, Space Sci. Rev., 120, 95
- Roming et al. (2009) Roming P. W. A. et al., 2009, ApJ, 690, 163
- Sanfrutos et al. (2013) Sanfrutos M., Miniutti G., Agís-González B., Fabian A. C., Miller J. M., Panessa F., Zoghbi A., 2013, MNRAS, 436, 1588
- Schartel et al. (2007) Schartel N., Rodríguez-Pascual P. M., Santos-Lleó M., Ballo L., Clavel J., Guainazzi M., Jiménez-Bailón E., Piconcelli E., 2007, A&A, 474, 431
- Schartel et al. (2010) Schartel N., Rodríguez-Pascual P. M., Santos-Lleó M., Jiménez-Bailón E., Ballo L., Piconcelli E., 2010, A&A, 512, A75
- Schlegel et al. (1998) Schlegel D. J., Finkbeiner D. P., Davis M., 1998, ApJ, 500, 525
- Strüder et al. (2001) Strüder L. et al., 2001, A&A, 365, L18
- Vasudevan & Fabian (2007) Vasudevan R. V., Fabian A. C., 2007, MNRAS, 381, 1235
- Vasudevan et al. (2009) Vasudevan R. V., Mushotzky R. F., Winter L. M., Fabian A. C., 2009, MNRAS, 399, 1553
- Veron-Cetty et al. (1983) Veron-Cetty M.-P., Tarenghi M., Veron P., 1983, A&A, 119, 69
- Winter et al. (2012) Winter L. M., Veilleux S., McKernan B., Kallman T. R., 2012, ApJ, 745, 107