Isolation of Flow and Nonflow Correlations by Two- and Four-Particle Cumulant Measurements of Azimuthal Harmonics in 200 GeV Au+Au Collisions
N. M. Abdelwahab57,
L. Adamczyk1,
J. K. Adkins23,
G. Agakishiev21,
M. M. Aggarwal35,
Z. Ahammed53,
I. Alekseev19,
J. Alford22,
C. D. Anson32,
A. Aparin21,
D. Arkhipkin4,
E. C. Aschenauer4,
G. S. Averichev21,
A. Banerjee53,
D. R. Beavis4,
R. Bellwied49,
A. Bhasin20,
A. K. Bhati35,
P. Bhattarai48,
J. Bielcik13,
J. Bielcikova14,
L. C. Bland4,
I. G. Bordyuzhin19,
W. Borowski45,
J. Bouchet22,
A. V. Brandin30,
S. G. Brovko6,
S. Bültmann33,
I. Bunzarov21,
T. P. Burton4,
J. Butterworth41,
H. Caines58,
M. Calderón de la Barca Sánchez6,
J. M. Campbell32,
D. Cebra6,
R. Cendejas36,
M. C. Cervantes47,
P. Chaloupka13,
Z. Chang47,
S. Chattopadhyay53,
H. F. Chen42,
J. H. Chen44,
L. Chen9,
J. Cheng50,
M. Cherney12,
A. Chikanian58,
W. Christie4,
J. Chwastowski11,
M. J. M. Codrington48,
G. Contin26,
J. G. Cramer55,
H. J. Crawford5,
X. Cui42,
S. Das16,
A. Davila Leyva48,
L. C. De Silva12,
R. R. Debbe4,
T. G. Dedovich21,
J. Deng43,
A. A. Derevschikov37,
R. Derradi de Souza8,
B. di Ruzza4,
L. Didenko4,
C. Dilks36,
F. Ding6,
P. Djawotho47,
X. Dong26,
J. L. Drachenberg52,
J. E. Draper6,
C. M. Du25,
L. E. Dunkelberger7,
J. C. Dunlop4,
L. G. Efimov21,
J. Engelage5,
K. S. Engle51,
G. Eppley41,
L. Eun26,
O. Evdokimov10,
O. Eyser4,
R. Fatemi23,
S. Fazio4,
J. Fedorisin21,
P. Filip21,
Y. Fisyak4,
C. E. Flores6,
C. A. Gagliardi47,
D. R. Gangadharan32,
D. Garand38,
F. Geurts41,
A. Gibson52,
M. Girard54,
S. Gliske2,
L. Greiner26,
D. Grosnick52,
D. S. Gunarathne46,
Y. Guo42,
A. Gupta20,
S. Gupta20,
W. Guryn4,
B. Haag6,
A. Hamed47,
L-X. Han44,
R. Haque31,
J. W. Harris58,
S. Heppelmann36,
A. Hirsch38,
G. W. Hoffmann48,
D. J. Hofman10,
S. Horvat58,
B. Huang4,
H. Z. Huang7,
X. Huang50,
P. Huck9,
T. J. Humanic32,
G. Igo7,
W. W. Jacobs18,
H. Jang24,
E. G. Judd5,
S. Kabana45,
D. Kalinkin19,
K. Kang50,
K. Kauder10,
H. W. Ke4,
D. Keane22,
A. Kechechyan21,
A. Kesich6,
Z. H. Khan10,
D. P. Kikola54,
I. Kisel15,
A. Kisiel54,
D. D. Koetke52,
T. Kollegger15,
J. Konzer38,
I. Koralt33,
L. K. Kosarzewski54,
L. Kotchenda30,
A. F. Kraishan46,
P. Kravtsov30,
K. Krueger2,
I. Kulakov15,
L. Kumar31,
R. A. Kycia11,
M. A. C. Lamont4,
J. M. Landgraf4,
K. D. Landry7,
J. Lauret4,
A. Lebedev4,
R. Lednicky21,
J. H. Lee4,
C. Li42,
W. Li44,
X. Li38,
X. Li46,
Y. Li50,
Z. M. Li9,
M. A. Lisa32,
F. Liu9,
T. Ljubicic4,
W. J. Llope56,
M. Lomnitz22,
R. S. Longacre4,
X. Luo9,
G. L. Ma44,
Y. G. Ma44,
D. P. Mahapatra16,
R. Majka58,
S. Margetis22,
C. Markert48,
H. Masui26,
H. S. Matis26,
D. McDonald49,
T. S. McShane12,
N. G. Minaev37,
S. Mioduszewski47,
B. Mohanty31,
M. M. Mondal47,
D. A. Morozov37,
M. K. Mustafa26,
B. K. Nandi17,
Md. Nasim7,
T. K. Nayak53,
J. M. Nelson3,
G. Nigmatkulov30,
L. V. Nogach37,
S. Y. Noh24,
J. Novak29,
S. B. Nurushev37,
G. Odyniec26,
A. Ogawa4,
K. Oh39,
A. Ohlson58,
V. Okorokov30,
E. W. Oldag48,
D. L. Olvitt Jr.46,
B. S. Page18,
Y. X. Pan7,
Y. Pandit10,
Y. Panebratsev21,
T. Pawlak54,
B. Pawlik34,
H. Pei9,
C. Perkins5,
P. Pile4,
M. Planinic59,
J. Pluta54,
N. Poljak59,
K. Poniatowska54,
J. Porter26,
A. M. Poskanzer26,
N. K. Pruthi35,
M. Przybycien1,
J. Putschke56,
H. Qiu26,
A. Quintero22,
S. Ramachandran23,
R. Raniwala40,
S. Raniwala40,
R. L. Ray48,
C. K. Riley58,
H. G. Ritter26,
J. B. Roberts41,
O. V. Rogachevskiy21,
J. L. Romero6,
J. F. Ross12,
A. Roy53,
L. Ruan4,
J. Rusnak14,
O. Rusnakova13,
N. R. Sahoo47,
P. K. Sahu16,
I. Sakrejda26,
S. Salur26,
A. Sandacz54,
J. Sandweiss58,
E. Sangaline6,
A. Sarkar17,
J. Schambach48,
R. P. Scharenberg38,
A. M. Schmah26,
W. B. Schmidke4,
N. Schmitz28,
J. Seger12,
P. Seyboth28,
N. Shah7,
E. Shahaliev21,
P. V. Shanmuganathan22,
M. Shao42,
B. Sharma35,
W. Q. Shen44,
S. S. Shi26,
Q. Y. Shou44,
E. P. Sichtermann26,
M. Simko13,
M. J. Skoby18,
D. Smirnov4,
N. Smirnov58,
D. Solanki40,
P. Sorensen4,
H. M. Spinka2,
B. Srivastava38,
T. D. S. Stanislaus52,
J. R. Stevens27,
R. Stock15,
M. Strikhanov30,
B. Stringfellow38,
M. Sumbera14,
X. Sun26,
X. M. Sun26,
Y. Sun42,
Z. Sun25,
B. Surrow46,
D. N. Svirida19,
T. J. M. Symons26,
M. A. Szelezniak26,
J. Takahashi8,
A. H. Tang4,
Z. Tang42,
T. Tarnowsky29,
J. H. Thomas26,
A. R. Timmins49,
D. Tlusty14,
M. Tokarev21,
S. Trentalange7,
R. E. Tribble47,
P. Tribedy53,
B. A. Trzeciak13,
O. D. Tsai7,
J. Turnau34,
T. Ullrich4,
D. G. Underwood2,
G. Van Buren4,
G. van Nieuwenhuizen27,
M. Vandenbroucke46,
J. A. Vanfossen, Jr.22,
R. Varma17,
G. M. S. Vasconcelos8,
A. N. Vasiliev37,
R. Vertesi14,
F. Videbæk4,
Y. P. Viyogi53,
S. Vokal21,
A. Vossen18,
M. Wada48,
F. Wang38,
G. Wang7,
H. Wang4,
J. S. Wang25,
X. L. Wang42,
Y. Wang50,
Y. Wang10,
G. Webb4,
J. C. Webb4,
G. D. Westfall29,
H. Wieman26,
S. W. Wissink18,
Y. F. Wu9,
Z. Xiao50,
W. Xie38,
K. Xin41,
H. Xu25,
J. Xu9,
N. Xu26,
Q. H. Xu43,
Y. Xu42,
Z. Xu4,
W. Yan50,
C. Yang42,
Y. Yang25,
Y. Yang9,
Z. Ye10,
P. Yepes41,
L. Yi38,
K. Yip4,
I-K. Yoo39,
N. Yu9,
H. Zbroszczyk54,
W. Zha42,
J. B. Zhang9,
J. L. Zhang43,
S. Zhang44,
X. P. Zhang50,
Y. Zhang42,
Z. P. Zhang42,
F. Zhao7,
J. Zhao9,
C. Zhong44,
X. Zhu50,
Y. H. Zhu44,
Y. Zoulkarneeva21,
M. Zyzak151AGH University of Science and Technology, Cracow 30-059, Poland
2Argonne National Laboratory, Argonne, Illinois 60439, USA
3University of Birmingham, Birmingham B15 2TT, United Kingdom
4Brookhaven National Laboratory, Upton, New York 11973, USA
5University of California, Berkeley, California 94720, USA
6University of California, Davis, California 95616, USA
7University of California, Los Angeles, California 90095, USA
8Universidade Estadual de Campinas, Sao Paulo 13131, Brazil
9Central China Normal University (HZNU), Wuhan 430079, China
10University of Illinois at Chicago, Chicago, Illinois 60607, USA
11Cracow University of Technology, Cracow 31-155, Poland
12Creighton University, Omaha, Nebraska 68178, USA
13Czech Technical University in Prague, FNSPE, Prague, 115 19, Czech Republic
14Nuclear Physics Institute AS CR, 250 68 Řež/Prague, Czech Republic
15Frankfurt Institute for Advanced Studies FIAS, Frankfurt 60438, Germany
16Institute of Physics, Bhubaneswar 751005, India
17Indian Institute of Technology, Mumbai 400076, India
18Indiana University, Bloomington, Indiana 47408, USA
19Alikhanov Institute for Theoretical and Experimental Physics, Moscow 117218, Russia
20University of Jammu, Jammu 180001, India
21Joint Institute for Nuclear Research, Dubna, 141 980, Russia
22Kent State University, Kent, Ohio 44242, USA
23University of Kentucky, Lexington, Kentucky, 40506-0055, USA
24Korea Institute of Science and Technology Information, Daejeon 305-701, Korea
25Institute of Modern Physics, Lanzhou 730000, China
26Lawrence Berkeley National Laboratory, Berkeley, California 94720, USA
27Massachusetts Institute of Technology, Cambridge, Massachusetts 02139-4307, USA
28Max-Planck-Institut fur Physik, Munich 80805, Germany
29Michigan State University, East Lansing, Michigan 48824, USA
30Moscow Engineering Physics Institute, Moscow 115409, Russia
31National Institute of Science Education and Research, Bhubaneswar 751005, India
32Ohio State University, Columbus, Ohio 43210, USA
33Old Dominion University, Norfolk, Virginia 23529, USA
34Institute of Nuclear Physics PAN, Cracow 31-342, Poland
35Panjab University, Chandigarh 160014, India
36Pennsylvania State University, University Park, Pennsylvania 16802, USA
37Institute of High Energy Physics, Protvino 142281, Russia
38Purdue University, West Lafayette, Indiana 47907, USA
39Pusan National University, Pusan 609735, Republic of Korea
40University of Rajasthan, Jaipur 302004, India
41Rice University, Houston, Texas 77251, USA
42University of Science and Technology of China, Hefei 230026, China
43Shandong University, Jinan, Shandong 250100, China
44Shanghai Institute of Applied Physics, Shanghai 201800, China
45SUBATECH, Nantes 44307, France
46Temple University, Philadelphia, Pennsylvania 19122, USA
47Texas A&M University, College Station, Texas 77843, USA
48University of Texas, Austin, Texas 78712, USA
49University of Houston, Houston, Texas 77204, USA
50Tsinghua University, Beijing 100084, China
51United States Naval Academy, Annapolis, Maryland, 21402, USA
52Valparaiso University, Valparaiso, Indiana 46383, USA
53Variable Energy Cyclotron Centre, Kolkata 700064, India
54Warsaw University of Technology, Warsaw 00-661, Poland
55University of Washington, Seattle, Washington 98195, USA
56Wayne State University, Detroit, Michigan 48201, USA
57World Laboratory for Cosmology and Particle Physics (WLCAPP), Cairo 11571, Egypt
58Yale University, New Haven, Connecticut 06520, USA
59University of Zagreb, Zagreb, HR-10002, Croatia
Abstract
A data-driven method was applied to measurements of Au+Au collisions at 200 GeV made with the STAR detector at RHIC to isolate pseudorapidity distance -dependent and -independent correlations by using two- and four-particle azimuthal cumulant measurements. We identified a component of the correlation that is -independent, which is likely dominated by anisotropic flow and flow fluctuations. It was also found to be independent of within the measured range of pseudorapidity . The relative flow fluctuation was found to be for particles of transverse momentum less than GeV/. The -dependent part may be attributed to nonflow correlations, and is found to be relative to the flow of the measured second harmonic cumulant at .
keywords:
heavy-ion , flow , nonflow
1 Introduction
Heavy-ion collisions at the Relativistic Heavy Ion Collider (RHIC) provide a means to study the Quark Gluon Plasma (QGP). In a non-central collision, the overlap region of the colliding nuclei is anisotropic. The energy density gradient converts the initial coordinate-space anisotropy into the final momentum-space anisotropy, generally called anisotropic flow. As the system expands, the coordinate-space anisotropy diminishes. Hence, a measurement of flow is most sensitive to the system at the early stage of the collision [1]. Through measurements of anisotropic flow and comparison with hydrodynamic calculations, properties of the early stage of the collision system may be extracted. One of the important variables, the ratio of the shear viscosity to entropy density of the QGP, was found to be not much larger than the conjectured quantum limit of [2].
The momentum-space anisotropic flow can be characterized by the Fourier coefficients, , of the outgoing particle azimuthal () distribution [3]:
(1)
where the participant plane is characterized by the angle , given by the initial participant nucleon (or parton) configuration [4]. The higher harmonics can arise from initial fluctuations such that is not necessarily the same for different . Because is not experimentally accessible, the event plane, constructed from final particle momenta, is used as a proxy for the intial state participant plane. The determination of the anisotropic flow uses particle correlations that are, however, contaminated by intrinsic particle correlations unrelated to the participant plane. Those correlations are generally called nonflow and are due to jet fragmentation and final state interactions, such as quantum statistics, Coulomb and strong interactions, and resonance decays [5].
Similarly, two- and multi-particle correlations are also used to measure anisotropy [6, 5]. For example, the two-particle correlation is given by:
(2)
where is the azimuthal angle between the two particles. In the absence of nonflow, Eq. (2) follows from Eq. (1) with (where , stand for the two particles). Otherwise, , where is the nonflow contribution. Since even a small uncertainty in flow can introduce a large error in the extracted shear viscosity [7], it is important to separate nonflow contributions from flow measurements.
This article describes a method used to separate flow and nonflow in a data-driven way, with minimal reliance on models. We measure two- and four-particle cumulants with different pseudorapidity () combinations. By exploiting the symmetry of the average flow in at midrapidity in symmetric heavy-ion collisions, we separate -independent and -dependent contributions. We associate the -independent part with flow, while the -dependent part is associated with nonflow. This is because flow is an event-wise many-particle azimuthal correlation, reflecting properties on the single-particle level. By contrast, nonflow is a few-particle azimuthal correlation that depends on the distance between the particles.
This article is organized as follows: Section 2.1 gives the experimental details and the criteria for the data selection. Section 2.2 gives two- and four-particle cumulant results and the separation of -independent and -dependent components. Section 3 associates the -independent part with flow and the -dependent part with nonflow, and further discusses flow, flow fluctuation and nonflow.
2 Data Analysis
2.1 Experiment Details and Data Selection
This analysis principally relies on the STAR Time Projection Chamber (TPC) [8]. A total of 25 million Au+Au collisions at 200 GeV, collected with a minimum bias trigger in 2004, were used. The events selected were required to have a primary event vertex within cm along the beam axis () to ensure nearly uniform detector acceptance. The centrality definition was based on the raw charged particle multiplicity within in TPC. The charged particle tracks used in the analysis were required to satisfy the following conditions: the transverse momentum GeV to remove high particles from the jets; the distance of closest approach to the event vertex cm to ensure that the particles are from the primary collision vertex instead of a secondary particle decay vertex; the number of fit points along the track greater than 20, and the ratio of the number of fit points along the track to the maximum number of possible fit points larger than 0.51 for good primary track reconstruction [9]. For the particles used in this paper, the pseudorapidity region was restricted to .
2.2 Analysis Method
In this analysis, the anisotropy was calculated by the two- and four-particle Q-cumulant method using unit weight with a non-uniform acceptance correction [10]. By using the moment of the flow vector, this method makes multi-particle cumulant calculation faster without going over pair or a higher multiplet loop. The non-uniform acceptance correction for 20-30% centrality was 0.7% for the second harmonic two-particle cumulant , and 0.5% for the square root of the second harmonic four-particle cumulant . The largest acceptance correction was 1.8% for at the most central, and 1% for at the most peripheral collisions.
The two-particle cumulant, with one particle at pseudorapidity and another at , is [11]
where . The double brackets represent the average over particle pairs and the average over events, while the single brackets are for the average over events only. The harmonic number is suppressed to lighten the notation. The average flow, , which is the anisotropy parameter with respect to the participant plane, and the flow fluctuation, , are only functions of , because flow reflects the property on the single-particle level. Both and are -independent quantities. However, because of the way the two-particle cumulant is measured, i.e. by two-particle correlation, there could exist a -dependent flow fluctuation component. For example, the event planes determined by particles at different ’s can be different [12]. In Eq. (LABEL:EqV2), denotes this -dependent part of the flow fluctuation. The is the contribution from nonflow, which is generally a function of , but may also depend on .
For the four-particle cumulant, we take two particles at and another two at . For easier discussion, we take the square root of the four-particle cumulant, which has the same order in as the two-particle cumulant. It is given by
where the approximation is that the flow fluctuation is relatively small compared with the average flow [13]. In , the contribution from the two-particle correlations due to nonflow effects is suppresed, while the contribution from the four-particle correlations due to nonflow effects ( is multiplicity) and is, therefore, negligible [14, 15]. The fluctuation gives negative contribution to , while positive to .
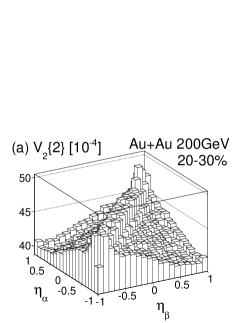
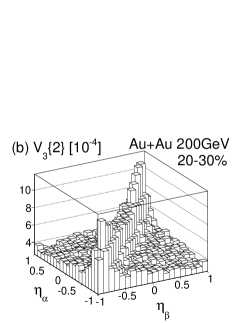
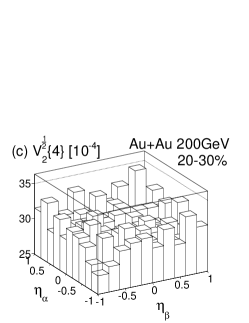
The two- and four-particle cumulants were measured for various pairs and quadruplets. Figure 1 shows the results for 20-30% central Au+Au collisions. Panels (a) and (b) are the two-particle second and third harmonic cumulants, and , respectively. Panel (c) is the square root of the four-particle second harmonic cumulant, . We observe from Fig. 1 that decreases as the gap between and increases. Since the track merging affects the region , the and points along the diagonal were excluded from further analysis. follows the same trend, but the magnitude is smaller. decreases more rapidly with than does . is roughly constant and the magnitude is smaller than that of which is consistent with our expectation that is less affected by the nonflow and the flow fluctuation is negative in .
In order to extract the values of the average flow, , the -dependent and -independent flow fluctuations, and , and the nonflow contribution, , we follow an analysis method described in Ref. [16]. By taking the difference between cumulants at and , we have,
(5)
where or is required. Similarly, this difference for yields,
(6)
Here , and
In symmetric heavy-ion collisions, the difference of the two -independent terms in Eq. (LABEL:EqV2) and (LABEL:EqV4) is zero. Therefore the differences in Eqs. (5) and (6) depend only on the -dependent terms: flow fluctuation and nonflow .
Our goal is to parameterize the flow fluctuation and nonflow . The following part of this section is organized in this way: First, we discuss the empirical functional form for
(7)
obtained from data. Second, we give the result from . Using and , can be determined. Third, we discuss how to obtain and .
Figure 1: The second (a) and third (b) harmonic two-particle cumulants for pairs and the second harmonic four-particle cumulant for quadruplets for 20-30% central Au+Au collisions at 200 GeV.
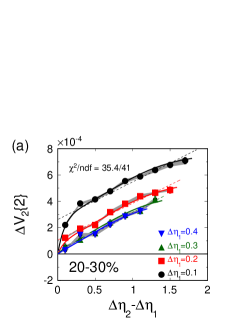
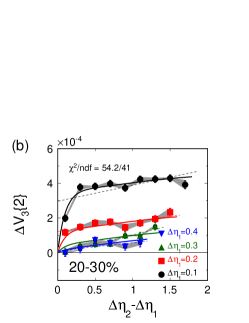
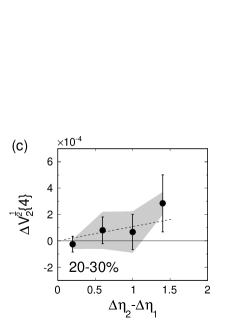
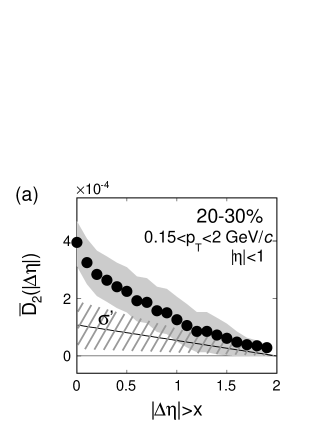
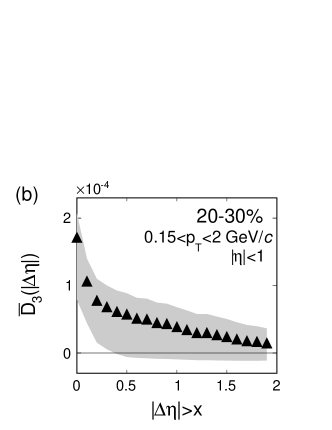
Figure 2: The (a) and (b) difference between the pairs at and . The dashed lines are linear fits for each data set of value separately. The solid curves are a single fit of Eq. (8) to all data points with different . (c) The difference between quadruplets at and . The dashed line is a linear fit to the data points. The gray band is the systematic error. The data are from 20-30% central Au+Au collisions at 200 GeV.
The behavior of data suggests that can be parameterized as
(8)
so that
follows from Eq. (5). Here is how this functional form is chosen. The measured two-particle second harmonic cumulant difference is shown in Fig. 2(a). The data for each value appears to be linear in except near as shown by dashed lines in Fig. 2 (a) and (b). Moreover, the magnitude of decreases with increasing . Linear fits indicate that the intercept decreases exponentially with increasing , and the slopes are all similar. So we can describe this behavior mathematically as . In order to express the measured two-particle cumulant difference in the form of , we make two improvements to our initial guess of the function. First, we add a term that is small for all data with significantly larger than . Second, because the linear term is unbounded in and , we choose to replace it with the subtraction of two wide Gaussian terms. The Gaussian functions tend to zero as the exponents become large, consistent with the behavior of nonflow. The measured two-particle cumulant difference can then be described by Eq. (LABEL:EqDd).
There are four parameters in Eq. (LABEL:EqDd) , and , that were determined by fitting Eq. (LABEL:EqDd) simultaneously to all measured two-particle cumulant difference data points of different . The fit results are shown in Fig. 2(a) as the solid curves with ndf . The parameterization is valid within the fitting errors. The same procedure was repeated for the third harmonic as shown in Fig. 2(b). The fit results give the -dependent part of the two-particle cumulant as Eq. (8). Thus, the form of the function is data-driven.
We then follow a similar procedure on the measured difference of the square root of the four-particle cumulant, Eq. (LABEL:EqV4). We fit the by a linear function , as shown in Fig. 2(c). The slope from the fit is . In Fig. 2(c), each data point is the average of for all at same value. With the result, the contribution from nonflow, , can then also be determined from Eq. (7).
Subtracting the parameterized of Eq. (8) from the measured two-particle cumulants, and , yields, from Eq. (LABEL:EqV2), the -independent terms . Employing also from Eq. (LABEL:EqV4), the values of and may be individually determined.
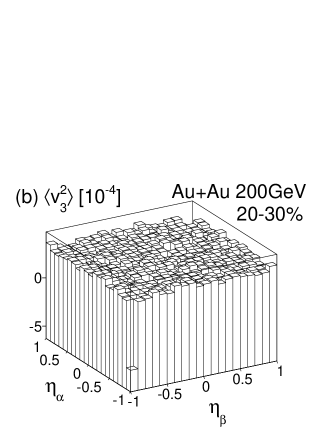
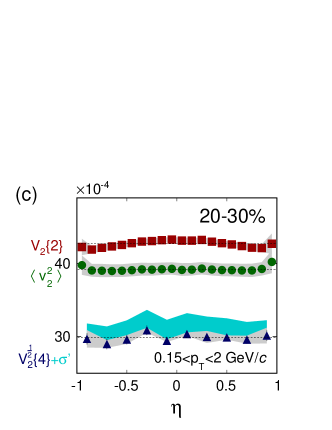
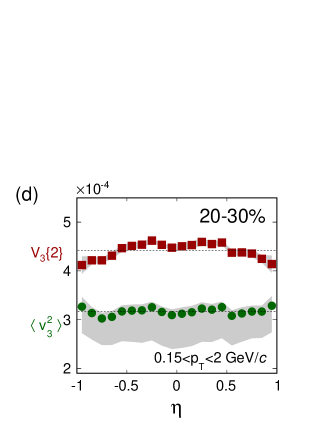
Figure 3: The decomposed for the second (a) and third (b) harmonics for pairs. (c): The two- and four-particle cumulants, (solid red squares) and (solid blue triangles), and the decomposed (solid green dots) as a function of for one particle while averaged over of the partner particle. The cyan band on top of points present . (d): (solid red squares) and (solid green dots) as a function of . The dashed lines are the mean value averaged over for 20-30% central Au+Au collisions at 200 GeV.
2.3 Systematic Uncertainties
The systematic errors for and are estimated by varying event and track quality cuts: the primary event vertex to cm; the number of fit points along the track greater than 15; the distance of closest approach to the event vertex cm. The systematic errors for events at 20-30% centrality were found to be 1% for and 2% for , and the same order of magnitude for other centralities.
The fitting error on the parameterized from is treated as a systematic error, which is 70%, since is consistent with zero in less than 2- standard deviation. Similarly, the fitting errors on the parameters used in the -dependent correlation are treated as systematic errors that are propagated through to the total uncertainty on . In addition, there is a systematic error on that is associated with the choice of fitting function shown as Eq. (8), the magnitude of which was estimated using different forms of the fitting function. The forms tried included: an exponential term plus a linear term, a Gaussian function plus a linear term, an exponential function only, a Gaussian function only, and an exponential function plus a term of the form .
The total estimated uncertainty in the second harmonic of is an average of 40% based on the different sources evaluated. This systematic error on also applies to the decomposed flow through .
3 Results and Discussion
Figure 4: The -dependent component of the two-particle cumulant with -gap, in Eq. (11), of the second (a) and third (b) harmonics is shown as a function of -gap . ( is the x-axis value.) The shaded bands are systematic uncertainties. In (a) the estimated is indicated as the straight line, with its uncertainty of 1 standard deviation as the cross-hatched area for 20-30% central Au+Au collisions at 200 GeV.
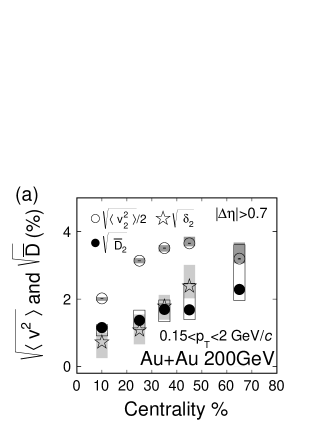
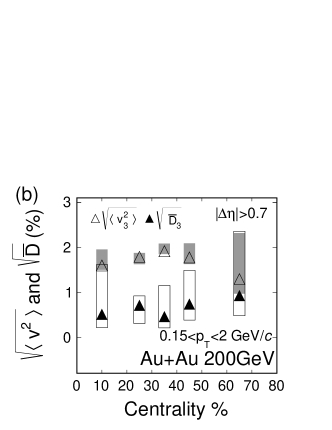
Figure 5: The nonflow, (solid dots), (open stars), (solid triangles) and flow, (open circles), (open triangles) results are shown as a function of centrality percentile for the second (a) and third (b) harmonics, respectively. The statistical errors are smaller than the symbol sizes. The systematic errors are denoted by the vertical rectangles.
Fig. 3(a) and (b) show the decomposed flow with flow fluctuations (see Eq. (LABEL:EqV2)) for and , respectively. The results are found to be independent of for the measured pseudorapidity range . The observed decrease of in Fig. 1 with increasing off diagonal is due to contributions from nonflow and -dependent fluctuations. Note that the analysis method does not make any assumption about the dependence of flow; the flow can be -independent but -dependent. The observation that the decomposed flow and flow fluctuations are independent of is, therefore, significant.
Fig. 3(c) and (d) shows the projections of in Fig. 3(a) and (b) onto one variable. The shaded band shows the systematic uncertainty, dominated by the systematic errors in the subtracted term. For comparison, the projection of the is also shown, where the shaded band is the systematic uncertainty. The projections are the respective quantities as a function of of one particle averaged over all of the other particle. The flows with -independent fluctuation averaged over are and for our range GeV/ in the 20-30% collision centrality range. The quoted statistical errors are from the measurements, while the systematic errors are dominated by the parameterization of . The difference between and in Fig. 3(c) is the versus of one particle averaged over all of the other particle.
Figure 3(c) also shows the projection as a function of as the solid blue triangles. is also independent of . The cyan band shows , with the systematic uncertainty that is dominated by the fitting uncertainty in . The difference between the decomposed and is the flow fluctuation, which is also independent of within the measured acceptance. The relative elliptic flow fluctuation is given by
(10)
where the systematic error is dominated by those in the parameterization of and . The measured relative fluctuation is consistent with that from the PHOBOS experiment [17] and the previous STAR upper limit measurement [18].
Often, a -gap is applied to reduce nonflow contamination in flow measurements. The nonflow with the -gap is calculated as:
(11)
is the acceptance limit in this analysis. is the average of with larger than a certain value. Figure 4 (a) and (b) shows as a function of -gap ( is the x-axis value) for the second and third harmonics, respectively.
The bands are the systematic errors estimated from the fitting errors and the different fitting functions as described previously. These errors are correlated because, for all the points shown, the errors are calculated from the same parameters in the function .
As noted above, is comprised of two parts: the contribution from the -dependent flow fluctuation, , and the term representing the nonflow, . In Fig. 4(a), these two contributors are estimated separately. The straight line is an estimate of . The cross-hatched area is its uncertainty of 1 standard deviation. The difference between the black solid points and the straight line is the nonflow contribution. For both the second harmonic and the third harmonic shown in Fig. 4(a) and Fig. 4(b), respectively, decreases as the -gap between two particles increases. When , is reduced to half of its value when .
Figure 5 shows and for all measured centralities for the second harmonic (a) and the third harmonic (b). [19] is used to present the result. The errors on and are anti-correlated. Taking , the relative magnitude for 20-30% centrality. It is clear that increases as the collisions become more peripheral.
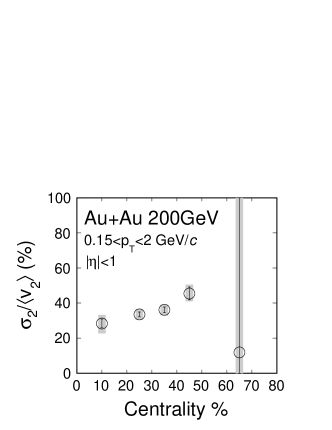
Figure 6: The relative elliptic flow fluctuation centrality dependence in 200 GeV Au+Au collisions. The statistical errors are shown by the error bars. The systematic errors are denoted by the vertical rectangles.
The -dependent nonflow contribution is mainly caused by near-side (small ) correlations. These correlations include jet-like correlations and resonance decays which decrease with increasing . The -independent correlation is dominated by anisotropic flow. However, there should be a -independent contribution from nonflow, such as away-side dijet correlations. This contribution should be smaller than the near-side nonflow contribution, because, in part, some of the away-side jets are outside the acceptance and, therefore, undetected.
Figure 6 shows for all measured centralities. From the central to the peripheral collisions, the relative elliptic flow fluctuation slightly increases. The statistics are limited in the most peripheral centrality bin.
4 Summary
We have analyzed two- and four-particle cumulant azimuthal anisotropies between pseudorapidity bins in Au+Au collisions at 200 GeV from STAR. Exploiting the collision symmetry about midrapidity, we isolate the -dependent and the -independent azimuthal correlations in the data. The -independent correlation, , is dominated by flow and flow fluctuations, and is found to be independent within the measured range of 1 unit of pseudorapidity. In the 20-30% centrality Au+Au collisions, the elliptic flow fluctuation is found to be . The -dependent correlation, , which may be attributed to nonflow, is found to be at for GeV/.
5 Acknowledgements
We thank the RHIC Operations Group and RCF at BNL, the NERSC Center at LBNL, the KISTI Center in Korea, and the Open Science Grid consortium for providing resources and support. This work was supported in part by the Offices of NP and HEP within the U.S. DOE Office of Science, the U.S. NSF, CNRS/IN2P3, FAPESP CNPq of Brazil, the Ministry of Education and Science of the Russian Federation, NNSFC, CAS, MoST and MoE of China, the Korean Research Foundation, GA and MSMT of the Czech Republic, FIAS of Germany, DAE, DST, and CSIR of India, the National Science Centre of Poland, National Research Foundation (NRF-2012004024), the Ministry of Science, Education and Sports of the Republic of Croatia, and RosAtom of Russia.
References
[1] J. Y. Ollitrault, Phys. Rev. D 46, 229 (1992).
[2] P. K. Kovtun, D. T. Son, and A. O. Starinets, Phys. Rev. Lett. 94, 111601 (2005).
[3] S. Voloshin and Y. Zhang, Z. Phys. C 70, 665 (1996).
[4] B. Alver et al. (PHOBOS Collaboration), Phys. Rev. Lett. 98, 242302 (2007).
[5] N. Borghini, P. M. Dinh, and J. Y. Ollitrault, Phys. Rev. C 62, 034902 (2000); N. Borghini, P. M. Dinh, and J. Y. Ollitrault, Phys. Rev. C 63, 054906 (2001); N. Borghini, P. M. Dinh, J. Y. Ollitrault, Phys. Rev. C 64, 054901 (2001).
[6] S. Wang et al., Phys. Rev. C 44, 1091 (1991).
[7] H. Song et al., Phys. Rev. Lett. 106, 192301 (2011).
[8] K. H. Ackermann et al. (STAR Collaboration), Nucl. Phys. A661, 681 (1999).
[9] B. I. Abelev et al. (STAR Collaboration), Phys. Rev. C 79, 034909 (2009).
[10] A. Bilandzic, R. Snellings, and S. Voloshin, Phys. Rev. C, 83, 044913 (2011).
[11] A. M. Poskanzer and S. A. Voloshin, Phys. Rev. C 58, 1671 (1998).
[12] P. Bozek, W. Broniowski, and J. Moreira, Phys. Rev. C 83, 034911 (2011); H. Petersen, V. Bhattacharya, S. A. Bass, and C. Greiner, Phys. Rev. C 84, 054908 (2011); K. Xiao, F. Liu, and F. Wang, Phys. Rev. C 87, 011901 (2013).
[13] J.-Y. Ollitrault, A.M. Poskanzer, and S.A. Voloshin, Phys. Rev. C 80, 014904 (2009).
[14] B. I. Abelev et al. (STAR Collaboration), Phys. Rev. C 77, 054901 (2008).
[15] J. Adams et al. (STAR Collaboration), Phys. Rev. C 72, 014904 (2005).
[16] L. Xu et al., Phys. Rev. C 86, 024910 (2012).
[17] B. Alver et al. (PHOBOS Collaboratoin), Phys. Rev. C 81, 034915 (2010).
[18] G. Agakishiev et al. (STAR Collaboration), Phys. Rev. C 86, 014904 (2012).
[19] H. Agakishiev et al. (STAR Collaboration), Phys. Rev. C 89, 041901(R) (2014).