Theory of Winds from Hot, Luminous Massive Stars
Abstract: The high luminosities of massive stars drive strong stellar winds, through line scattering of the star’s continuum radiation. This paper reviews the dynamics of such line driving, building first upon the standard CAK model for steady winds, and deriving the associated analytic scalings for the mass loss rate and wind velocity law. It next summarizes the origin and nature of the strong Line-Deshadowing Instability (LDI) intrinsic to such line-driving, including also the role of a diffuse-line-drag effect that stabilizes the wind base, and then decribes how both instability and drag are incorporated in the Smooth Source Function (SSF) method for time-dependent simulations of the nonlinear evolution of the resulting wind structure. The review concludes with a discussion of the effect of the resulting extensive structure in temperature, density and velocity for interpreting observational diagnostics. In addition to the usual clumping effect on density-squared diagnostics, the spatial porosity of optically thick clumps can reduce single-density continuum absorption, and a kind of velocity porosity, or vorocity, can reduce the absorption strength of spectral lines. An overall goal is to illuminate the rich physics of radiative driving and the challenges that lie ahead in developing dynamical models for the often complex structure and variability of hot-star winds.
1 Introduction
The strong stellar winds from hot, massive, luminous stars are driven by the scattering of the star’s continuum radiation flux by line-transitions of metal ions (Lucy & Solomon 1970; Castor, Abbott & Klein 1975, hereafter CAK). The effectiveness of such line-driving depends crucially on the Doppler-shifted line-desaturation arising from the wind outflow; this gives the dynamics of such winds an intricate feedback character, in which the radiative driving force that accelerates the outflow depends itself on that acceleration. This leads to a strong, instrinsic Line-Deshadowing Instability (LDI) that is thought make such winds highly structured and variable. The review here summarizes the basic dynamics of such line-driven winds, with an emphasis on simulations of the nonlinear evolution of instability-generated wind structure, and its implications for interpreting wind diagnostics.
2 The CAK/Sobolev Model for Steady Winds
Consider a steady-state stellar wind outflow in which radiative acceleration overcomes the local gravity at radius to drive a net acceleration in the radial flow speed . Since overcoming gravity is key, it is convenient to define a dimensionless equation of motion that scales all accelerations by gravity,
| (1) |
where , , and , with and the escape speed from the stellar surface radius . Eqn. (1) neglects gas pressure terms on the right side, since for isothermal sound speed these are of order compared to competing terms needed to drive the wind.
For pure electron scattering opacity , the scaled radiative acceleration is just the usual Eddington parameter
| (2) |
Because typically , stars with have , with the Eddington limit perhaps even being central to setting a stellar upper mass limit of . Eruptive mass loss from luminous blue variable (LBV) stars like Carinae might in fact be continuum-driven during episodes of super-Eddington luminosity (Davidson & Humphreys 1997; Owocki, Gayley & Shaviv 2004).
But the resonant nature of line (bound-bound) scattering from metal ions leads to an opacity that is inherently much stronger than from free electrons, by a factor set by the “Quality” of the resonance, and fraction of bound electrons in such metal lines (Gayley 1995). For allowed transitions in the UV, , and for solar metalicity, the total bound-electron fraction from all metal lines is . Thus, in the somewhat idealized, optically thin limit that all the line opacity could be illuminated with a flat, unattenuated continuum from the full stellar luminosity, the total line-force would exceed the free-electron force by a factor of order . This implies line-driven winds can be initiated in even moderately massive stars with , while for more massive stars with , the net outward line acceleration in principle could be as high as times the acceleration of gravity!
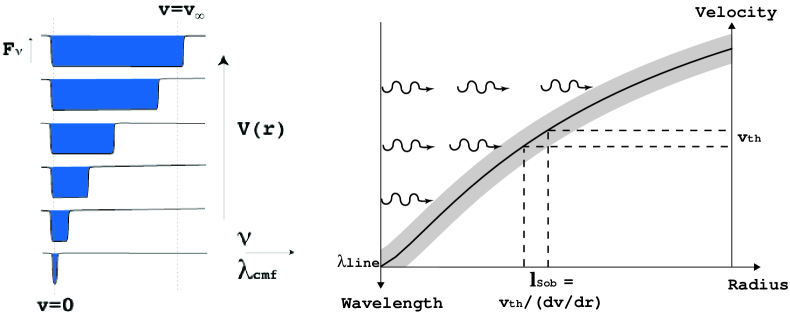
In practice, self-absorption within strong lines limits the acceleration, with the mass loss rate set at the level for which the line driving is just sufficient to overcome gravity. Indeed line-saturation keeps the dense, nearly static layers of the atmosphere gravitationally bound. But as illustrated by figure 1, within the accelerating wind, the Doppler shift of the line-resonance out of the absorption shadow of underlying material exposes the line opacity to a less attenuated flux. This effectively desaturates the lines by limiting the resonance to a layer with width set by the Sobolev length, , and with optical depth proportional to .
For the CAK line-ensemble with a power-law number distribution in line-strength, the cumulative force is reduced by a factor from the optically thin value,
| (3) |
where the second equality defines the CAK “force muliplier” , with111 Here we use a slight variation of the standard CAK notation in which the artificial dependence on a fiducial ion thermal speed is avoided by simply setting . Backconversion to CAK notation is achieved by multiplying by and by . The line normalization offers the advantages of being a dimensionless measure of line-opacity that is independent of the assumed ion thermal speed, with a nearly constant characteristic value of order for a wide range of ionization conditions (Gayley 1995). . The last equality relates the line-force to the flow acceleration, with
| (4) |
Note that, for fixed sets of parameters for the star (, , ) and line-opacity (, ), this constant scales with the mass loss rate as .
Neglecting the small sound-speed term , application of eqn. (3) into (1) gives the CAK equation of motion,
| (5) |
For small (large ), there are two solutions, while for large (small ), there are no solutions. The CAK critical solution corresponds to a maximal mass loss rate, defined by , for which the is tangent to the line at a critical acceleration . Since the scaled equation of motion (5) has no explicit spatial dependence, this critical acceleration applies throughout the wind, and so can be trivially integrated to yield . In terms of dimensional quantities, this represents a specific case of the general “beta”-velocity-law,
| (6) |
where here , and the wind terminal speed . Similarly, the critical value yields, through eqn. (4), the standard CAK scaling for the mass loss rate
| (7) |
These CAK results strictly apply only under the idealized assumption that the stellar radiation is radially streaming from a point-source. If one takes into account the finite angular extent of the stellar disk, then near the stellar surface the radiative force is reduced by a factor , leading to a reduced mass loss rate (Friend & Abbott 1986; Pauldrach, Puls & Kudritzki 1986).
| (8) |
Away from the star, the correction factor increases back toward unity, which for the reduced base mass flux implies a stronger, more extended acceleration, giving a somewhat higher terminal speed, , and a flatter velocity law, approximated by replacing the exponent in eqn. (6) by .
The effect of a radial change in ionization can be approximately taken into account by correcting the CAK force (3) by a factor of the form where is the electron density, is the radiation “dilution factor”, and the exponent has a typical value (Abbott 1982). This factor introduces an additional density dependence to that already implied by the optical depth factor given in eqn. (3). Its overall effect can be roughly accounted with the simple substition in the power exponents of the CAK mass loss scaling law (7). The general tendency is to moderately increase , and accordingly to somewhat decrease the wind speed.
The above scalings also ignore the finite gas pressure associated with a small but non-zero sound-speed parameter . Through a perturbation expansion of the equation of motion (1) in this small parameter, it possible to derive simple scalings for the fractional corrections to the mass loss rate and terminal speed (Owocki & ud-Doula 2004),
| (9) |
For a typical case with and , the net effect is to increase the mass loss rate and decrease the wind terminal speed, both by about 10%.
An important success of these CAK scaling laws is the theoretical rationale they provide for an empirically observed “Wind-Momentum-Luminosity” (WML) relation for OB supergiants (Kudrtizki, Lennon & Pauldrach 1995). Combining the CAK mass-loss law (7) together with the scaling of the terminal speed with the effective escape, we obtain a WML relation of the form,
| (10) |
wherein we have neglected a residual dependence on that is generally very weak for the usual case that is near . Note that the direct dependence provides the scaling of the WML with metalicity . Much current research aims also to understand deviations from this relation for the weak winds of cooler OB dwarfs, and for the strong winds of Wolf-Rayet stars (Puls et al. 2008).
3 Non-Sobolev Models of Wind Instability
The above CAK steady-state model depends crucially on the use of the Sobolev approximation to compute the local CAK line force (3). Analyses that relax this approximation show that the flow is subject to a strong, “line-deshadowing instability” (LDI) for velocity perturbations on a scale near and below the Sobolev length (MacGregor, Harmann & Raymond 1979; Owocki & Rybick 1984, 1985). Moreover, the diffuse, scattered component of the line force, which in the Sobolev limit is nullified by the fore-aft symmetry of the Sobolev escape probability (see figure 2), turns out to have important dynamics effects on the instability through a “diffuse line-drag” (Lucy 1984).
3.1 Linear Analysis of Line-Deshadowing Instability
For sinusoidal perturbations () with wavenumber and frequency , the linearized momentum equation (ignoring the small gas pressure) relating the perturbations in velocity and radiative acceleration implies , which shows that unstable growth, with , requires . For a purely Sobolev model (Abbott 1980), the CAK scaling of the line-force (3) with velocity gradient implies , giving a purely real , and thus a stable wave that propagates inward at phase speed,
| (11) |
which is now known as the “Abbott speed”. Abbott (1980) showed this is comparable to the outward wind flow speed, and in fact exactly equals it at the CAK critical point.
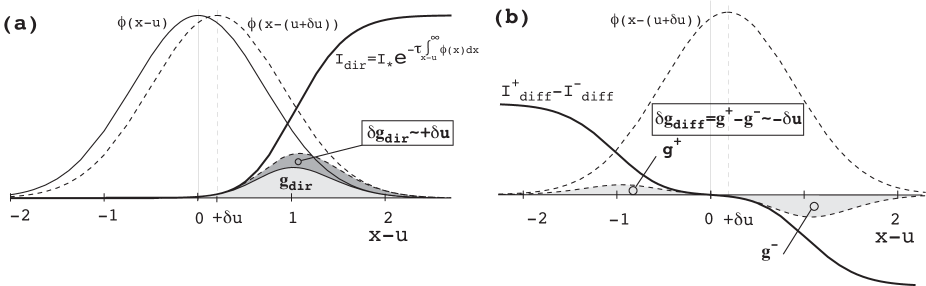
As illustrated in figure 2a, instability arises from the deshadowing of the line by the extra Doppler shift from the velocity perturbation, giving and thus . A general analysis (Owocki & Rybicki 1984) yields a “bridging law” encompassing both effects,
| (12) |
where sets the instability growth rate, and the “bridging length” is found to be of order the Sobolev length . In the long-wavelength limit , we recover the stable, Abbott-wave scalings of the Sobolev approximation, ; while in the short-wavelength limit , we obtain the instability scaling . The instability growth rate is very large, about the flow rate through the Sobolev length, . Since this is a large factor bigger than the typical wind expansion rate , a small perturbation at the wind base would, within this lineary theory, be amplified by an enormous factor, of order !
3.2 Numerical Simulations of Instability-Generated Wind Structure
Numerical simulations of the nonlinear evolution require a non-Sobolev line-force computation on a spatial grid that spans the full wind expansion over several , yet resolves the unstable structure at small scales near and below the Sobolev length. The first tractable approach (Owocki, Castor & Rybicki 1984) focussed on the absorption of the direct radiation from the stellar core, accounting now for the attenuation from intervening material by carrying out a nonlocal integral for the frequency-dependent radial optical depth,
| (13) |
where is the line-profile function, and is the observer-frame frequency from line-center in units of the line thermal width. The corresponding nonlocal form for the CAK line-ensemble force from this direct stellar radiation is
| (14) |
In the Sobolev approximation, (where ), this recovers the CAK form (3). But for perturbations on a spatial scale near and below the Sobolev length, its variation also scales in proportion to the perturbed velocity, leading to unstable amplification. Simulations show that because of inward nature of wave propagation implies an anti-correlation between velocity and density variation, the nonlinear growth leads to high-speed rarefactions that steepen into strong reverse shocks and compress material into dense clumps (or shells in these 1D models) (Owocki et al. 1988).
The assumption of pure-absorption was criticized by Lucy (1984), who pointed out that the interaction of a velocity perturbation with the background, diffuse radiation from line-scattering results in a line-drag effect that reduces, and potentially could even eliminate, the instability associated with the direct radiation from the underlying star. The basic effect is illustrated in figure 2. The fore-aft () symmetry of the diffuse radiation leads to cancellation of the and force components from the forward and backward streams, as computed from a line-profile with frequency centered on the local comoving mean flow. Panel b shows that the Doppler shift associated with the velocity perturbation breaks this symmetry, and leads to stronger forces from the component opposing the perturbation.
Full linear stability analyses accounting for scattering effects (Owocki & Rybicki 1985) show the fraction of the direct instability that is canceled by the line-drag of the perturbed diffuse force depends on the ratio of the scattering source function to core intensity ,
| (15) |
where the latter approximation applies for the optically thin form . The net instability growth rate thus becomes
| (16) |
This vanishes near the stellar surface, where , but it approaches half the pure-absorption rate far from the star, where . This implies that the outer wind is still very unstable, with cumulative growth of ca. e-folds.
Most efforts to account for scattering line-drag in simulations of the nonlinear evolution of the instability have centered on a Smooth Source Function (SSF) approach (Owocki 1991; Feldmeier 1995; Owocki & Puls 1996, 1999). This assumes that averaging over frequency and angle makes the scattering source function relatively insensitive to flow structure, implying it can be pulled out of the integral in the formal solution for the diffuse intensity. Within a simple two-stream treatment of the line-transport, the net diffuse line-force then depends on the difference in the nonlocal escape probabilities associated with forward (+) vs. backward (-) integrals of the frequency-dependent line-optical-depth (13). For a CAK line-ensemble, the net diffuse force can be written in a form quite analogous to the direct component (14),
| (17) |
with
| (18) |
where for the integral bounds in (13) are now from to the outer radius (Owocki & Puls 1996) and the overall normalization for assumes the optically thin source function from eqn. (15). In the Sobolev approximation, both the forward and backward integrals give the same form, viz. , leading to the net cancellation of the Sobolev diffuse force. But for perturbations on a spatial scale near and below the Sobolev length, the perturbed velocity breaks the forward/back symmetry (figure 2b), leading to perturbed diffuse force that now scales in proportion to the negative of the perturbed velocity, and thus giving the diffuse line-drag that reduces the net instability by the factors given in (15) and (16).
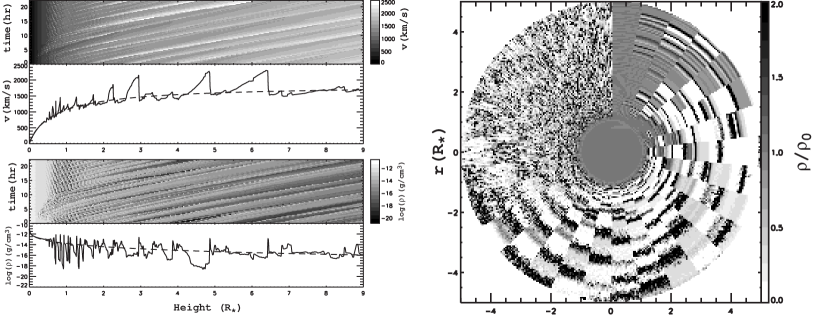
The left panel of figure 3 illustrates the results of a 1D SSF simulation, starting from an initial condition set by smooth, steady-state CAK/Sobolev model (dashed curves). Because of the line-drag stabilization of the driving near the star (eqn. 16), the wind base remains smooth and steady. But away from the stellar surface, the net strong instability leads to extensive structure in both velocity and density, roughly straddling the CAK steady-state. Because of the backstreaming component of the diffuse line-force causes any outer wind structure to induce small-amplitude fluctuations near the wind base, the wind structure, once initiated, is “self-excited”, arising spontaneously without any explict perturbation from the stellar boundary.
In the outer wind, the velocity variations become highly nonlinear and nonmonotonic, with amplitudes approaching km/s, leading to formation of strong shocks. However, these high-velocity regions have very low density, and thus represent only very little material. As noted for the pure-absorption models, this anti-correlation between velocity and density arises because the unstable linear waves that lead to the structure have an inward propagation relative to the mean flow. For most of the wind mass, the dominant overall effect of the instability is to concentrate material into dense clumps. As discussed below, this can lead to overestimates in the mass loss rate from diagnostics that scale with the square of the density.
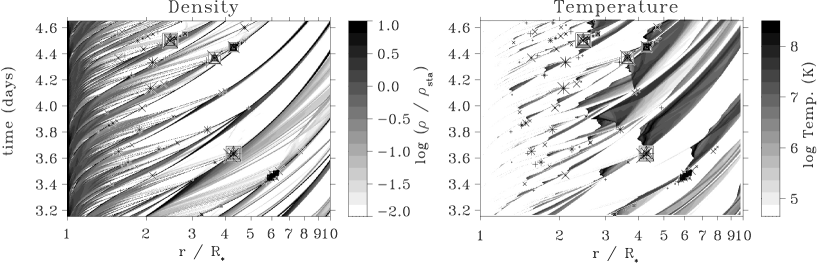
The presence of multiple, embedded strong shocks suggests a potential source for the soft X-ray emission observed from massive star winds; but the rarefied nature of the high-speed gas implies that this self-excited structure actually feeds very little material through the strong shocks needed to heat gas to X-ray emitting temperatures. To increase the level of X-ray emission, Feldmeier, Pauldrach & Puls (1997) introduced intrinsic perturbations at the wind base, assuming the underlying stellar photosphere has a turbulent spectrum of compressible sound waves characterized by abrupt phase shifts in velocity and density. These abrupt shifts seed wind variations that, when amplified by the line-deshadowing instabilty, now include substantial velocity variations among the dense clumps. As illustrated in figure 4, when these dense clumps collide, they induce regions of relatively dense, hot gas which produce localized bursts of X-ray emission. Averaged over time, these localized regions can collectively yield X-ray emission with a brightness and spectrum that is comparable to what is typically observed from such hot stars.
Because of the computational expense of carrying out nonlocal optical depth integrations at each time step, such SSF instability simulations have generally been limited to just 1D. More realistically, various kinds of thin-shell instabilites (Visniac 1994) can be expected to break up the structure into a complex, multidimensional form. A first step to modelling both radial and lateral structure (Dessart & Owocki 2003) is to use a restricted “2D-H+1D-R” approach, extending the hydrodynamical model to 2D in radius and azimuth, but still keeping the 1D-SSF radial integration for the inward/outward optical depth within each azimuthal zone. The right panel of figure 3 shows the resulting 2D density structure within a narrow () wedge, with the time evolution rendered clockwise at fixed time intervals of 4000 sec starting from the CAK initial condition at the top. The line-deshadowing instability is first manifest as strong radial velocity variations and associated density compressions that initially extend nearly coherently across the full azimuthal range of the computational wedge.
But as these initial “shell” structures are accelerated outward, they become progressively disrupted by Rayleigh-Taylor or thin-shell instabilities that operate in azimuth down to the grid scale . Such a 2DR+1DH approach may well exaggerate the level of variation on small lateral scales. The lack of lateral integration needed to compute an azimuthal component of the diffuse line-force means that the model ignores a potentially strong net lateral line-drag that should strongly damp azimuthal velocity perturbations on scales below the lateral Sobolev length (Rybicki, Owocki & Castor 1990). Presuming that this would inhibit development of lateral instability at such scales, then any lateral breakup would be limited to a minimum lateral angular scale of . Further work is needed to address this issue through explicit incorporation of the lateral line-force and the associated line-drag effect.
3.3 Clumping, Porosity and Vorosity: Implications for Mass Loss Rates
Both the 1D and 2D SSF simulations thus predict a wind with extensive structure in both velocity and density. A key question then is how such structure might affect the various wind diagnostics that are used to infer the mass loss rate. Historically such wind clumping has been primarily considered for its effect on diagnostics that scale with the square of the density, The strength of such diagnostics is enhanced in a clumped wind, leading to an overestimate of the wind mass loss rate that scales with , where the clumping factor , with angle brackets denoting a local averaging over many times the clump scale. For strong density contrast between the clump and interclump medium, this is just inverse of the clump volume filling factor, i.e. . 1D SSF simulations by Runacres & Owocki (2002) generally find increasing from unity at the structure onset radius , peaking at a value at , with then a slow outward decline to for . These thus imply that thermal IR and radio emission formed in the outer wind may overestimate mass loss rates by a factor 2-3. The 2D models of Dessart & Owocki (2004) find a similar variation, but somewhat lower peak value, and thus a lower clumping factor than in 1D models, with a peak value of about , apparently from the reduced collisional compression from clumps with different radial speeds now being able to pass by each other. But in both 1D and 2D models, the line-drag near the base means that self-excited, intrinsic structure does not appear till , implying little or no clumping effect on line emission formed in this region. It should be stressed, however, that this is not necessarily a very robust result, since turbulent perturbations at the wind base, and/or a modestly reduced diffuse line-drag, might lead to onset of clumping much closer to the wind base.
If clumps remain optically thin, then they have no effect on single-density diagnostics, like the bound-free absorption of X-rays. The recent analysis by Cohen et al. (2010) of the X-ray line-profiles observed by Chandra from -Pup indicates matching the relatively modest skewing of the profile requires mass loss reduction of about a factor 3 from typical density-squared diagnostic value. However, as discussed in the review by L. Oskinova in these proceeedings, a key issue here is whether the individual clumps might become optically thick to X-ray absorption. In this case, the self-shadowing of material within the clump can the to an overall reduction in the effective opacity of the clumped medium (Owocki, Gayley & Shaviv 2004; Oskinova, Feldmeier, and Hamann 2007),
| (19) |
where is the microscopic opacity, and the optical thickness for clumps of size is . The product is known as the porosity length, which also represents the mean-free-path between clumps. A medium with optically thick clumps is thus porous, with an opacity reduction factor .
However, it is important to emphasize that getting a significant porosity decrease in the continuum absorption of a wind can be quite difficult, since clumps must become optically thick near the radius of the smoothed-wind photosphere, implying a collection of a substantial volume of material into each clump, and so a porosity length on order the local radius. Owocki & Cohen (2006) showed in fact that a substantial porosity reduction the absorption-induced asymmetry of X-ray line profiles required such large porosity lengths . Since the LDI operates on perturbations at the scale of the Sobolev length , the resulting structure is likewise very small scale, as illustrated in the 2D SSF simulations in figure 3. Given the modest clumping factor , it seems clear that the porosity length is quite small, , and thus that porosity from LDI structure is not likely to be an important factor 222Okinova et al. 2004 argue that assuming clumps have a flattened ‘pancake’ shape with normal along the radial direction can allow greater transparency for X-rays passing near the star. But the above 2D SSF simulations suggest that Rayleigh-Taylor and thin-shell instabilities should break up such flattened pancakes into smaller, nearly spherical clumps. for continuum processes like bound-free absorption of X-rays.
The situation is however quite different for line absorption, which can readily be optically thick in even a smooth wind, with Sobolev optical depth . In a simple model with a smooth velocity law but material collected into clumps with volume filling factor , this clump optical depth would be even larger by a factor . As noted by Oskinova, Hamman & Feldmeier (2007), the escape of radiation in the gaps between the thick clumps might then substantially reduce the effective line strength, and so help explain the unexpected weakness of PV lines observed by FUSE (Fullerton et al. 2006), which otherwise might require a substantial, factor-ten or more reduction in wind mass loss rate.
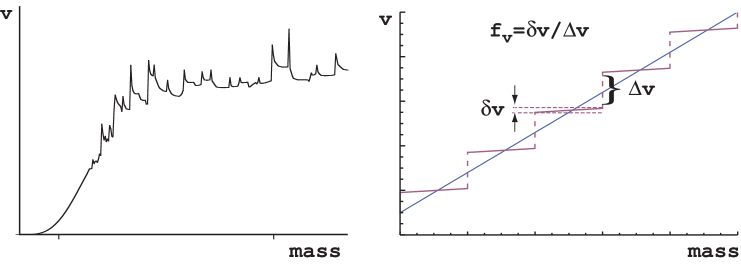
But instead of spatial porosity, the effect on lines is better characterized as a kind of velocity porosity , or “vorosity”, which is now relatively insensitive to the spatial scale of wind structure (Owocki 2008). The left panel of figure 5 illustrates the typical result of 1D dynamical simulation of the wind instability, plotted here as a time-snapshot of velocity vs. a mass coordinate, instead of radius. The intrinsic instability of line-driving leads to a substantial velocity structure, with narrow peaks corresponding to spatially extended, but tenuous regions of high-speed flow; these bracket dense, spatially narrow clumps/shells that appear here as nearly flat, extended velocity plateaus in mass. The right panel of figure 5 illustrates a simplified, heuristic model of such wind structure for a representative wind section, with the velocity clumping now represented by a simple “staircase” structure, compressing the wind mass into discrete sections of the wind velocity law, while evacuating the regions in between; the structure is characterized by a “velocity clumping factor” , set by the ratio between the internal velocity width to the velocity separation of the clumps. The straight line through the steps represents the corresponding smooth wind flow.
The effect of the velocity structure on the line-absorption profile depends on the local Sobolev optical depth, which scales with the inverse of the mass derivative of velocity, , evaluated at a resonance location , where the velocity-scaled, observer-frame wavelength . In a smooth wind with Sobolev optical depth , the absorption profile is given simply by (Owocki 2008), In the structured model, the optical thickness of individual clumps is increased by the inverse of the clumping factor , but they now only cover a fraction of the velocity/wavelength interval. The net effect on the averaged line profile is to reduce the net aborption by a factor (Owocki 2008),
| (20) |
Note that for optically thick lines, , the reduction approaches a fixed value, given in fact by the clumping factor, . If the smooth-wind line is optically thin, , then , which is quite analogous to the opacity reduction for continuum porosity (eqn. 19), if we just substitute for the clump optical depth, .
But a key point here is that, unlike for the continuum case, the net reduction in line absorption no longer depends on the spatial scale of the clumps. Instead one might think of this velocity clumping model as a kind of velocity form of the standard venetian blind, with representing the fractional projected covering factor of the blinds relative to their separation. The case represents closed blinds that effectively block the background light, while small represent cases when the blinds are broadly open, letting through much more light.
3.4 Line-absorption profile from instability simulations
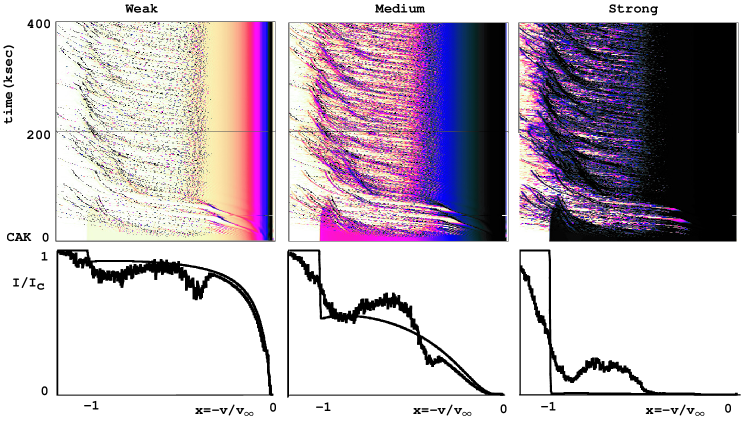
Figure 6 shows results for line-absorption spectra from a typical 1D-SSF instability simulation, wherein the intrinsic instabilty leads to extensive wind structure above a radius of about . The upper panels of figure 6 show the corresponding effect on the dynamic spectra for a weak, mediuim, and strong line. The lower panels compare the associated time-average profile with that of the smooth CAK initial condition. The high level of velocity clumping leads to many tracks of enhanced, even saturated absorption, while at the same time exposing channels between the clumps that allow for increased tranmission of the stellar surface flux. The time-averaged profiles in the lower panels thus show a general reduction in the absorption compared to the smooth, CAK model, most notably at middle wavelengths () relative to blue edge for the CAK terminal speed . On the other hand, the unstable flow faster than the CAK extends the absorption beyond , leading to notable softening of the blue edge.
But a key result here is that even the strong, saturated line has a residual flux of 10-20%. This is qualitatively just the kind of absorption reduction needed to explain the observed moderate strength of the PV line reported by Fullerton et al. (2006). The contribution by Sundqvist in these proceedings describes recent further efforts to account for unstable wind velocity structure in quantitative modeling of both UV resonance lines like PV, as well as recombination lines like . While demonstrating again the importance of accounting for velocity and density structure for interpreting both diagnostics, the results suggest a need for further development in radiation hydrodynamical simulations to properly resolve the velocity structure of clumps, and to induce their onset closer to the wind base, where is formed.
References
Abbott, D. C. 1980, ApJ, 242, 1183.
Abbott, D.C. 1982, ApJ, 259, 282.
Castor, J., Abbott, D., & Klein, R. 1975, ApJ 195, 157 (CAK).
Davidson, K., & Humphreys, R.M. 1997, Ann Rev Astr Astrophys 35, 1
Dessart, L. and Owocki, S.P. 2003, ApJ 406, 1.
Feldmeier, A. 1995, A&A, 299, 523
Feldmeier, A., Puls, J., and Pauldrach, A. 1997, A&A 322, 878.
Friend, D. B. & Abbott, D. C. 1986, ApJ, 311, 701
Fullerton, A. W., Massa, D. L., & Prinja, R. K. 2006, ApJ, 637, 1025
Gayley, K. 1995, ApJ 454, 410
Kudritzki, R. Lennon, D., & Puls, J. 1995, Science with the VLT, J. Walsh & I. Danziger, eds., p. 246
Lucy, L. B. 1984, ApJ, 284, 351
Lucy, L. B., & Solomon, P. 1970, ApJ 159, 879
MacGregor, K. B., Hartmann, L., & Raymond, J. C. 1979, ApJ, 231, 514
Oskinova, L. M., Feldmeier, A., & Hamann, W.-R. 2006, MNRAS, 372, 313
Oskinova, L. M., Hamann, W.-R., & Feldmeier, A. 2007, A&A 476, 1331
Owocki, S. P. 1991, NATO ASIC Proc. 341: Stellar Atmospheres - Beyond Classical Models, 235
Owocki, S. P., Castor, J. I., & Rybicki, G. B. 1988, ApJ 335, 914
Owocki, S. P., & Cohen, D. H. 2006, ApJ 648, 565
Owocki, S., Gayley, K., & Shaviv, N. 2004, ApJ 558, 802
Owocki, S. P., & Puls, J. 1996, ApJ 462, 894
Owocki, S. P., & Puls, J. 1999, ApJ 510, 355
Owocki, S.P. and Rybicki, G.B. 1984, ApJ 284, 337
Owocki, S.P. and Rybicki, G.B. 1985, ApJ 299, 265
Owocki, S. P. 2008, Clumping in Hot-Star Winds, 121, W.-R. Hamann, A. Feldmeier & L.M. Oskinova, eds. Potsdam: Univ.-Verl., 2008 URN: http://nbn-resolving.de/urn:nbn:de:kobv:517-opus-13981
Pauldrach, A., Puls, J., Kudritzki, R.P. 1986, A&A 164, 86
Puls, J., Vink, J., & Najarro, P. 2008, A&A Reviews 16, 209
Rybicki, G.B., Owocki, S.P., and Castor, J.I. 1990, ApJ 349, 274
Sobolev, V. V. 1960, Moving Envelopes of Stars (Cambridge: Harvard University Press).
Vishniac, E.T. 1994, ApJ 428, 186.