Tentative Detection of the Nitrosylium Ion in Space ††thanks: This work was based on observations carried out with the IRAM 30-meter telescope. IRAM is supported by INSU/CNRS (France), MPG (Germany) and IGN (Spain)
Abstract
We report the tentative detection in space of the nitrosylium ion, NO+. The observations were performed towards the cold dense core Barnard 1-b. The identification of the NO+ =2–1 line is supported by new laboratory measurements of NO+ rotational lines up to the =8–7 transition (953207.189 MHz), which leads to an improved set of molecular constants: MHz, kHz, and MHz. The profile of the feature assigned to NO+ exhibits two velocity components at 6.5 and 7.5 km s-1, with column densities of and cm-2, respectively. New observations of NO and HNO, also reported here, allow to estimate the following abundance ratios: (NO)/(NO+), and (HNO)/(NO+). This latter value provides important constraints on the formation and destruction processes of HNO. The chemistry of NO+ and other related nitrogen-bearing species is investigated by the means of a time-dependent gas phase model which includes an updated chemical network according to recent experimental studies. The predicted abundance for NO+ and NO is found to be consistent with the observations. However, that of HNO relative to NO is too high. No satisfactory chemical paths have been found to explain the observed low abundance of HNO. HSCN and HNCS are also reported here with an abundance ratio of . Finally, we have searched for NNO, NO2, HNNO+, and NNOH+, but only upper limits have been obtained for their column density, except for the latter for which we report a tentative 3- detection.
To appear in the Astrophysical Journal October 20, 2014
1 Introduction
Nitrogen is one of the major contributors to the chemical richness of the interstellar medium (ISM), and it is able to form a large variety of molecules in the gas phase, including HCN, HNC, CN, and NH3. The apolar N2 molecule, probably the most abundant N-bearing molecular in the interstellar gas, is nearly unobservable directly by using conventional spectroscopic techniques, so its protonated ion diazenylium, N2H+, is usually used as a tracer of N2. Diazenylium has been observed towards many different astronomical sources (Turner, 1974; Green et al., 1974; Fuente et al., 1993; Daniel et al., 2006, 2007; Daniel & Cernicharo, 2008; Daniel et al., 2013), while ammonium, NH, has been only detected towards the cold dark core B1-b (Cernicharo et al., 2013). The study of all these N-bearing species is of paramount importance to understand interstellar chemistry, in particular for studying the formation of N-bearing organic species, which play a crucial role in the chemistry relevant to life.
From a chemical point of view, the cold dark core B1-b is characterized by a peculiar molecular profuseness. Several molecules like HCNO (Marcelino et al., 2009), CH3O (Cernicharo et al., 2012), and NH3D+ (Cernicharo et al., 2013), have been observed in this object for the first time. Also peculiar is its high degree of deuterium fractionation as shown by the presence of multiply deuterated molecules, such as ND3 (Lis et al., 2002, 2010) or D2CS (Marcelino et al., 2005). Several complex organic molecules, typical of hot cores or corinos, have also been reported towards B1-b (Öberg et al., 2010; Marcelino, 2007; Cernicharo et al., 2012). Because of its rich chemistry and its great interest for the comprehension of the star formation process, B1-b was targeted within the Large Program ‘Astrochemical Surveys at IRAM’ (ASAI, Lefloch & Bachiller, 2014, in preparation).
Interstellar molecules containing nitrogen and oxygen simultaneously have been poorly studied until now. Nitric oxide has been detected toward a number of star-forming clouds (Liszt & Turner, 1978; Gerin et al., 1992, and references therein). Halfen et al. (2001) searched for NO+ and NO2 towards SgrB2(N) without success.
In this work we report on the discovery for the first time in space of the nitrosylium ion, NO+, together with observations of several lines of other molecules containing the NO group. New laboratory experiments have been performed in order to improve the rotational constants of nitrosylium. The derived abundances are discussed in the context of time dependent models of the gas phase Nitrogen chemistry. Although at low frequencies B1 exhibits a large number of lines, its low kinetic temperature produces a significant reduction of the line intensities at high frequency. Hence, its spectral density above 200 GHz is very low (Cernicharo et al., 2013). The detection of the nitrosylium ion is based on just one line but it is the only feature, together with the transition 111-000 of -SD2, appearing over 1.8 GHz of bandwidth and just at the predicted frequency of the J=2-1 line of NO+.
2 Observations
The observations presented in this paper are part of a complete spectral line survey at 3, 2 and 1 mm of the cold core B1-b (=03h 33m 20.8s, =31∘ ) within the above mentioned IRAM large program ASAI. All observations were performed at the IRAM 30-m radiotelescope at Pico Veleta (Spain) using the Eight MIxer Receivers (EMIR) and the fast Fourier Transform Spectrometers (FTS) with a spectral resolution of 198 kHz, during several runs in 2012 and 2013. The observations were carried out in wobbler switching mode, with a throw of 120″, providing excellent baselines. These data were complemented with a high spectral resolution (50 kHz) frequency sweep at 3 mm obtained between 2003-2007, and January and March 2012 (Marcelino et al., 2005, 2007, 2009; Cernicharo et al., 2012, and in prep.). These 3 mm high spectral resolution observations were performed in Frequency Switching mode with a frequency throw of 7.14 MHz, which removes standing waves between the secondary and the receivers.
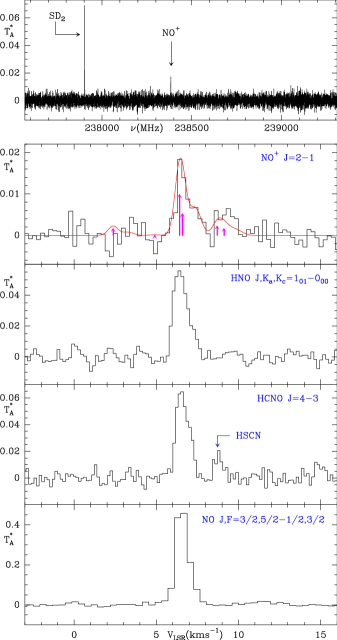
Weather conditions were mostly average winter to moderate summer for all observations, with 1–10 mm of precipitable water vapor. System temperatures were in the range 80–300 K. Each frequency setup was observed for hrs, with pointing checks in between on strong and nearby quasars. Pointing errors were always within 3′′. The 30m beam sizes are between at 3 mm, at 2 mm, and at 1 mm. The spectra were calibrated in antenna temperature corrected for atmospheric attenuation using the ATM package (Cernicharo, 1985; Pardo et al., 2001). Figure 1 shows a selection of the observed spectra and Table 1 provides the line parameters for all the observed lines of NO+, NO, HNO and HCNO. For each observed line the error quoted for T corresponds to the noise sensitivity per spectral channel. The adopted main beam efficiencies are 0.8, 0.73, 0.58, and 0.54 for frequencies 81-115, 150-165, 238, and 250 GHz, respectively. Main beam antenna temperature for the observed lines can be obtained from the antenna temperature by dividing by the corresponding main beam efficiencies.
The first ASAI observing runs at 1mm started in January 2013 and revealed a 3- feature just at the expected frequency of the =2-1 line of NO+. In order to improve its signal-to-noise ratio, we performed additional observations in September, November and December 2013. The final averaged spectrum, with a noise rms level of 2 mK per 200 KHz channel (total observing time of 43 hours on-source), is shown in Figure 1 together with selected observed lines of the related species HNO, NO, and HCNO. The top panel of this figure shows the complete observed spectrum at 238.4 GHz and covering 1.8 GHz of bandwidth. It shows only two lines, one from SD2 and the other one right at the predicted frequency of the J=2-1 transition of NO+. During these observations lines from unrelated species such as HSCN were also detected (see Figure 1). All data have been processed using the GILDAS software package (http://www.iram.fr/IRAMFR/GILDAS/).
The =2-1 transition of NO+ has several hyperfine components (see Table 1, 2, Figure 1 and Section 3). The strongest pair (=2-1 & 3-2), at an averaged frequency of 238383.17 MHz, is separated by only 140 kHz, so it is not spectrally resolved by our observations. Another hyperfine line should be present at a velocity of -4.1 km s-1 (relative to the velocity of the source, see Figure 1). Its relative intensity with respect the strongest one is 1/8.6, so it is well below our detection limit. Finally, another pair of hyperfine components (=2-2 & 1-0), separated by 340 kHz, should be present at +2.4 km s-1 with an intensity relative to the strongest component of 1/3.7. As Figure 1 shows, a spectral feature is well detected at the expected position of this pair of lines.
The density of spectral lines in B1-b is rather low at the frequency of the NO+ =2-1 transition (see Cernicharo et al., 2013) but, nevertheless, we searched for alternative line candidates in the MADEX code (Cernicharo, 2012), which contains spectroscopic information for more than 5013 spectral entries, and the CDMS and JPL catalogs (Müller et al., 2005; Pickett et al., 1998), and we found no plausible molecular lines, other than that of NO+, able to explain the observed features. This feature is the only one appearing over the 1.8 GHz spectrum shown in Figure 1 (together with a transition of SD2). The difference between the observed frequency and that predicted from laboratory data is less than 20 KHz. This could make us confident with the assignment of the observed feature to the nitrosylium ion. Unfortunately, the second strongest group of hyperfine components is detected just above 3 level. Hence, we consider our assignment of the observed feature to NO+ as a tentative detection.
| Molecule | Transition | Eupp | Aij | Sij | Tdv | VLSR | v | T | |
| (MHz) | (K) | (s-1) | (K km s-1) | (km s-1) | (km s-1) | (K) | |||
| NO+ | 2 2 - 1 1 | 238383.111( 35) | 17.2 | 6.130 10-6 | 1.500 | ||||
| 2 3 - 1 2 | 238383.255( 36) | 17.2 | 8.174 10-6 | 2.800 | 0.011( 2) | 6.43(8) | 0.58(12) | 0.017(2) | |
| 0.008( 2) | 7.23(9) | 0.95(30) | 0.008(2) | ||||||
| 2 2 - 1 2 | 238381.099( 83) | 17.2 | 2.043 10-6 | 0.500 | |||||
| 2 1 - 1 0 | 238381.435( 73) | 17.2 | 4.541 10-6 | 0.667 | 0.007( 2) | 6.92(9) | 1.11(24) | 0.006(2) | |
| 2 1 - 1 1 | 238386.464(130) | 17.2 | 3.406 10-6 | 0.006 | |||||
| HNO | 101 - 000 | 81477.490(100) | 3.9 | 2.226 10-6 | 1.000 | 0.069( 2) | 6.48(2) | 1.10( 4) | 0.059(3) |
| HNO | 202 - 101 | 162937.949(100) | 11.7 | 3.561 10-5 | 2.000 | 0.070( 5) | 6.58(3) | 0.88( 8) | 0.074(6) |
| HNO | 212 - 111 | 159802.294(100) | 36.1 | 2.520 10-5 | 1.500 | 0.013( 7) | 6.68(9) | 0.71(15) | 0.017(9) |
| NO | 3/2 -1 5/2 - 1/2 1 3/2 | 150176.4566( 7) | 7.2 | 3.310 10-7 | 2.000 | 0.494( 7) | 6.56(1) | 0.92( 2) | 0.504(8) |
| NO | 3/2 -1 3/2 - 1/2 1 1/2 | 150198.7573( 7) | 7.2 | 1.839 10-7 | 0.740 | 0.182( 7) | 6.55(2) | 0.87( 4) | 0.195(8) |
| NO | 3/2 -1 3/2 - 1/2 1 3/2 | 150218.7421( 7) | 7.2 | 1.471 10-7 | 0.592 | 0.174( 8) | 6.56(2) | 0.99( 6) | 0.165(8) |
| NO | 3/2 -1 1/2 - 1/2 1 1/2 | 150225.6504( 7) | 7.2 | 2.943 10-7 | 0.592 | 0.151( 6) | 6.57(2) | 0.84( 4) | 0.169(7) |
| NO | 3/2 1 3/2 - 1/2 -1 3/2 | 150439.0941( 7) | 7.2 | 1.480 10-7 | 0.593 | 0.168( 6) | 6.52(2) | 1.02( 5) | 0.155(7) |
| NO | 3/2 1 5/2 - 1/2 -1 3/2 | 150546.4622( 7) | 7.2 | 3.334 10-7 | 2.000 | 0.529( 5) | 6.54(1) | 0.95( 1) | 0.525(6) |
| NO | 3/2 1 1/2 - 1/2 -1 1/2 | 150580.5531( 7) | 7.2 | 2.964 10-7 | 0.592 | 0.162( 7) | 6.52(2) | 0.94( 5) | 0.162(7) |
| NO | 3/2 1 3/2 - 1/2 -1 1/2 | 150644.3489( 7) | 7.2 | 1.853 10-7 | 0.739 | 0.189( 7) | 6.48(2) | 0.94( 4) | 0.189(7) |
| NO | 5/2 1 7/2 - 3/2 -1 5/2 | 250436.8416(11) | 19.2 | 1.841 10-6 | 3.200 | 0.229( 3) | 6.47(1) | 0.67( 1) | 0.323(3) |
| 0.100( 3) | 6.99(1) | 0.75( 4) | 0.126(3) | ||||||
| NO | 5/2 1 5/2 - 3/2 -1 3/2 | 250440.6532(11) | 19.2 | 1.547 10-6 | 2.020 | 0.126( 3) | 6.43(2) | 0.61( 3) | 0.193(3) |
| 0.081( 4) | 6.90(2) | 0.68( 6) | 0.111(3) | ||||||
| NO | 5/2 1 3/2 - 3/2 -1 1/2 | 250448.5255(11) | 19.2 | 1.381 10-6 | 1.200 | 0.129( 2) | 6.58(2) | 0.87( 2) | 0.138(3) |
| NO | 5/2 1 3/2 - 3/2 -1 3/2 | 250475.4186(11) | 19.2 | 4.420 10-7 | 0.384 | 0.038(12) | 6.63(6) | 0.84( 5) | 0.043(3) |
| NO | 5/2 1 5/2 - 3/2 -1 5/2 | 250482.9387(11) | 19.2 | 2.947 10-7 | 0.384 | 0.034(12) | 6.49(9) | 0.68(12) | 0.047(3) |
| NO | 5/2 -1 5/2 - 3/2 1 5/2 | 250708.2416(11) | 19.3 | 2.958 10-7 | 0.384 | 0.036(12) | 6.58(3) | 0.90( 8) | 0.037(3) |
| NO | 5/2 -1 3/2 - 3/2 1 3/2 | 250753.1342(11) | 19.3 | 4.437 10-7 | 0.384 | 0.022(18) | 6.41(9) | 0.50(14) | 0.040(3) |
| 0.010(19) | 6.93(9) | 0.58(13) | 0.017(3) | ||||||
| NO | 5/2 -1 7/2 - 3/2 1 5/2 | 250796.4225(11) | 19.3 | 1.849 10-6 | 3.200 | 0.259( 3) | 6.52(2) | 0.73( 1) | 0.334(3) |
| 0.061( 2) | 7.08(9) | 0.75( 6) | 0.077(3) | ||||||
| NO | 5/2 -1 5/2 - 3/2 1 3/2 | 250815.6097(11) | 19.3 | 1.554 10-6 | 2.020 | 0.214( 3) | 6.58(2) | 0.92( 3) | 0.222(3) |
| NO | 5/2 -1 3/2 - 3/2 1 1/2 | 250816.9300(11) | 19.3 | 1.387 10-6 | 1.200 | 0.121( 3) | 6.58(2) | 0.82( 2) | 0.140(3) |
| NNO | 4 - 3 | 100491.7196(11) | 12.1 | 1.358 10-7 | 4.000 | 0.003( 1) | 6.56(15) | 0.61(15) | 0.005(2) |
| NNO | 6 - 5 | 150735.0453(16) | 25.3 | 4.759 10-7 | 6.000 | 0.021 | |||
| HCNO | 4 - 3 | 91751.3120(41) | 11.0 | 3.838 10-5 | 4.000 | 0.046( 7) | 6.47(5) | 0.65( 8) | 0.067(3) |
| 0.016( 7) | 7.06(8) | 0.50(13) | 0.031(3) | ||||||
| HCNO | 5 - 4 | 114688.3827(47) | 16.5 | 7.667 10-5 | 5.000 | 0.033( 3) | 6.56(3) | 0.64( 6) | 0.049(8) |
| HCNO | 6 - 5 | 137624.9341(50) | 23.1 | 1.345 10-4 | 6.000 | 0.023( 3) | 6.74(7) | 1.00(16) | 0.022(3) |
| HCNO | 7 - 6 | 160560.8717(50) | 30.8 | 2.160 10-4 | 7.000 | 0.020( 7) | 7.0(2) | 1.09(35) | 0.018(8) |
| NNOH+ | 404 - 303 | 89541.4026(63) | 10.7 | 1.073 10-5 | 4.000 | 0.008( 2) | 6.71(9) | 0.91(21) | 0.009(3) |
| NNOH+ | 505 - 404 | 111925.3586(71) | 16.1 | 2.144 10-5 | 5.000 | 0.014 | |||
| NNOH+ | 606 - 505 | 134308.3849(75) | 22.6 | 3.761 10-5 | 6.000 | 0.018 | |||
| NNOH+ | 707 - 606 | 156690.2956(75) | 30.1 | 6.039 10-5 | 7.000 | 0.024 | |||
| HNNO+ | 4 - 3 =5-4 | 94369.817( 46) | 11.3 | 4.508 10-5 | 4.890 | 0.021 | |||
| HNNO+ | 4 - 3 =4-3 | 94369.838( 46) | 11.3 | 4.226 10-5 | 3.750 | 0.021 | |||
| HNNO+ | 4 - 3 =3-2 | 94369.897( 46) | 11.3 | 4.140 10-5 | 2.860 | 0.021 |
Predicted rest frequencies, Einstein coefficients and line strengths are from the MADEX code (Cernicharo, 2012). Quantum numbers are , and for NO+; , , and for HNO and NNOH+; for HCNO; , (parity), and for NO (); , =0, =, and for HNNO+. The number in parentheses correspond to the uncertainty referred to the last digits of the predicted or observed values. Upper limits for the reported line parameters correspond to 3 values.
3 Laboratory Spectroscopy
While the nitrosyl radical has a electronic ground state, that of nitrosylium is . The dipole moment of NO+ has not been measured in the laboratory, but it has been calculated with quantum chemistry computations to be 0.36 D (Jungen & Lefebvre-Brion, 1970; Billingsley, 1973; Chambaud & Rosmus, 1990; Polák & Fišer, 2004). High resolution spectroscopic data of NO+ are rather scarce. Two pure rotational transitions with resolved nitrogen quadrupolar hyperfine structure transitions have been measured in the millimeter-wave band (Bowman et al., 1982). In the infrared region, a total of eight lines of the fundamental band have been observed using diode laser spectroscopy (Ho et al., 1991; Hilpert et al., 1994). In addition, about fourty ro-vibrational transitions of the fundamental and first hot bands have been recorded with the MIPAS interferometer onboard the EnviSat satellite (López-Puertas et al., 2006). The - emission bands of NO+ have been studied by Alberti & Douglas (1975).
In view of the limited number of spectroscopic data available in the millimeter-wave range, we decided to extend the laboratory measurements of rotational transitions of NO+ up to frequencies just below 1 THz. It is worth mentioning that the high atmospheric opacity prevents detecting interstellar NO+ at the lowest rotational transition =1-0 (119.19 GHz) from ground-based observations due to a molecular oxygen line falling nearby.
Details of the submillimeter-wave spectrometer employed in this study have been described previously by Ozeki et al. (2011). Briefly speaking, it consists of a 2 m free space, double-jacketed Pyrex cell allowing liquid-nitrogen flow through the outer jacket, a liquid He-cooled InSb hot electron bolometer, and a submillimeter-wave source. The submillimeter-wave radiation between 580 and 955 GHz was provided by three phase-locked backward wave oscillators (Istok Company).
The nitrosylium ion was produced in a magnetically extended (200G) negative glow dc discharge in NO employed as precursor. The discharge current maintained in the plasma was adjusted to 8 mA. We found that the plasma did not need to be cooled using liquid nitrogen flow, and that the use of a buffer gas such as argon or helium was not necessary.
Vibrational excitation of the ion was high enough to detect rotational lines in vibrational states up to . We extended the measurements to the 15NO+ isotopologue, which was also observed in vibrationally excited states. Data obtained for these two isotopic species were sufficient to perform an isotopically invariant fit using the generalised Dunham expansion of the energy levels. The corresponding results will be published elsewhere, and we focus here on the conclusions relative to the main species observed in its ground vibrational state.

NO+ is a close-shell molecule and the electric quadrupole moment of Nitrogen () splits rotational energy levels with in three hyperfine sublevels denoted by }. For the only possible nuclear spin sublevel corresponds to . Note that due to the Doppler-limited linewidth of the high-, newly measured transitions prevented the observation of the hyperfine-structure components. Prediction and least-squares analysis of observed millimeter-wave transitions have been carried out using Pickett’s CALPGM package (Pickett, 1991). In total, four new transitions have been observed in the range 595-954 GHz, corresponding to . Figure 2 shows the spectral line due to the transition near 953 GHz. Table 2 lists the frequencies of all transitions measured in the millimeter-wave range. The derived molecular constants are (MHz) =59597.1379(62), =0.169428(65), and =-6.72(15). The least-squares fitting procedure gave a standard deviation of 80 kHz. As expected, this new determination of the NO+ molecular parameters significantly improves the previous determination by Bowman et al. (1982) (=59597.132(16), =0.171(1), =-6.76(10))
| (MHz) | a (MHz) | ||
|---|---|---|---|
| 238381.200b | |||
| 238383.200b | |||
| 238386.430b | 0.058 | ||
| 357564.320b | 0.173 | ||
| 357564.320b | 0.173 | ||
| 357564.320b | 0.173 | ||
| 595886.721c | 0.066 | ||
| 715019.297c | 0.034 | ||
| 834127.480c | 0.004 | ||
| 953207.189c | 0.038 |
a . b Bowman et al. (1982). c This work.
4 Results and Discussion
The astronomical data were analyzed using the MADEX code (Cernicharo, 2012). Taking into account the low value of the dipole moment of NO+, 0.36 D (Polák & Fišer, 2004), we could expect the population of its rotational levels to be very close to thermal equilibrium in B1-b. At a distance of 300 pc, the Barnard 1 (B1) dark cloud, which is part of the large scale complex of molecular clouds in Perseus (Bachiller & Cernicharo, 1984; Bachiller et al., 1990), comprises several dense cores, at different evolutionary stages of star formation. While B1-a and B1-c are known to host class 0 sources, with developed outflows (Hatchell et al., 2005), the B1-b core appears to be more quiescent. B1-b consists of two very dense cores, B1-bN and B1-bS, separated by 20” (Huang & Hirano, 2013) which are considered to be protostellar sources even younger than Class 0 protostars, possibly First Hydrostatic Cores (FHSC) according to Pezzuto et al. (2012). A more evolved third source, named B1-b-Spitzer because it was identified in Spitzer infrared data, exhibits deep absorption features from ices (Jørgensen et al., 2006). The three sources are deeply embedded in a protostellar envelope of large column density, N(H2)=1023 cm-2, large volume density, n(H2)105 cm-3 (Daniel et al., 2013), and low kinetic temperature, T 12-15 K, which seems essentially unaffected by the internal sources (Marcelino et al., 2005, 2009; Lis et al., 2010). Hence, most low- lines of diatomic and triatomic molecules could exhibit rotational temperatures close to the kinetic temperature of the gas.
Assuming a rotational temperature of 12 K, we derive a column density for NO+ of (1.50.5) 1012 cm-2 for the velocity component at 6.5 km s-1 which is the one exhibiting a large number of complex molecules (Öberg et al., 2010; Cernicharo et al., 2012, 2013). A second velocity component, at 7.2-7.5 km s-1, is detected in spectral lines of several molecular species (see, e.g., Marcelino et al., 2005; Öberg et al., 2010; Huang & Hirano, 2013). For this component we obtain a column density of (6.53)1011 cm-2. The combined column density of NO+ over the two velocity components is (2.20.8)1012 cm-2.
The observations of HNO and NO have a lower spectral resolution than that of NO+ (except for the HNO 101-000 line at 3mm), so the two velocity components are blended in the corresponding line profiles. However, the measured linewidths are larger than those of the 3 mm window for which we used a spectral resolution of 49 kHz. From the parameters listed in Table 1, we derive a column density for HNO and NO of (20.5)1012 and (1.10.2)1015 cm-2, respectively. Indeed these values have to be considered as corresponding to the average of the two velocity components. Hence, the abundance ratios between the three NO-bearing species NO, NO+ and HNO are: (NO)/(NO+)511, (NO)/(HNO)550, and (NO+)/(HNO)1.
Another interesting molecule containing the NO group is fulminic acid, HCNO, which was previously observed by Marcelino et al. (2009). The line parameters for the HCNO lines observed in our line survey are reported in Table 1. The HCNO column density derived from these new data, 21011 cm-2, is in very good agreement with the results of Marcelino et al. (2009) who discussed the chemistry of this species.
We have also searched in our line surveys at 3 and 2 mm for the =4-3 and =6-5 lines of NNO. A 2.5- feature has been observed just at the frequency of the =4-3 transition (see Table 1). The 3- upper limit to the column density of NNO is 41012 cm-2. A search for the 111-000 strongest hyperfine component of NO2 at 253338.12 MHz (Eupper=12.2 K) provides only a 3- upper limit to its column density of 51012 cm-2. We have searched for the two related cations NNOH+ and HNNO+. For the latter isomer of N2OH+, which is less stable by 6 kcal/mol (Javahery et al., 1990), we derive an upper limit (3-) to its column density of 1.51011 cm-2. For the more stable isomer, NNOH+, we have observed a feature for its 404-303 transition (see Table 1) at 3- level. The corresponding column density is 1011 cm-2. However, more sensitive observations are needed to confirm the detection of this ion for the first time in space.
Figure 1 shows the 808-707 line of HSCN. This molecule was detected by Halfen et al. (2009) towards SgrB2(N) and towards TMC1 by Adande et al. (2010). From the observed intensity and linewidth of this transition (TMB=0.021 K, v=0.8 km s-1), we derive a column density of (20.5)1011 cm-2. HNCS, first detected in space by (Frerking et al., 1979), was also detected in our survey. From the observed line parameters for its 707-606 transition (TMB=0.014 K, v=0.8 km s-1), we derive N(HNCS)=(2.50.9)1011 cm-2. Hence, the abundance ratio (HNCS)/(HSCN) in B1-b is found to be 1, similar to the value estimated in TMC1 by Adande et al. (2010), and in SgrB2(N) by Halfen et al. (2009). Such low abundance ratios between two isomers separated by more than 3000 K in energy suggest that they are formed from a common ion precursor, probably HSCNH+ (Halfen et al., 2009; Adande et al., 2010).
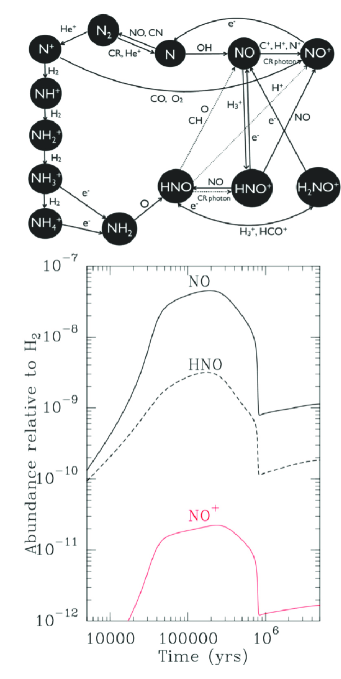
The formation and destruction mechanisms of NO+ in low and high-density interstellar clouds have been discussed by Herbst & Klemperer (1973),Pickles & Williams (1977), and by Singh & Maciel (1980). Briefly summarized (see Fig. 3), possible pathways in cold dense interstellar clouds include charge transfer reactions between NO and various ions (C+, H+, CH, …), exothermic ion molecule reactions between N+ and oxygen containing species such as CO, O2, NO, …, and the reaction of HNO with H+, He+. Since NO+ does not react with H2 (Huntress, 1977), the dominating (almost unique) mechanism responsible for its destruction is the dissociative recombination reaction which produces back oxygen and nitrogen atoms. The reaction NO+ + e- N + O has been well studied both in laboratory and through theoretical ab-initio studies with a very satisfactory agreement (Schneider et al., 2000; Sheehan & St.-Maurice, 2004).
We have considered a time dependent gas phase model including an updated nitrogen chemistry, following the recent experimental studies of Daranlot et al. (2012, 2013) reported in Wakelam et al. (2013). The chemical network contains 117 chemical species and 1117 chemical reactions. Figure 3 displays the time evolution of NO+, NO, and HNO for typical dark cloud conditions (n(H2) = 105 cm-3, T = 10 K). The fractional elemental abundances adopted are 0.1, 710-6, 210-5, 10-5, and 1.510-8 for He, C, O, N, and M (metals), respectively, which have been used in previous chemical studies for deuterated molecules in the B1 cloud (Marcelino et al., 2005; Lis et al., 2010; Cernicharo et al., 2013). The abundance of NO+ is almost linearly dependent on the cosmic ionization rate. The elemental abundance of sulfur has been somewhat varied to better match the observations. We show in Figure 3 the results obtained with an elemental abundance of sulfur of 10-5, as the sulfur molecules have been found relatively abundant in B1 (Marcelino et al., 2007), and a cosmic ionization rate of 210-17 s-1 per H2 molecule.
The predicted abundance for NO+ at t=2105 yr is consistent with observations, (NO+)= 2.210-11 versus the observed value of 210-11. For the same time our gas phase model predicts (NO)= 4.610-8, and (NO)/(NO+)2100. These values are 4 times larger than the observed ones. Moreover, our model also fails to reproduce the observed HNO abundance, which is similar to that of NO+, by a factor 1-2 102. Neutral-neutral reactions play a significant role in the nitrogen chemistry as first emphasized by Pineau des Forets et al. (1990). The NO radical is principally formed through N + OH, and HNO results from the O + NH2 reaction. The corresponding rates, recently updated by Wakelam et al. (2013), have been introduced in the model. We did not include two nitrogen containing compounds such as N2O, and HN2O+ which could be formed from NO and HNO. Including the corresponding additional reactions is desirable but unfortunately, very little information is available for these species, either experimentally or theoretically. The detection of NO+ and the comparison of its abundance with related species, such as NO and HNO, provides important constraints on the gas phase chemical models. More developed and thorough models, including chemical processes on the surfaces of grains, and additional gas phase reactions of NO and HNO with other neutral species, are certainly needed to better understand the chemistry of N- and O-bearing molecules.
References
- Adande et al. (2010) Adande, G.R., Halfen, D.T., Ziurys, L.M., et al., 2010, ApJ, 725, 561
- Alberti & Douglas (1975) Alberti, F., & Douglas, A. E., 1975, Can. J. Phys. 53, 1179
- Bachiller & Cernicharo (1984) Bachiller, R., Cernicharo, J., 1984, A&A, 140, 414
- Bachiller et al. (1990) Bachiller, R., Menten, K.M., del Rio Alvarez, S., 1990,A&A, 236, 461
- Billingsley (1973) Billingsley, F.P., 1973, Chem. Phys. Lett., 23, 160
- Bowman et al. (1982) Bowman, W. C., Herbst, E., & De Lucia, F. C., 1982, J. Chem. Phys., 77, 4261
- Cernicharo (1985) Cernicharo, J., 1985, Internal IRAM report (Granada: IRAM)
- Cernicharo et al. (2012) Cernicharo, J., Marcelino, N., Roueff, E., et al., 2012, ApJ, 759, L43
- Cernicharo (2012) Cernicharo, J., 2012b, in ECLA-2011: Proc. of the European Conference on Laboratory Astrophysics, EAS Publications Series, 2012, Editors: C. Stehl, C. Joblin, & L. d’Hendecourt (Cambridge: Cambridge Univ. Press), 251
- Cernicharo et al. (2013) Cernicharo, J., Tercero, B., Fuente, A., et al., 2013, ApJ, 771, L10
- Chambaud & Rosmus (1990) Chambaud, G., & Rosmus, P., 1990, Chem. Phys. Lett., 165, 429
- Daniel et al. (2006) Daniel, F., Cernicharo, J., & Dubernet, M.L., 2006, ApJ, 648, 461
- Daniel et al. (2007) Daniel, F., Cernicharo, J., Roueff, E., et al., 2007, ApJ, 667, 980
- Daniel & Cernicharo (2008) Daniel, F., & Cernicharo, J., 2008, A&A, 488, 1237
- Daniel et al. (2013) Daniel, F., Gerin, M., Roueff, E., et al., 2013, A&A, 560, A3
- Daranlot et al. (2012) Daranlot, J., Hincelin, U., Bergeat, A., et al., 2012, PNAS, 109, 10233
- Daranlot et al. (2013) Daranlot, J., Hu, X., Xie, C., et al., 2013, PCCP, 15, 13888
- Frerking et al. (1979) Frerking, M.A., Linke, R.A., & Thaddeus, P., 1979, ApJ, 234, L143
- Fuente et al. (1993) Fuente, A., Martin-Pintado, J., Cernicharo, J., & Bachiller, R., 1993, A&A, 276, 473
- Gerin et al. (1992) Gerin,M., Viala, Y., Pauzat, F., & Ellinger, Y., 1992, A&A, 266, 463
- Green et al. (1974) Green, S., Montgomery, J.A. Jr., & Thaddeus, P., 1974, ApJ, 193, L89
- Halfen et al. (2001) Halfen, D. T., Apponi, A. J., & Ziurys, L. M., 2001, ApJ, 561, 244
- Halfen et al. (2009) Halfen, D. T., Ziurys, L.M., Brunken, S., et al., 2009, ApJ, 702, L124
- Hatchell et al. (2005) Hatchell, J., Richer, J.S., Fuller, G.A., et al., 2005, A&A, 440, 151
- Herbst & Klemperer (1973) Herbst, E., & Klemperer, W., 1973, ApJ, 185, 505
- Hilpert et al. (1994) Hilpert, G., Linnartz, H., Havenith, M., ter Meulen, J. J., & Meerts, W. L., 1994, Chem. Phys. Lett., 219, 384
- Ho et al. (1991) Ho, W. C., Ozier, I., Cramb, D. T., & Gerry M. C. L., 1991, J. Mol. Spectrosc., 149, 559
- Huang & Hirano (2013) Huang, Y.-H., Hirano, N., 2013, ApJ, 766, 131
- Huntress (1977) Huntress, W. T., 1977, ApJ. Suppl. 33, 495
- Javahery et al. (1990) Javahery, G., Glosik, J., Twiddy, N. D., & Ferguson, E. E., 1990, Int. J. Mass Spectrom. Ion Processes, 98, 225
- Jørgensen et al. (2006) Jørgensen, J. K., Harvey, P. M., Evans, N. J., II, et al., 2006, ApJ, 645, 1246
- Jungen & Lefebvre-Brion (1970) Jungen, Ch., Lefebvre-Brion, H., 1970, J. Mol. Spectrosc., 33, 520
- Lis et al. (2002) Lis, D.C., Roueff, E., Gerin, M., et al., 2002, ApJ, 571, L55
- Lis et al. (2010) Lis, D.C., Wootten, A., Gerin, M., & Roueff, E., 2010, ApJ, 710, L49
- Liszt & Turner (1978) Liszt, H.S., Turner, B.E., 1978, ApJ, 224, L73
- López-Puertas et al. (2006) López-Puertas, M., Flaud, J.-M., Peralta-Calvillo, J., Funke, B., & Gil-López, S., 2006, J. Mol. Spectrosc., 237, 218
- Marcelino et al. (2005) Marcelino, N., Cernicharo, J., Roueff, E., et al., 2005, ApJ, 620, 308
- Marcelino (2007) Marcelino, N., 2007, PhD Thesis, Univ. Granada, Spain.
- Marcelino et al. (2007) Marcelino, N., Cernicharo, J., Agúndez, M., et al., 2007, ApJ, 665, L127
- Marcelino et al. (2009) Marcelino, N., Cernicharo, J., Tercero B., Roueff, E., 2009, ApJ, 690, L27
- Müller et al. (2005) Müller, H. S. P., Schlöder, F., Stutzki, J., & Winnewisser, G., 2005, J. Mol. Struct. 742, 215
- Öberg et al. (2010) Öberg, K. I., Bottinelli, S., Jørgensen, J. K., van Dishoeck, E. F., 2010, ApJ, 716, 825
- Ozeki et al. (2011) Ozeki, H., Wlodarczak, G., & Bailleux, S., 2011, A&A, 527, A64
- Pardo et al. (2001) Pardo, J. R., Cernicharo, J., Serabyn, E. 2001, IEEE Trans. Antennas and Propagation, 49, 12
- Pezzuto et al. (2012) Pezzuto, S., Elia, D., Schisano, E., et al., 2012,A&A, 547, A54
- Pickles & Williams (1977) Pickles, J. B., & Williams, D. A., 1977, Astrophys. Space Sci., 52, 453
- Pickett (1991) Pickett, H. M., 1991, J. Mol. Spectrosc., 148, 371
- Pickett et al. (1998) Pickett, H. M., Poynter, R. L., Cohen, E. A., et al., 1998 J. Quant. Spectrosc. & Rad. Transfer 60, 883
- Pineau des Forets et al. (1990) Pineau des Forets, G., Roueff, E., & Flower, D.R., 1990, MNRAS, 244, 688
- Polák & Fišer (2004) Polák, R., & Fišer, J., 2004, Chem. Phys., 303, 73
- Schneider et al. (2000) Schneider, I.F., Rabadán, I., Carata, L., et al., 2000, J. of Physics B Atomic Molecular Physics, 33, 4849
- Sheehan & St.-Maurice (2004) Sheehan, C.H., & St.-Maurice, J.P., 2004, J. Geophys. Research, 109, A03302
- Singh & Maciel (1980) Singh, P. D., & Maciel, W. J., 1980, Astrophys. Space Sci., 68, 87
- Turner (1974) Turner, B.E., 1974, ApJ, 193, L83
- Wakelam et al. (2012) Wakelam, V., Herbst, E., Loison, J., et al., 2012, ApJS, 199, 21
- Wakelam et al. (2013) Wakelam, V., Smith, I.W.M., Loison, J.-C., et al., 2013, ArXiv preprint, 1310.4350