Make Super-Earths, Not Jupiters:
Accreting Nebular Gas onto Solid Cores at 0.1 AU and Beyond
Abstract
Close-in super-Earths having radii 1–4 may possess hydrogen atmospheres comprising a few percent by mass of their rocky cores. We determine the conditions under which such atmospheres can be accreted by cores from their parent circumstellar disks. Accretion from the nebula is problematic because it is too efficient: we find that 10 cores embedded in solar metallicity disks tend to undergo runaway gas accretion and explode into Jupiters, irrespective of orbital location. The threat of runaway is especially dire at 0.1 AU, where solids may coagulate on timescales orders of magnitude shorter than gas clearing times; thus nascent atmospheres on close-in orbits are unlikely to be supported against collapse by planetesimal accretion. The time to runaway accretion is well approximated by the cooling time of the atmosphere’s innermost convective zone, whose extent is controlled by where H2 dissociates. Insofar as the temperatures characterizing H2 dissociation are universal, timescales for core instability tend not to vary with orbital distance — and to be alarmingly short for 10 cores. Nevertheless, in the thicket of parameter space, we identify two scenarios, not mutually exclusive, that can reproduce the preponderance of percent-by-mass atmospheres for super-Earths at 0.1 AU, while still ensuring the formation of Jupiters at AU. Scenario (a): planets form in disks with dust-to-gas ratios that range from 20 solar at 0.1 AU to 2 solar at 5 AU. Scenario (b): the final assembly of super-Earth cores from mergers of proto-cores — a process that completes quickly at 0.1 AU once begun — is delayed by gas dynamical friction until just before disk gas dissipates completely. Both scenarios predict that the occurrence rate for super-Earths vs. orbital distance, and the corresponding rate for Jupiters, should trend in opposite directions, as the former population is transformed into the latter: as gas giants become more frequent from 1 to 10 AU, super-Earths should become more rare.
1. INTRODUCTION
Core-nucleated instability is a widely-believed mechanism by which gas giant planets form (see Wuchterl et al. 2000 and Lissauer & Stevenson 2007 for reviews). The theory states that a solid core of rock and metal, when embedded in a gas-rich nebula, undergoes “runaway gas accretion” to become a gas giant like Jupiter, if the core mass is sufficiently large (Perri & Cameron, 1974; Harris, 1978; Mizuno et al., 1978; Mizuno, 1980; Stevenson, 1982). In static models in which the planet’s nascent gas envelope is powered by steady accretion of rocky planetesimals (e.g., Mizuno, 1980; Stevenson, 1982; Rafikov, 2006, 2011), runaway accretion occurs at a “critical core mass” above which the envelope fails to maintain hydrostatic equilibrium. Identifying the critical core mass with hydrostatic disequilibrium is specific to static models. In time-dependent models (e.g., Pollack et al., 1996), runaway accretion is characterized by envelope masses that grow superlinearly with time. Physically, runaway is triggered once the self-gravity of the atmosphere becomes significant, i.e., when the envelope has about as much mass as the core. The critical core mass in time-dependent models is that for which runaway accretion occurs just within the gas disk lifetime; it is less related to hydrostatic disequilibrium than to increasing thermal disequilibrium: runaway accretion occurs because of runaway cooling.
Critical core masses are typically quoted to be (e.g., Mizuno, 1980; Stevenson, 1982; Pollack et al., 1996; Ikoma et al., 2000). As long as the planet’s envelope is connected to the nebula by a radiative outer layer, the critical core mass does not depend much on nebular conditions (Mizuno, 1980; Stevenson, 1982). The radiative zone’s steep rise in density and pressure tends to decouple the planet’s interior from the external environment. Thus the theoretical prejudice is that - cores nucleate gas giants whether they are located at 0.1 AU or 5 AU. Stevenson (1982) justifies analytically how is a characteristic critical core mass, under the assumption that most of the envelope mass is radiative and has constant opacity.111 If the envelope is more nearly adiabatic, the critical core mass depends more sensitively on nebular boundary conditions (e.g., Wuchterl 1993 and Ikoma et al. 2000). We will find that the envelopes of Kepler super-Earths have substantial outer radiative zones.
The discovery of Kepler super-Earths presents a seeming crisis for the core instability theory. About 1 in 5 Sun-like stars harbor planets having radii of 1–4 at distances of 0.05–0.3 AU (Howard et al., 2010; Batalha et al., 2013; Petigura et al., 2013; Dong & Zhu, 2013; Fressin et al., 2013; Rowe et al., 2014). Transit-timing analyses (Wu & Lithwick, 2013) and radial-velocity measurements (Weiss & Marcy, 2014) establish these super-Earths to have masses of 2–20 — these are in the range of critical core masses cited for runaway gas accretion. Yet such super-Earths apparently retain only small amounts of gas: only 3–10% by mass (e.g., Lopez & Fortney, 2014) or even less (e.g., Rogers & Seager, 2010a, b), based on modeling of observed radius-mass data. The prevalence of super-Earths is consonant with the rarity of Jupiters at these distances (e.g., Jones et al., 2003; Udry et al., 2003; Wright et al., 2012; Fressin et al., 2013; Dawson & Murray-Clay, 2013).
How did super-Earths having masses of 10 avoid becoming gas giants? How did they acquire the modest gas envelopes that they are inferred to have? We begin by offering some general perspectives on in-situ formation at small orbital distances that will dictate our approach to answering these questions.222 One may question our assumption of in-situ formation and our suppression of migration. Types I and II migration are infamously rapid, especially at the small stellocentric distances where super-Earths currently reside. Nevertheless, co-rotation torques render both the timescale and even direction of migration uncertain (see Kley & Nelson 2012 for a review). Whereas what halts migration remains unclear, simulations of in-situ formation can reproduce the observed distributions of orbital periods, planetary sizes, and mutual inclinations, using only a modicum of input parameters (Hansen & Murray, 2013). And whether or not super-Earth cores migrated inward, it remains to be explained how they acquired their atmospheres and avoided runaway: this is the problem we address in this paper, and elements of our solution should be independent of the manner by which cores are emplaced. As we show below, the problem of avoiding runaway gas accretion is especially severe for close-in super-Earth cores because they are not expected to have significant sources of power that can keep their atmospheres in strict equilibrium. Because their atmospheres are free to cool and contract, they are at great risk of accreting large amounts of gas from the nebula and exploding into Jupiters.
1.1. For Super-Earths, Accretion of Solids Completes Before Accretion of Gas
Many of the core instability studies cited above assume that solid cores accrete rocks and gas simultaneously. Gravitational energy released from solids raining down upon the core heats the envelope and acts as a battery: the luminosity derived from planetesimal accretion is analogous to nuclear power in stars. In static models, is a prescribed constant in time. For example, Rafikov (2006), using prescriptions for that depend on orbital distance, finds that critical core masses range from 0.1–100 over 0.05–100 AU.333 Rafikov (2006, their Figure 7) reports at 0.1 AU — which taken at face value violates the observation that super-Earths having just these masses, and not Jupiters, prevail at such distances. But this estimate of assumes that the planet’s envelope is bounded by the Bondi radius rather than the Hill radius . At orbital distances AU, the opposite is likely to be true (see, e.g., our §2.1.1). For the strictly adiabatic envelopes assumed by Rafikov (2006) at 0.1 AU, replacing his with the smaller implies that 7- cores have only small gas-to-core ratios and would not run away. More problematic is his assumption of strict adiabaticity which follows from an unsustainably large planetesimal accretion rate. In time-dependent models, is a prescribed function of time that enables one to follow the envelope’s quasi-static contraction and mass gain from the nebula (Pollack et al., 1996; Bodenheimer et al., 2000; Movshovitz et al., 2010; Rogers et al., 2011).
At 5 AU and beyond, the usual practice of accounting for is sensible. Coagulation of solids can play out any number of ways, especially at large orbital distances where to form planets within a Hubble time, accretion of planetesimals is necessarily gravitationally focussed. These gravitational focussing factors (a.k.a. Safronov numbers) are uncertain, depending sensitively on the size distribution of planetesimals and the means by which velocity dispersions are damped (see Goldreich et al. 2004 for a pedagogic review). Among the myriad planetesimal accretion histories that are imaginable outside a few AU, many have durations at least as long, if not longer, than gas disk lifetimes of several Myrs, validating the conventional -powered models for core instability.
But closer to the star, the universe of possibilities narrows considerably, assuming that planets form in-situ (Hansen & Murray, 2012, 2013; Chiang & Laughlin, 2013). Even without gravitational focussing, the time to coagulate a solid core of mass and radius in-situ at 0.1 AU is astonishingly short:
| (1) |
where and are the planetesimals’ volume density and surface density, respectively; is their scale height; is their velocity dispersion, assumed isotropic; and is the local orbital frequency. If we assume that the disk has the “minimum mass” needed to spawn a core from an annulus of radius and width — so that — then we arrive at a simple expression for the coagulation time:
| (2) |
This is 2–3 orders of magnitude shorter than gas disk dissipation timescales of –10 Myr (Mamajek, 2009; Alexander et al., 2014). The lesson here is that close-in orbits have compact areas (i.e., high surface densities) and short dynamical times (i.e., the local clock runs dizzyingly fast), effecting rapid coagulation. And equation (2) represents an upper limit — both because we have neglected gravitational focussing, and because we have assumed a minimum disk surface density.
The coagulation time characterizes the last doubling of mass of the core, irrespective of whether that doubling is achieved by accreting small planetesimals (“minor mergers”) or by giant impacts between oligarchs (“major mergers”). Whatever dregs of planetesimals remain from the last doubling are consumed over timescales comparable to . Because , the standard picture of having planetesimals accrete contemporaneously with disk gas is not appropriate for close-in super-Earths. Solids finish accreting well before gas finishes accreting — indeed even before gas starts to accrete in earnest.
One consequence of is that gas envelopes can freely cool, contract, and accrete more gas: they are especially vulnerable to runaway gas accretion. This feature of in-situ formation only heightens the mystery of why the Kepler spacecraft and ground-based radial velocity surveys find an abundance of super-Earths but not Jupiters at 0.1 AU.
1.2. Mission and Plan for this Paper
We seek here to unravel this mystery — to understand how super-Earths avoid runaway gas accretion, and just as importantly, to see if we can reproduce their observationally inferred gas fractions. Motivated by the considerations in §1.1, we will set the planetesimal accretion rate to zero when we construct models for how close-in super-Earth cores accrete gas from their natal disks. Similar passively cooling atmospheres have been computed at orbital distances of 5 AU (e.g., Ikoma et al., 2000; Papaloizou & Nelson, 2005) and beyond (Piso & Youdin, 2014). In these models, cooling regulates the accretion of gas. As the envelope radiates away its energy, it undergoes Kelvin-Helmholtz contraction and accretes more gas from the surrounding nebula. Both Ikoma et al. (2000) and Papaloizou & Nelson (2005) conclude that Jupiter could have formed in-situ as long as . Distant extrasolar gas giants like those orbiting HR 8799 (Marois et al. 2008; Marois et al. 2010), located as far as 30–70 AU from their host star, might also have formed via core instability, starting from core masses as small as (Piso & Youdin 2014; but see Kratter et al. 2010 and references therein for alternative formation channels involving gravitational instability or outward migration of solid cores).
Our focus here is on the acquisition of gas envelopes at 0.1 AU. Pioneering studies at these close-in distances by Ikoma & Hori (2012) and Bodenheimer & Lissauer (2014) concentrate on the case of the multi-planet system orbiting Kepler-11 (Lissauer et al., 2011, 2013). From Figure 2 of Ikoma & Hori (2012), gas accretion onto cores is slowed within hotter and dustier disks, but gas disk lifetimes of –10 Myr (Mamajek, 2009; Alexander et al., 2014) are long enough that 10 cores are still expected to run away. We will confirm these results and chart new regions of parameter space (exploring, e.g., supersolar metallicities) to find accretion histories that do succeed in circumventing runaway for 10 cores. Although Ikoma & Hori (2012) set the planetesimal accretion luminosity (as we have explained is realistic), their models still feature a large internal luminosity: one that emanates from the rocky core with its finite heat capacity. In §3.1.2, we show by contrast that this power input is actually negligible. Bodenheimer & Lissauer (2014) focus on Kepler-11f, and find that a solid core of mass at 0.5 AU can safely avoid runaway, accreting an atmosphere for which , so long as the disk disperses in 2 Myr. By comparison, our study is more general and will encompass the super-Earth population as a whole, located between 0.05–0.5 AU. Most of their measured masses range from 5–10 (Wu & Lithwick, 2013; Weiss & Marcy, 2014)
Because our model gas envelopes are not heated, they are especially susceptible to runaway; i.e., our calculated runaway times are strict lower bounds. Thus when we identify those conditions for which —thereby making the universe safe for super-Earths—such solutions should be robust. We describe the construction of our model atmospheres in §2. Results for and its variation with nebular conditions and core masses are presented in §3. Readers interested only in our solution to how super-Earths remain super-Earths may skip directly to §4. There we propose two possible scenarios by which close-in planets avoid runaway — and also calculate their expected final gas contents. A summary is given in §5.
2. TIME-DEPENDENT MODEL ATMOSPHERES
We model how a rocky core embedded in a gaseous circumstellar disk accretes an atmosphere. The gas envelope is assumed spherically symmetric: we solve for how density and temperature vary with radius and time, subject to outer boundary conditions set by the disk.
Our procedure follows that of Piso & Youdin (2014, PY), with a few exceptions detailed below, such as allowing for gradients in composition and more complex opacities. The basic idea is that as the envelope cools, it contracts and accretes more gas from the disk. But on timescales shorter than the accretion (i.e., cooling or Kelvin-Helmholtz) time, the atmosphere is practically hydrostatic. Thus we begin by constructing a series of “hydrostatic snapshots” (§2.1): 1D atmospheric models in strict hydrostatic equilibrium, each having a unique gas-to-core mass ratio GCR . We then string these snapshots together in time (in order of increasing GCR) by calculating the rate at which the planet cools from one snapshot to the next (§2.2).
2.1. Hydrostatic Snapshots
Each hydrostatic snapshot is constructed by solving the standard equations of stellar structure:
| (3) |
| (4) |
| (5) |
where is radius, is density, is pressure, is the gravitational constant, is the mass enclosed within , and is temperature. The dimensionless temperature gradient equals either
| (6) |
where energy transport is by radiative diffusion, or
| (7) |
where transport is by convection. Here is luminosity, is the specific entropy (§2.1.2), is opacity (§2.1.3), and is the Stefan-Boltzmann constant. Convection prevails according to the Ledoux criterion:
| (8) |
where is the mean molecular weight and accounts for compositional gradients. Assuming the heavy elements are homogeneously distributed, we find that is negative and so acts to drive convection; however, the effect is negligible. (In models of Saturn and Jupiter, can be positive because of imperfect mixing of solids, immiscibility of helium, and core erosion; see Leconte & Chabrier 2012, 2013. These effects manifest at pressures and densities that prevail only at the very bottoms of super-Earth atmospheres.)
A major simplification in our procedure is to assume that is spatially constant (e.g., PY). The assumption is valid in radiative zones if their thermal relaxation times are shorter than thermal times in the rest of the atmosphere. Then before the planet can cool as a whole (i.e., before one snapshot transitions to another), its radiative zones relax to a thermal steady state in which energy flows outward at a constant rate. We will check whether this is the case in §3.1. By comparison in convective zones, the assumption of constant is moot, because there the density and temperature structures follow an adiabat, where , independent of .
In computing a snapshot for a desired GCR, the spatially constant is an eigenvalue found by iteration. We guess , integrate (3)–(5) inward from a set of outer boundary conditions until we reach the core radius , and compute the resultant GCR. The integration is performed using Python’s odeint package. If the GCR does not match the one desired, then we repeat the integration with a new . We iterate on until the desired GCR is reached.
As a simplifying measure, we neglect whatever intrinsic luminosity and heat capacity the rocky core may have. The validity of this approximation will be assessed when we present the results for our fiducial model in §3.1.
2.1.1 Boundary conditions
The base of the atmosphere is located at the surface of the solid core, whose bulk density is fixed at g/cm3. For a fiducial core mass of , we have .
The outer radius is set either to the Hill radius
| (9) | |||||
or the Bondi radius
| (10) | |||||
whichever is smaller. Here , , and are the sound speed, temperature, and mean molecular weight of disk gas at stellocentric distance . We fix the host stellar mass to be . The temperature above which is
| (11) |
Our fiducial input parameters K and gas density g/cm3 are drawn from the minimum-mass extrasolar nebula (MMEN) of Chiang & Laughlin (2013):
| (12) |
| (13) |
where the power-law index on temperature is taken from Chiang & Goldreich (1997). Other disk models (e.g., Rafikov 2006; Hansen & Murray 2012) yield similar outer boundary conditions. We will perform a parameter study over , , , and in §3.2. For a given model, nebular parameters are fixed in time; however, this simplification will not prevent us from making rough connections between our models and dissipating (time-variable) disks in §4.
If exceeds the disk scale height , our assumption of spherical symmetry breaks down. For our fiducial parameters at AU, we have which is comparable to . Thus the error we accrue by ignoring the disk’s vertical density gradient seems at most on the order of unity — but this assessment is subject to errors in our prescription itself for , which ignores how the true radius inside of which material is bound to the planet may differ from or . We will explore the sensitivity of our results to in §3.2.5.
2.1.2 Equation of state
We compute our own ideal-gas equation of state (EOS) for a mixture of hydrogen, helium, and metals. For given temperature and pressure , the EOS yields density , adiabatic temperature gradient , and internal energy . The internal energy is used only to connect our hydrostatic snapshots in time (§2.2), and does not enter into the construction of an individual snapshot. Our model has an advantage over the commonly used Saumon et al. (1995) EOS as we account for metals (albeit crudely), but has the disadvantage that we do not consider quantum effects and intermolecular interactions. Fortunately, these omissions are minor for super-Earth atmospheres (§3.1.2). For our fiducial model, values of calculated from our ideal-gas EOS agree with those of Saumon et al. (1995) to within , with similar levels of agreement for and except in a few locations where discrepancies approach factors of 2. We have checked that mechanical and thermal stability are satisfied over the parameter space relevant to our study.
The density of our mixture is given by
| (14) |
where is the Boltzmann constant and is the mass of the hydrogen atom. For (our fiducial) solar composition, we use the mass fractions , , . We also explore subsolar (, , ) and supersolar (, , ) compositions. Both helium and metals are assumed to remain atomic throughout the atmosphere;444 In reality, metals can take the form of molecules. At the temperatures K characterizing close-in super-Earths, CO is the dominant molecule (Hori & Ikoma, 2011). We have verified by direct calculation that for , our results hardly change whether all of the cosmic abundance of C is atomic or whether it is locked up in CO. Dissociation of CO occurs only at the very bottom of our atmospheres (at the core-envelope boundary), and for there is not enough CO to significantly alter . At lower temperatures –1000 K and , molecular metals have greater impact: the increased molecular weight and the presence of H2O—with its many degrees of freedom and its potential for reacting chemically—render envelopes more susceptible to runaway (Hori & Ikoma, 2011). accordingly, we fix and (representing an average over the relative metal abundances tabulated by Grevesse & Noels 1993). We have checked a posteriori that our neglect of helium ionization is safe because its effects are felt only at the very bottom of our atmosphere, near the core surface. For hydrogen, we distinguish between its ionized, atomic, and molecular forms:
| (15) |
where we have adopted the convention that the mass fractions .
We compute the mass fractions via the corresponding number fractions. In thermodynamic equilibrium, the atomic number fraction is given through Saha-like considerations by
| (16) |
where is the binding energy of , and are the translational partition functions for atomic and molecular hydrogen, respectively, and and are internal partition functions defined below. Only in equation (16) do we approximate the total number density ; for purposes of evaluating , we assume that is small and neglect other trace elements. However, is not necessarily negligible, and derives from the Saha equation:
| (17) |
where and are the translational partition functions for free protons and electrons, respectively. The factor of 4 accounts for electron and proton spin degeneracies.
Only electronic states contribute to the internal partition function for atomic hydrogen:
| (18) |
We choose the maximum quantum number such that the effective radius of the outermost electron shell equals half the local mean particle spacing , where is the Bohr radius. The internal partition function for molecular hydrogen is
| (19) |
where
| (20) |
| (21) |
and
| (22) |
with and , and where the prefactors 1 and 3 in equation (22) denote the nuclear spin degeneracies. Note that we do not assume a fixed ortho-to-para ratio for molecular hydrogen, but let the ratio vary with temperature in thermal equilibrium.
To compute (equation 7), we tabulate the specific entropy on a logarithmically evenly spaced grid of temperature and pressure with and . To calculate derivatives, we take local cubic splines of on small square patches that are 7 grid spacings on each side. The entropy per mass is evaluated as
| (23) |
where is the entropy of mixing (e.g., Saumon et al. 1995):
| (24) |
with
| (25) |
The index iterates over free electrons, free protons, atomic hydrogen, molecular hydrogen, helium, and metals. For species , the particle mass is and the mass fraction is (i.e., ; note that , , and ). The entropy of an individual species is calculated from its Helmholtz free energy . For example, for atomic hydrogen,
| (26) |
where
| (27) |
For molecular hydrogen, we account for electronic, vibrational, and rotational partition functions; for protons and electrons, we account for their spin degeneracies and their translational partition functions; and for helium and metals, we account only for their translational partition functions.
Finally, the total internal energy where the internal energy of each species can be derived from and : e.g., . Note that the total free energy from all hydrogenic species is not merely the sum of the individual free energies , because does not add linearly.
2.1.3 Opacity
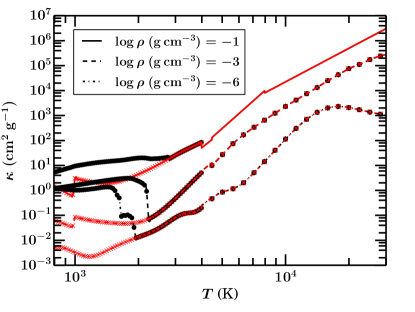
Piso & Youdin (2014) have stressed the importance of opacity in regulating the accretion (read: cooling) history of gas giant cores, and our work will prove no exception. For close-in super-Earth atmospheres, we need opacities over the following ranges of densities and temperatures: and . To this end, we utilize the opacity tables of Ferguson et al. (2005), which partially span our desired ranges, and interpolate/extrapolate where necessary.
| Dust | ||||||||||
|---|---|---|---|---|---|---|---|---|---|---|
| 0.02 | yes | -22 | 0.46 | 6.7 | -25 | 0.53 | 7.5 | -13 | 0.46 | 4.5 |
| no | -25 | 0.50 | 7.5 | -25 | 0.53 | 7.5 | -13 | 0.46 | 4.5 | |
| 0.002 | yes | -27 | 0.49 | 7.8 | -28 | 0.60 | 8.2 | -14 | 0.48 | 4.8 |
| no | -28 | 0.55 | 8.1 | -28 | 0.60 | 8.2 | -14 | 0.48 | 4.8 | |
| 0.2 | yes | -23 | 0.48 | 7.1 | -18 | 0.48 | 5.9 | -6.1 | 0.40 | 2.8 |
| no | -22 | 0.48 | 7.0 | -19 | 0.35 | 6.0 | -6.1 | 0.40 | 2.8 |
We experiment with a total of 6 opacity laws: 3 metallicities (solar , subsolar , and supersolar ,555The abundances used for our supersolar opacity model are slightly discrepant from those of our EOS model (§2.1.2); the former uses , whereas the latter uses . The opacity and EOS models also differ generically in that the opacity model (drawn directly from Ferguson et al. 2005) uses its own equation of state based on the PHOENIX stellar atmospheres code, which includes molecular metals. These differences are not significant; we have verified that changing the hydrogen/helium abundances in our supersolar EOS by several percent to reconcile them with our supersolar opacity model changes our computed times to runaway gas accretion by ; see also footnote 4. where elemental abundances are scaled to those in Grevesse & Noels 1993) 2 dust models (“dusty” which assumes the ISM-like grain size distribution of Ferguson et al. 2005; and “dust-free” in which metals never take the form of dust and are instead in the gas phase at their full assumed abundances). Where the Ferguson et al. (2005) tables are incomplete, we interpolate or extrapolate using power laws. Our look-up table is constructed as follows (with in K and in g/cm3):
-
1.
and : tabulated in Ferguson et al. (2005), with supplemental data calculated by J. Ferguson (2013, personal communication)
-
2.
: (interpolation)
-
3.
and : tabulated in Ferguson et al. (2005), with supplemental data calculated by J. Ferguson (2013, personal communication)
-
4.
and : (constant extrapolation)
-
5.
and : (extrapolation)
-
6.
and : (extrapolation)
where for supersolar metallicity, 3.7 for all dust-free models, and 3.65 otherwise; and for supersolar metallicity and 3.9 otherwise. Table 1 lists our fit parameters. We have verified that our use of a constant extrapolation at low and low (item 4 above) is acceptable. For , we expect the opacity to be dominated by dust and independent of , assuming a constant dust-to-gas ratio. We have confirmed that indeed hardly varies with at these low temperatures (J. Ferguson 2014, personal communication). We have also checked that our results are insensitive to different extrapolated temperature scalings for (as steep as ).
Figure 1 illustrates how our solar metallicity + dusty (and dust-free) varies with for representative values of . Dust, when present, dominates at K. For , dust sublimates, one grain species at a time according to its condensation temperature, leaving behind gas molecules as the primary source of opacity. Molecular opacity sets a floor on of cm2/g, two orders of magnitude below the maximum dust opacity. We emphasize that our opacity model keeps track of how the gas phase abundances of the refractory elements vary with temperature according to the sublimation fronts of various grain species.
For , H- ions provide most of the opacity (with contributions from H2-H2 and H2-He collision-induced absorption; cf. Guillot et al. 1994). The H- opacity rises steeply with , reflecting the growing abundance of H- with increasing atomic fraction and increasing numbers of free electrons from thermally ionized species.
2.2. Connecting Snapshots in Time
When the gas envelope lacks an internal power source (from, e.g., fusion or planetesimal accretion), the time between two successive hydrostatic snapshots is simply the time it takes to cool from one to the other, in order of increasing GCR. This cooling time is modified slightly by changes to the energy budget from gas accretion and envelope contraction. From PY (see their Appendix A for a derivation), we have
| (28) |
where denotes the average of quantity in two adjacent snapshots, and denotes the difference between snapshots. The luminosity is the eigenvalue satisfying the equations of stellar structure, found by iteration as described in §2.1. From left to right, the terms in the numerator of (28) account for (a) the change in total (gravitational plus internal) energy
| (29) |
integrated over the innermost convective zone (; note that takes the core mass into account); (b) the energy accrued by accreting gas () with specific energy
| (30) |
where is the radius of the innermost radiative-convective boundary (RCB); and finally, (c) the work done on the planet by the contracting envelope, with equal to the change in the volume enclosing the average of the innermost convective masses of the two snapshots, and equal to the averaged pressure at the surface of this volume. We emphasize that we evaluate all three terms at the boundary of the innermost convective zone, as this seems the most natural choice given our assumption that all the luminosity is generated inside (Piso & Youdin, 2014).
Because the procedure above only yields changes in time between snapshots, we still need to specify a time for the first snapshot. In practice, the first snapshot is that for which the atmosphere is nearly completely convective, since cannot be found for fully convective atmospheres.666In reality, a thin radiative layer should always cap the planet’s atmosphere and regulate the loss of energy from the planet to the disk. Resolving this outer boundary layer—which may also advect energy to the disk—is a forefront problem. Its solution would enable us to probe still earlier times and smaller GCRs than we can reach in this paper. For this first snapshot we assign . Whatever formal error is accrued in making this assignment is small insofar as is much less than the times to which we ultimately integrate (e.g., the time of runaway gas accretion).
3. RESULTS
The time evolution of our fiducial model of a growing super-Earth atmosphere is described in §3.1, together with an explanation of our findings to order-of-magnitude accuracy (§3.1.1) and a review of the a posteriori checks we performed (§3.1.2). How runaway gas accretion is promoted or inhibited by varying nebular conditions and core masses is surveyed in §3.2.
3.1. Fiducial Model
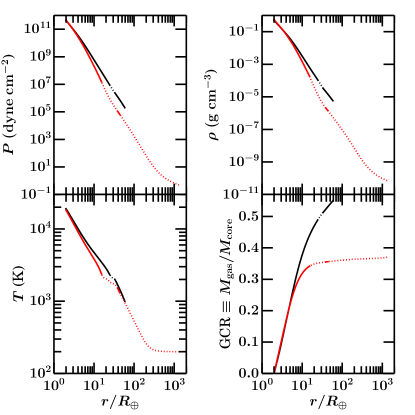
Our fiducial model is a 5, 1.6 solid core located at AU in the minimum-mass extrasolar nebula (MMEN) with and K. We assume the disk to be dusty, with solar metallicity and an ISM-like grain size distribution. In Figure 2, we show how various atmospheric properties vary with depth for different envelope masses. Most of the atmosphere is in the innermost convective zone—at least 75% by mass for GCR 0.2. The outermost layer is always cool enough for dust to survive and dominate the opacity; at small GCRs (early times), this outer dusty layer is convective; at higher GCRs, it becomes marginally radiative (the temperature profile remains nearly adiabatic). Sandwiched between this outermost layer and the innermost convective zone is a radiative layer so hot that dust sublimates and where the opacity is at a global minimum. Temperature profiles in this radiative zone are shallower, and consequently pressure and density profiles are steeper, than in convective zones.
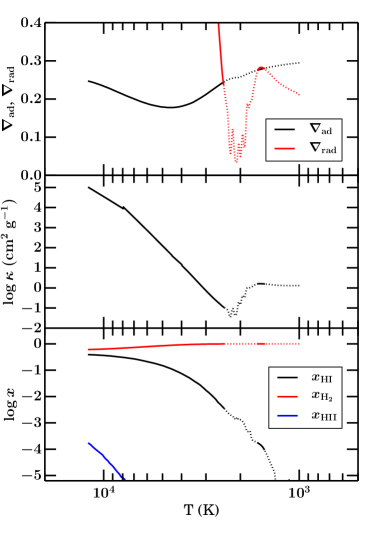
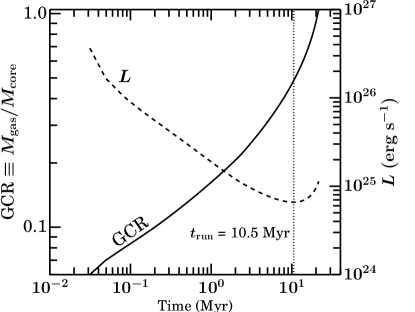
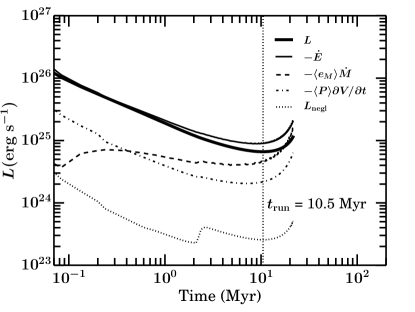
Figure 2 shows that the temperature at the innermost RCB (the RCB from hereon) stays at 2500 K at all times. This is the temperature at which begins to dissociate (equation 16). As Figure 3 explains, the transition from a radiative to a convective zone is caused by the decrease in and the steep increase in , both brought about by dissociation. At the dissociation front, the gas temperature tends to stay fixed as energy is used to break up molecules rather than to increase thermal motions. This near-isothermal behavior drives downward, facilitating the onset of convection. The creation of H atoms also allows the formation of ions, the dominant source of opacity for K. The surge of opacity from , together with the near-constant temperature profile, increases and causes radiation to give way to convection as the dominant transport mechanism.
The evolution of luminosity is displayed in Figure 4. Initially falls. The drop in radiative luminosity occurs as density and pressure—and therefore optical depth—rise at the RCB (compare, e.g., the GCR=0.1 and GCR=0.3 profiles for and in Figure 2). As revealed in Figure 4, when reaches its minimum, the GCR starts to evolve superlinearly; we define the moment of minimum as the runaway accretion time . For our fiducial model, 10.5 Myrs. After , the luminosity grows as the self-gravity of the envelope becomes increasingly important. The rise in , together with the relative constancy of the change in total energy (data not shown; see equations 28–29), causes the planet to cool at an ever faster rate, accelerating the increase in the GCR.
Figure 5 illustrates the relative importance of various terms in the calculation of time steps between snapshots (equation 28). At least until , the evolution is completely controlled by changes in the total energy . The boundary terms and are 10–100 times smaller.
3.1.1 Understanding our results to order-of-magnitude
The runaway timescale can be approximated as the thermal relaxation (a.k.a. cooling) time in the innermost convective zone, evaluated at GCR 0.5, a value large enough for self-gravity to be significant. We define the cooling time of any zone as its total energy content divided by the luminosity:
| (31) |
Figure 6 uses our numerical model to evaluate for both convective and radiative zones. At the moment of runaway, of the innermost convective zone is 20 Myr, within a factor of 2 of 10.5 Myr.
We can also develop back-of-the-envelope understandings of and . Our envelopes are in approximate virial equilibrium:777In a strict sense, our atmospheres are not isolated objects in virial equilibrium because they overlie rocky cores which supply external gravity fields, and because their outer boundaries have non-zero pressure and accrete mass. These complications generate order-unity corrections to ; at runaway, the atmosphere mass is comparable to the core mass, and from Figure 5 we see that the outer boundary terms are at most competitive with the total energy. the total energy of the atmosphere, of mass and characteristic radius , is on the order of the (absolute value of the) gravitational potential energy:
| (32) |
For , , and , we have erg, which is about 1/5 its actual numerically computed value at runaway. As for , we know from equation (6) that at the RCB,
| (33) |
The RCB is always (for dusty models) located at the dissociation front where , , K, and cm2/g from H- opacity.888The H- opacity can be fitted by where all quantities are evaluated in cgs units. A crude estimate of the density at the RCB is given by , where we again take . Putting it all together for our fiducial model at , the luminosity thus estimated is erg/s, within a factor of 2 of our numerically computed (minimum) value of erg/s at runaway.999The largest uncertainty in our order-of-magnitude calculation is in our estimate of and by extension . Piso & Youdin (2014) present a more careful analytic calculation of at the RCB that assumes the outer layer is isothermal; for our models, it is generally not.
3.1.2 Checks
Our calculation assumes to be spatially constant—specifically we assume that the luminosity of the envelope is generated entirely within the innermost convective zone. To check the validity of this assumption, we perform a couple a posteriori tests. We estimate whether the luminosity generated in radiative zones is small compared to and check that most of the planet’s thermal energy content is in the innermost convective zone. From energy conservation, the luminosity generated in radiative zones that our model neglects is
| (34) |
Here is the difference, taken between snapshots separated by time , of evaluated at the surface enclosing a given mass . The integral spans all radiative zones. As demonstrated in Figure 5, is approximately two orders of magnitude smaller than the total . In addition, from Figure 6 we see that for the innermost convective zone exceeds for any radiative zone or exterior convective zone by at least an order of magnitude. Because is constant in our model, an equivalent statement is that the thermal energy content of the innermost convective zone exceeds that of any other zone.
Our results are robust against other shortcomings of our model: (1) Can a spatially varying deepen the RCB so that the thermal energy content of radiative zones exceeds that of the innermost convective zone? No: in reality, the luminosity has to rise toward the surface; higher steepens the radiative temperature gradient (equation 6), promoting convection in the outer atmosphere and thus lessening the extent of radiative zones. (2) What about quantum mechanical effects not captured by our ideal gas EOS? At high densities (), the mean particle spacing becomes smaller than the Bohr radius, leading to liquefaction and pressure ionization. But we find that these packed conditions occur only for GCR 0.5 (at the moment of runaway) and only within the bottommost 3% of the planet’s atmosphere in radius. (3) Finally, how safe is our neglect of the solid core’s contributions to the energy budget of the atmosphere? The luminosity from radioactive heating for a core is about erg/s (Lopez & Fortney, 2014, their Figure 3), well below the envelope luminosities of erg/s characterizing our fiducial model (Figure 4). Whether the core’s heat capacity is significant can be assessed as follows. Over the course of our atmosphere’s evolution, a total energy erg is released. For the core to matter energetically (either as a source or sink), it would have to change its temperature by K, where is the specific heat of rock. Such temperature changes seem unrealistically extreme, especially over the timescales of interest to us—10 Myr—which may be short in the context of solid core thermodynamics. For comparison, some models of rocky, convecting super-Earth cores are initialized with temperatures of 5000–20000 K and cool in vacuum over timescales ranging from 0.1–10 Gyr (Stamenković et al., 2012). Even if by some catastrophically efficient mechanism the core were to lose its entire thermal energy content over 10 Myr (say because the viscosity is actually much lower than that calculated by Stamenković et al. 2012; see, e.g., Papuc & Davies 2008 and Karato 2011), the resultant core luminosity would add to the envelope contraction luminosity by only a factor of order unity. Ikoma & Hori (2012, see their equation 4) typically invoke a core luminosity of erg/s — comparable to our envelope luminosities — but only by assuming the entire core can respond thermally on timescales of 0.1 Myr (their ). Such a thermal response time is unrealistically short.
3.2. Parameter Study
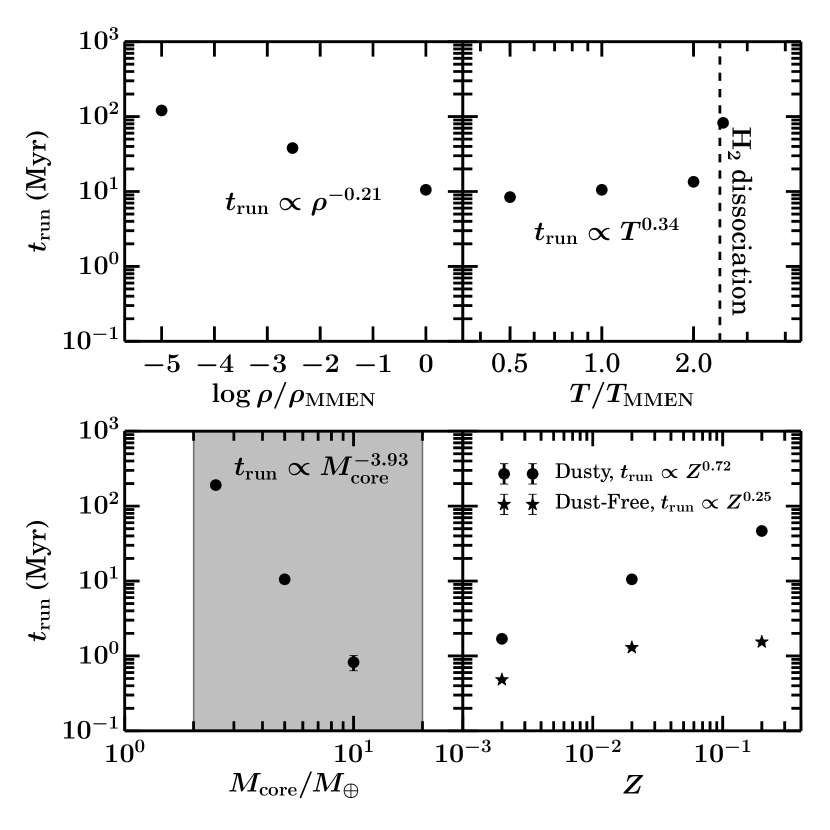
We explore how the runaway time changes with various input parameters. Figure 7 summarizes our results: is most sensitive to core mass and metallicity, and is insensitive, for the most part, to nebular density and temperature.
We can understand all of these dependencies as simple consequences of the properties of the innermost radiative-convective boundary (RCB). As argued in §3.1.1, is approximately the cooling time of the innermost convective zone:
| (35) |
where we have scaled , and and 2500 K because the RCB always (for dusty models) coincides with the H2 dissociation front. Thus the variation of with input parameters can be rationalized in terms of and in equation (35), as we explain qualitatively below.
3.2.1 Disk density
As Figure 7 attests, hardly varies with nebular density . This is because conditions at the RCB are largely insensitive to nebular parameters, insofar as a radiative atmosphere—whose density profile is exponentially steep—lies between the RCB and the nebula. In a sense, nebular conditions are increasingly forgotten as one descends toward the RCB (as found previously by Stevenson 1982). What little memory remains of outer boundary conditions manifests itself as a modest increase in with decreasing . At a fixed GCR of 0.5 (characteristic of runaway), lowering must raise slightly the interior density, including the density at the RCB, and by extension the local opacity (which scales as ). These small increments in and lengthen according to equation (35).
3.2.2 Disk temperature
The runaway time does not vary much with K for largely the same reason that it is not sensitive to : as pressure and density e-fold many times across the quasi-radiative outer envelope, conditions at the RCB decouple from those at the surface. No matter the value of K, the atmosphere near the RCB eventually thermostats itself to the H2 dissociation temperature of 2500 K (cf. Figure 2, bottom left panel), and concomitantly strong density gradients serve to isolate the RCB from the nebula.
Generally, increases with disk temperature. As approaches the dissociation temperature, the outer envelope becomes increasingly isothermal; the density profile steepens and and rise at the RCB. What is impressive is the magnitude of the jump in , and by extension , when reaches the dissociation temperature of 2500 K and the outer atmosphere becomes strictly isothermal. For protoplanetary disks to actually be as hot as K seems unrealistic, since dust sublimation throttles nebular temperatures to stay below 2000 K (see, e.g., D’Alessio et al., 1998, 2001).
3.2.3 Core mass
Atmospheres atop more massive cores require larger pressure gradients to maintain hydrostatic support. Increased pressure steepens radiative gradients (equation 6), fostering convection and pushing the RCB toward the surface (but with fixed at 2500 K). Numerically, we find decreases by a factor of 100 from to 10; i.e., . Since , it follows that , in rough agreement with the scaling shown in Figure 7.
3.2.4 Opacity: Metallicity and grains
More metals increase everywhere, including at the RCB, where the increased optical thickness prolongs by reducing the radiative luminosity. Core-nucleated instability is harder at higher (e.g., Stevenson, 1982; Ikoma et al., 2000; Piso & Youdin, 2014). According to our equation (35), ; Figure 3 of PY vouches for this linear dependence. In turn, scales roughly linearly with metallicity in the opacity model by Ferguson et al. (2005) that we use.
Dusty atmospheres behave differently from dust-free atmospheres. In dusty atmospheres, radiative windows opened by dust evaporation inhibit convection and force the innermost RCB to depths below the dust sublimation front. In dust-free atmospheres, this impediment to convection does not exist and so the RCB is free to be located at higher altitudes where is smaller. As shown in Figure 7, one consequence is that runaway times of dust-free atmospheres are generally shorter than for dusty atmospheres. Another consequence is that depends only weakly on metallicity in dust-free atmospheres. Dust-free envelopes that are more metal-rich have higher opacities which drive the RCB outward. The shortening of from decreasing RCB density counteracts the lengthening of from increasing opacity.
Note that the trends identified above can reverse if the metallicity becomes too high. For , increases in the mean molecular weight become significant, collapsing the atmosphere and shortening (Hori & Ikoma, 2011).
3.2.5 Outer radius
It is customary in this field to choose . But the true outer radius may differ from this choice, if only because there are order-unity coefficients that we have neglected in our evaluation of and . How the protoplanet’s atmosphere interfaces with the disk is not well understood. Lissauer et al. (2009) employ 3D hydrodynamic simulations of planets embedded in viscous disks to argue that should range between and (their equation 3). In 2D hydrodynamic simulations, Ormel & Shi (2014) and Ormel et al. (2014) vouch for the relevance of (when ) to within factors of order unity. Precise correction factors should depend on the thermodynamic properties (read: cooling efficiencies) and turbulent/viscous behavior of disk gas in the vicinity of the planet.
For our fiducial model at 0.1 AU, we find numerically that as varies from to . All other factors being equal, larger (i.e., puffier) atmospheres have lower densities; the lower value of at the RCB shortens according to equation (35). In subsequent sections of this paper, we will quote ranges (“error bars”) for corresponding to –. Because is a hard upper limit on the extent of planetary atmospheres, our results for when (i.e., at orbital distances AU) are hard lower limits.
4. DISCUSSION:
HOW DO SUPER-EARTHS GET THEIR GAS?
Absent heat sources, gaseous envelopes overlying rocky cores cool and contract, accreting more gas from their natal disks. Once these atmospheres become self-gravitating — i.e., once their masses become comparable to those of their cores — they acquire mass at an accelerating, “runaway” rate, ultimately spawning Jovian-class giants in disks with adequate gas reservoirs.
How do super-Earths avoid this fate? Perhaps we should revisit our assumption of zero heating from planetesimal accretion. We showed in §1.1 that in-situ accretion of solids at 0.1 AU finishes well within gas disk lifetimes. Thus our assumption of zero planetesimal accretion seems safe with respect to the reservoir of solids that are local to the inner disk. But what about solids transported to the inner disk from the outer disk, originating from distances AU? Might a steady supply of inwardly drifting planetesimals heat super-Earth atmospheres and prevent them from cooling and collapsing? We can use our results to show that this possibility is unlikely. Our model of a core + solar-metallicity envelope under standard nebular conditions has a minimum, pre-runaway cooling luminosity of erg/s. For planetesimal accretion to support this atmosphere against collapse, the planet would have to accrete solids at a rate . Even if such an accretion rate could be arranged — and it would require some fine-tuning of planetesimal sizes to get the right aerodynamic drift rates and accretion efficiencies — sustaining it over the 10 Myr lifetime of the gas disk would cause the core to double in mass to . Not only would this mass doubling put the planet outside the range of most of the measured masses of super-Earths (Wu & Lithwick, 2013; Weiss & Marcy, 2014), but it would also reduce the time to runaway by a factor of 16 ( according to our Figure 7) — ironically pushing the planet over the cliff we were trying to avoid in the first place. Thus appealing to accretion of planetesimals, either from the inner disk or from the outer disk, to support atmospheres against collapse seems infeasible.
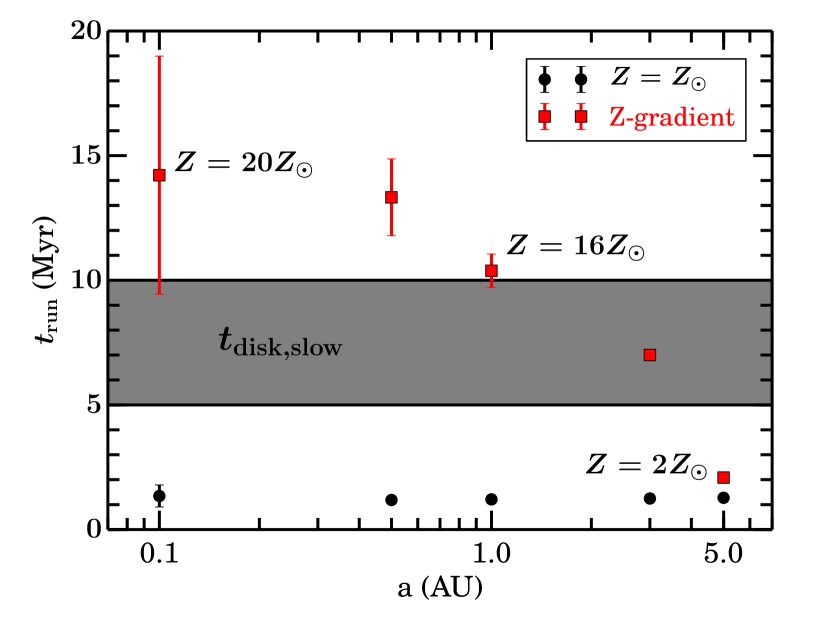
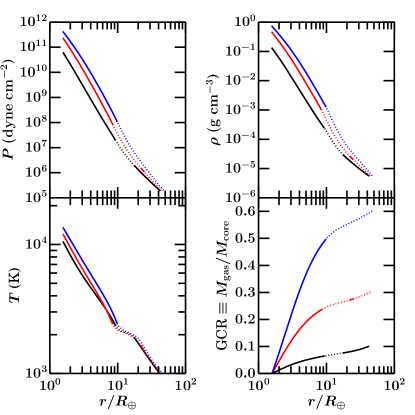
With zero heating, the time to runaway gas accretion is the time for the marginally self-gravitating gas envelope to cool. As the black points in Figure 8 reveal, at a fixed envelope metallicity and core mass, the runaway time is remarkably invariant with orbital distance. Figure 9 shows why. The radiative-convective boundary (RCB) of the atmosphere occurs at the dissociation front. Because the circumstances of dissociation are fairly universal (governed as they are by the universal laws of statistical quantum mechanics), the H2 dissociation front occurs at temperatures and densities that are insensitive to whether the planet is located at 0.1 AU or 5 AU. Temperature and density profiles in the convective zone interior to the RCB vary only by factors of 2 between models at different stellocentric distances. This inner convective zone contains the lion’s share of the envelope’s mass and energy, which means that its cooling rate controls the time to runaway accretion. Nearly identical convective zone profiles beget nearly identical runaway accretion times. Similar results are reported by Hori & Ikoma (2011), who find for their static models that the critical core mass — the maximum core mass for which the envelope can stay in strict hydrostatic equilibrium — varies by at most a factor of 2 from 1 AU to 10 AU. Like us, these authors incorporate dissociation in their equation of state and opacity laws.
Taken at face value, the black points in Figure 8 suggest that 10- solid cores, placed anywhere from 0.1 AU to 5 AU in a gas-rich protoplanetary disk of solar composition, readily transform into gas giants before the gas disperses in 5–10 Myr. But observations inform us that 10 rocky cores—and not gas giants—abound at distances inside 1 AU. The Kepler spacecraft has established that super-Earths having radii of 1–4 orbit some 20% of Sun-like stars at distances of 0.05–0.3 AU (Howard et al., 2010; Batalha et al., 2013; Petigura et al., 2013; Dong & Zhu, 2013; Fressin et al., 2013; Rowe et al., 2014). By contrast, Jupiter-sized objects are rare; the occurrence rate for hot Jupiters inside 0.1 AU is only 1%, and the occurrence rate for warm Jupiters between 0.1–1 AU is even smaller, in the so-called “period valley” (Jones et al., 2003; Udry et al., 2003; Wright et al., 2012; Fressin et al., 2013; Dawson & Murray-Clay, 2013). At larger distances, gas giants appear more frequently, orbiting up to 20% of Sun-like stars at AU (Cumming et al., 2008).
How do we reconcile our models with these observations? We propose two possible scenarios: (1) cores accrete envelopes in disks with dust-to-gas ratios that are strongly supersolar at 0.1 AU and that decrease outward, and (2) the final assembly of super-Earths is delayed by gas dynamical friction to the era of disk dispersal.
4.1. Supersolar Metallicity Gradients in Dusty Disks
Enriching atmospheres in metals (by increasing their dust content or, less effectively, by increasing their metallic gas content) delays runaway accretion by making envelopes more opaque, decreasing their luminosities and extending their cooling times (see §3.2). The importance of metallicity and opacity in this regard is widely acknowledged (e.g., Stevenson 1982; Ikoma et al. 2000; PY). Our goal is to search for an appropriately supersolar and outwardly decreasing metallicity profile for the parent gas disk that can prevent gas giant formation at 0.1 AU while promoting it at 5 AU.
Disk metallicity gradients are actually hinted at by the atmospheric compositions of close-in super-Earths GJ 1214b (6.26 , 2.85 , AU; Harpsøe et al. 2013) and GJ 436b (24.8 , 4.14 , AU; von Braun et al. 2012), and our own Jupiter. GJ 1214b and GJ 436b are characterized by optical-to-infrared transmission spectra that are featureless (Kreidberg et al., 2014; Knutson et al., 2014). Clouds can explain these flat spectra, but the kinds of clouds that are compatible with observations can only be generated in atmospheres of supersolar metallicity (e.g., : Morley et al., 2013). Higher metallicity envelopes have more condensibles so that cloud formation occurs at the higher altitudes probed by near-infrared observations.101010Figure 1 of Morley et al. (2013) suggests that at , the cloudbed forms at 30 mbar, a pressure times higher than the observationally inferred cloud-top pressure of mbar for GJ 1214b (Kreidberg et al., 2014, their Figure 3). Morley et al. (2013) argue that the cloud particles (of ZnS and KCl) can be lifted by currents or turbulence. We note that the need for vertical updrafts lessens as super-Earth atmospheres increase in metal content, and in fact, observations are compatible with up to 1 (see also Moses et al. 2013). But we disfavor because envelopes with such extreme metallicity—with their large mean molecular weights —tend to runaway quickly (Hori & Ikoma, 2011; Piso & Youdin, 2014). As long as , increases only weakly with (Nettelmann et al., 2011, their Figure 6). Jupiter at 5 AU is also observed to have supersolar metallicity, but importantly, the degree of enrichment is less extreme than for close-in super-Earths. In-situ measurements of elemental abundances by the Galileo probe indicate that Jupiter’s upper atmosphere has (Owen et al. 1999; see also Guillot 2005). Models of Jupiter’s interior using equations of state based on laser compression experiments suggest that Jupiter’s envelope as a whole has – (Guillot, 2005, their Figure 7).
In Figure 8, we demonstrate that a simple linear metallicity profile extending from at 0.1 AU to at 5 AU can successfully circumvent runaway at AU, while still ensuring the formation of Jupiter at 5 AU. Strong metal enrichment at 0.1 AU protects close-in super-Earths from becoming gas giants. As one travels down the metallicity gradient, the time to runaway decreases and eventually falls within gas disk lifetimes, in accord with the outwardly increasing occurrence rate of gas giants. Note that the lengthening of runaway time at 0.1 AU is made possible by refractory (silicate/metal) dust grains, whose evaporation causes the innermost radiative-convective boundary (RCB) to coincide with the H2 dissociation front. This placement of the RCB makes especially sensitive to the overall gas metallicity, since metals contribute to the abundance of H- which dominates the local opacity.
A supersolar and outwardly decreasing metallicity profile in the innermost regions of protoplanetary disks is not without physical motivation. First note that disk metallicity should not be confused with host star metallicity. During the earliest stages of star/planet formation, a protostellar disk may begin with a spatially uniform metallicity equal to that of its host star. But thereafter, dust and gas within the disk can segregate, and the metallicity can vary with location. The protoplanetary disk TW Hydra is observed to have a dust-to-gas ratio that decreases radially outward (Andrews et al. 2012; see also Williams & Best 2014). This decreasing metallicity profile is readily explained by solid particles drifting inward by aerodynamic drag and possibly piling up (Youdin & Shu 2002; Youdin & Chiang 2004; Birnstiel et al. 2012; Hansen & Murray 2013; Chatterjee & Tan 2014; Schlichting 2014). In turn, increased solid abundances reduce radial drift velocities, fostering stronger pile-ups (Bai & Stone, 2010). The collection of solid material amassed in the inner disk, coupled with the higher orbital speeds there, enhances local collision rates and collision velocities. High-speed collisions shatter solids, polluting the surrounding nebular gas with dust—though whether such dust can persist in planetary atmospheres and avoid coagulation and sedimentation is not clear (Ormel, 2014; Mordasini, 2014). Another concern is whether icy mantles of drifting dust grains may have sublimated away before reaching the hot inner disk; gas there might then be too poor in volatile species like C, N, and O to explain their inferred abundances in super-Earth atmospheres (Morley et al., 2013; Knutson et al., 2014; Kreidberg et al., 2014). One way out is to imagine that sufficiently large planetesimals keep their volatiles locked in their interiors as they drift past the disk’s nominal ice line. Another possibility is that disk gas can accrete and transport gaseous volatiles created at the sublimation front.
The scenario presented in this subsection posits that super-Earth cores form within disks having full reservoirs of gas. Although our models indicate that cores in such gas-rich nebulae stave off runaway for high disk metallicities, we find that the planets do not avoid accreting fairly massive gas envelopes. Using our scaling relations, we estimate that at AU in a gas disk that lasts 5–10 Myr, a 10 core attains a gas-to-core mass ratio GCR of 0.2–0.6.111111The GCR as a function of time for is calculated by dilating the time axis of GCR for by (see lower right panel of Figure 7). These values (which lie within order-unity factors of runaway) are considerably higher than present-day GCRs, which apparently range from 0.03–0.1 (for Kepler planets having 2–4 ; Lopez & Fortney, 2014, their Figures 6 and 7). Photoevaporation can bridge the gap between past — i.e., the moment the gas disk clears — and present. Over the course of 100 Myrs, X-rays from host stars can photoevaporate super-Earth envelopes from initial GCRs of 0.4 down to final GCRs of 0.01–0.1, with the precise evolution depending on stellocentric distance and core mass (Owen & Wu, 2013, their Figure 8). In fact, planets of any initial GCR from 0.01–0.4, when eroded by X-rays, tend to asymptote toward a final GCR of 0.01. This convergence arises because higher mass envelopes at early times are more distended and therefore lose mass more quickly than lower mass envelopes at late times: photoevaporative histories that begin differently conclude similarly.
4.2. Late-Stage Core Formation in
Gas-Depleted Nebula
Another way to prevent gas giant formation on close-in orbits is to delay the final assembly of cores until the era of disk dispersal. It may seem that we will have to fine-tune the timing of disk dispersal and the degree of nebular density reduction so that cores acquire enough gas (1–10% by mass) to satisfy observations. But we show below that there is a wide range of acceptable scenarios: that the nebula can be reduced in density by factors as large as 1000 and still provide enough gas to reproduce the inferred atmospheres of super-Earths.
Gas exerts dynamical friction on proto-cores, postponing mergers by damping eccentricities and preventing orbit crossing. Deferring the final coagulation of solids until after the gas clears and dynamical friction weakens is the standard way to explain how the terrestrial planets in our solar system avoided accreting nebular hydrogen (e.g., Kominami & Ida, 2002). Though it may not be obvious, we will see from a timescale comparison given below that even within this scenario of late-stage core assembly, the assumption of zero power from the accretion of solids () during the era of gas accretion can still be valid at 0.1 AU. Gas dynamical friction delays the final merger phase of proto-cores, but once this phase begins, it completes rapidly so that subsequent gas accretion occurs without solid accretion.
We consider the final assembly of 10 cores from merging pairs of 5- cores, i.e., the last doubling in planet mass that follows after an “oligarchy” of multiple 5- proto-cores destabilizes and crosses orbits (e.g., Kokubo & Ida, 1998). The timescale for gas dynamical friction to damp the eccentricity of a proto-core (and thereby forestall orbit crossing) at 0.1 AU in the minimum-mass extrasolar nebula (MMEN) is
| (36) |
(see, e.g., equation 2.2 of Kominami & Ida 2002). This stabilization timescale should be compared against the destabilization (a.k.a. viscous stirring) timescale for oligarchs to cross orbits by mutual gravitational interactions. Drawing from the viscous stirring formulae of Goldreich et al. (2004), we find that orbit crossing occurs when the gas surface density falls below the surface density of oligarchs. In other words, when the density of gas becomes comparable to that of solids — i.e., when — one can no longer treat the gas disk as an infinite sink of angular momentum for the oligarchs; the backreaction on gas by the oligarchs effectively shuts off gas dynamical friction. Oligarchs proceed to excite each other’s eccentricities to the point of orbit crossing and merging.
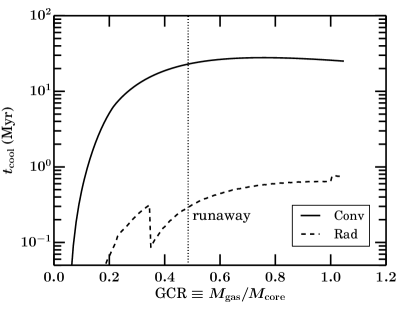
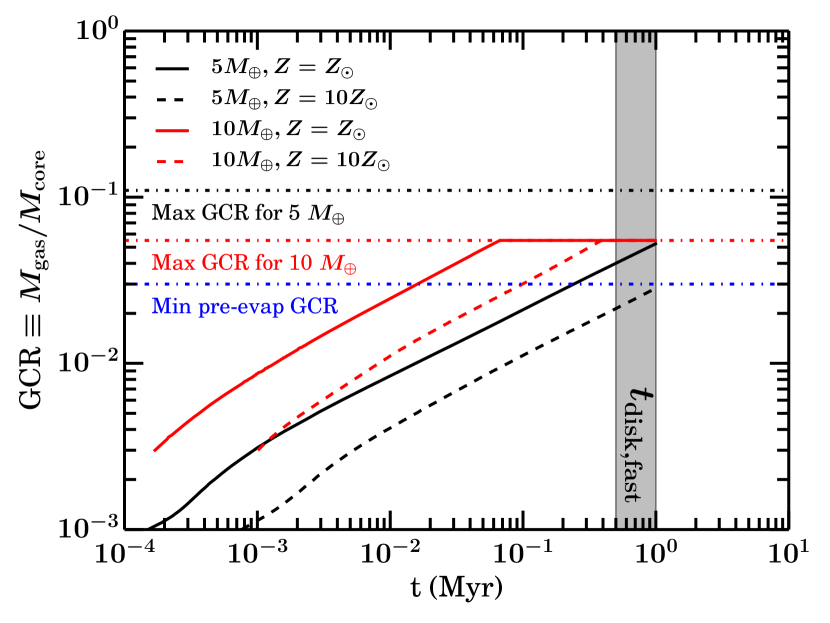
Such depleted disks do not have enough gas to spawn gas giants. But is there enough nebular gas remaining for cores to accrete envelopes massive enough to satisfy observationally inferred GCRs? Our answer is yes, for core masses and for gas densities not much less than . Figure 10 shows that within a disk whose gas content has drained 1000-fold relative to that of the MMEN, cores of mass 5–10 can still accrete enough gas to attain GCRs of 2–5% within –1 Myr — this is our estimate for the timescale over which disk gas exponentially decays. We compute the latter by taking 10% of –10 Myr, the age of the disk when it first begins to dissipate. For a review of the “two-timescale” nature of disk dispersal, see Alexander et al. (2014).
The process of orbit crossing and merging, once begun, completes on a timescale much shorter than . For 5- oligarchs separated by mutual Hill radii at 0.1 AU, we estimate that the orbit-crossing timescale can range anywhere from 3 to 3000 yr, where we have scaled the results of Zhou et al. (2007, the squares and crosses in their Figure 1a) at 1 AU for the shorter orbital period at 0.1 AU, and where the range in times reflects a possible range of non-zero initial eccentricities and inclinations. For our chosen parameters, both and the coagulation timescale yrs (Equation (2) in Section 1) are still small fractions of . This validates our assumption that planetesimal accretion is negligible while gas accretes onto cores. To re-cap the sequence of events: (a) oligarchs are prevented by gas dynamical friction from completing their last doubling for –10 Myr; (b) the gas density depletes by a factor of 200 over several e-folding times –1 Myr until the gas density becomes comparable to the solid density and dynamical friction shuts off; (c) neighboring oligarchs perturb one another onto crossing orbits over –3000 yr; (d) super-Earth cores congeal within yr; at this stage planetesimals are completely consumed; (e) whatever nebular gas remains is accreted by super-Earths within the next gas e-folding timescale –1 Myr — a phase during which there is no planetesimal accretion ().
Our final GCRs for 10 cores are 5–20% for disk gas densities – that of the MMEN. X-ray photoevaporation can whittle our computed GCRs down to a few percent or lower (Owen & Wu, 2013). Post-evaporation GCRs of a few percent agree with GCRs estimated from observations of present-day super-Earths (Lopez & Fortney 2014; note that inferred GCRs can be as low as 0.1%; see their Table 1).
While super-Earths at 0.1 AU can achieve GCRs of a few percent, their counterparts at 1 AU may be devoid of gas. The reason is that coagulation times for solids — in the absence of gravitational focussing — increase strongly with orbital distance: (see equation 2). Contrast the sequence of events outlined above for cores at 0.1 AU with the situation at 1 AU where yr (where again we have drawn from Zhou et al. 2007). Thus upon assembly at 1 AU, Earth-sized and larger cores have no gas at all to accrete. What little gas may have been accrued by proto-cores before they merge may be blown off after they fully coagulate, by accretion of planetesimals (having sizes km for a proto-core; Schlichting et al. 2015) or by Jeans escape and hydrodynamic escape (e.g., Watson et al. 1981; see also the textbook by Chamberlain & Hunten 1987).
Even farther out at 5 AU, the process of core accretion must perform an abrupt about-face. Here we desire that cores massive enough to undergo runaway coagulate within gas-rich disks, in order that gas giants like Jupiter may form. Cores having isolation masses at these distances must run away without having to merge with neighboring bodies. The standard argument is to appeal to the boost in isolation masses at larger orbital radii. Protoplanets farther out have larger feeding zones, both because of their larger orbits and because of their larger Hill radii. Furthermore, the disk’s solid surface density is enhanced outside the “ice line” (water condensation front) at 2–3 AU (Lecar et al. 2006; see also Öberg et al. 2011). The factor of 4 increase in solids from ice condensation raises oligarch masses by a factor of to at 5 AU within the minimum-mass solar nebula (MMSN; see, e.g., equation 22 of Kokubo & Ida 2000). These masses are within factors of 2 of those required for runaway gas accretion within gas disk lifetimes. A modest, order-unity increase in solid surface density above that of the MMSN (provided, e.g., by the MMEN, whose density exceeds that of the MMSN by a factor of 5) can easily make up the shortfall.
Details of the scenario described in this subsection are subject to some uncertainty. Cores may not accrete sufficient gas if planetesimal accretion rates are high enough (N. Inamdar & H. Schlichting, in preparation). Our scenario also neglects gas disk turbulence and its associated density fluctuations, which can cause oligarchs’ semi-major axes and eccentricities to random walk (Kley & Nelson 2012, their section 3.1; Okuzumi & Ormel 2013). Thus gas does not only delay core formation through dynamical friction; it can also hasten core formation by promoting orbit crossing through turbulent stirring.
5. CONCLUSIONS
Observations and modeling of the radii and masses of close-in super-Earths reveal that such planets may have hydrogen envelopes comprising a few percent by mass of their solid cores. We calculated how rocky cores could accrete such atmospheres from their natal gas disks, under a wide variety of nebular conditions and at orbital distances ranging from 0.1 to 5 AU. Our main findings are as follows:
-
1.
In an in-situ formation scenario, solids coagulate to form close-in super-Earth cores, consuming all available planetesimals, well before gas accretes onto those cores. High local surface densities and short dynamical times enable fast coagulation. The luminosity from planetesimal accretion likely cannot prevent runaway for 10 cores, even when we account for planetesimals that originate from outside 1 AU. With no planetesimal accretion as a heat source, the evolution of the gaseous envelope is that of Kelvin-Helmholtz contraction: envelopes gain mass as fast as they can cool.
-
2.
The time for a core to undergo runaway gas accretion is well approximated by the cooling time of the envelope’s innermost convective zone. The extent of this zone is determined by where H2 dissociates — when envelopes are dusty. The strong dependences of on core mass and dust opacity, and its weak dependences on nebular density and temperature, can be understood in terms of the circumstances governing H2 dissociation.
-
3.
In disks with solar metallicity and gas densities comparable to either the minimum-mass solar nebula (MMSN) or the minimum-mass extrasolar nebula (MMEN) — these differ only by factors of a few in density — 10 cores undergo runaway gas accretion to become Jupiters, irrespective of whether they are located at 0.1 or 5 AU. The propensity for super-Earths at 0.1 AU to explode into Jupiters is at odds with the rarity of gas giants at these distances. We presented two ways to solve this puzzle:
-
(a)
Disks have gradients in their dust-to-gas ratio. To prevent runaway at distances AU yet ensure the formation of Jupiters at 1–5 AU, the inner disk may have to have a strongly supersolar dust-to-gas ratio (e.g., ), while the outer disk may be more nearly solar in metallicity (e.g., ). Copious dust pushes the boundary of the innermost convective zone to the H2 dissociation front, where increased metals enhance the H- opacity and slow cooling. We estimated that 10- cores at 0.1 AU in dusty disks achieve gas-to-core mass ratios (GCRs) that are marginally small enough to avoid runaway. After the disk gas clears, high-energy radiation from host stars photoevaporates planetary envelopes and can reduce GCRs to a few percent, in line with observation.
-
(b)
Super-Earth cores coagulate just as the gas is about to disappear completely. Coagulation is inhibited by gas dynamical friction; proto-cores merge to become full-fledged super-Earths only after the gas surface density drops below the surface density of proto-cores so that dynamical friction shuts off. A 10 core that forms in such a depleted nebula at 0.1 AU can still emerge with a GCR of a few percent or larger, even after photoevaporative erosion.
Note that scenarios (a) and (b) are not mutually exclusive. In fact, (b) can reinforce (a): solids can be left behind while disk gas depletes (say by disk photoevaporation; e.g., Guillot & Hueso 2006), increasing dust-to-gas ratios.
-
(a)
One way to test our ideas is to measure the occurrence rates of super-Earths and Jupiters as functions of orbital distance — particularly beyond 1 AU. Our expectation is that super-Earths should become less common at distances AU as they are transformed into Jupiters. The frequency of Jupiters is already known to increase outward — from the “period valley” at 0.1 AU where giant planets are rare, to the “land of the giants” at 1–10 AU where occurrence rates can be as large as 20% (Cumming et al., 2008). The data for super-Earths is less extensive; occurrence rates for objects having radii – per logarithmic bin in orbital period are nearly uniform out to 145 days (Fressin et al., 2013). But for objects with – (what we still categorize as super-Earths but which Fressin et al. 2013 call “mini-Neptunes”), there are exciting hints that the occurrence rate decreases with increasing distance: their frequency decreases monotonically from 6% at 30 days to 3% at 150 days (Fressin et al., 2013). We look forward to extending this data to still longer periods with radial velocity and transit surveys.
To further evaluate the disk metallicity gradient scenario, it will be helpful to measure dust-to-gas ratios against orbital distance in disks (e.g., Andrews et al. 2012; Williams & Best 2014), especially inside a few AU, and to constrain metallicities of more super-Earth atmospheres, as was done for GJ 436b (Knutson et al., 2014) and GJ 1214b (Kreidberg et al., 2014). On the theoretical side, the supersolar metallicity scenario requires that atmospheres be dusty, but efficient coagulation and sedimentation can clear atmospheres of dust; thus, more studies of cloud/grain physics will also be welcome (Morley et al., 2013; Ormel, 2014; Mordasini, 2014). More generally, our 1D models can be improved by considering 2D/3D effects such as the opening of gaps in circumstellar disks (e.g., Fung et al., 2014) and the formation of circumplanetary disks (Lissauer et al. 2009; Ormel et al. 2014). And more carefully resolving the outermost radiative zones of our model atmospheres will enable us to explore a wider range of core masses and outer envelope radii.
There are a couple “extreme solar systems” deserving of further consideration. Kepler-36 hosts two planets that are only 0.01 AU apart yet whose measured densities suggest one is purely rocky while the other contains significant gas (Carter et al., 2012). How can this system be accommodated within core accretion theory (see Owen & Wu 2013 and Lopez & Fortney 2013 for pioneering explorations)? HD 149026b is a “hot Saturn” situated at 0.04 AU with a total mass of 114 and a modelled core mass of (Sato et al., 2005; Wolf et al., 2007): the latter is high enough for the planet to become a Jupiter at any orbital distance. How did it avoid becoming a gas giant?
References
- Alexander et al. (2014) Alexander, R., Pascucci, I., Andrews, S., Armitage, P., & Cieza, L. 2014, in Protoplanets and Protostars VI, ed. Beuther, H. and Klessen, R. S. and Dullemond, C. P. and Henning, T. (The University of Arizona Press)
- Andrews et al. (2012) Andrews, S. M., Wilner, D. J., Hughes, A. M., et al. 2012, ApJ, 744, 162
- Bai & Stone (2010) Bai, X.-N., & Stone, J. M. 2010, ApJ, 722, 1437
- Batalha et al. (2013) Batalha, N. M., Rowe, J. F., Bryson, S. T., et al. 2013, ApJS, 204, 24
- Birnstiel et al. (2012) Birnstiel, T., Klahr, H., & Ercolano, B. 2012, A&A, 539, A148
- Bodenheimer et al. (2000) Bodenheimer, P., Hubickyj, O., & Lissauer, J. J. 2000, Icarus, 143, 2
- Bodenheimer & Lissauer (2014) Bodenheimer, P., & Lissauer, J. J. 2014, ApJ, 791, 103
- Carter et al. (2012) Carter, J. A., Agol, E., Chaplin, W. J., et al. 2012, Science, 337, 556
- Chamberlain & Hunten (1987) Chamberlain, J. W., & Hunten, D. M. 1987, Orlando FL Academic Press Inc International Geophysics Series, 36
- Chatterjee & Tan (2014) Chatterjee, S., & Tan, J. C. 2014, ApJ, 780, 53
- Chiang & Laughlin (2013) Chiang, E., & Laughlin, G. 2013, MNRAS, 431, 3444
- Chiang & Goldreich (1997) Chiang, E. I., & Goldreich, P. 1997, ApJ, 490, 368
- Cumming et al. (2008) Cumming, A., Butler, R. P., Marcy, G. W., et al. 2008, PASP, 120, 531
- D’Alessio et al. (2001) D’Alessio, P., Calvet, N., & Hartmann, L. 2001, ApJ, 553, 321
- D’Alessio et al. (1998) D’Alessio, P., Cantö, J., Calvet, N., & Lizano, S. 1998, ApJ, 500, 411
- Dawson & Murray-Clay (2013) Dawson, R. I., & Murray-Clay, R. A. 2013, ApJ, 767, L24
- Dong & Zhu (2013) Dong, S., & Zhu, Z. 2013, ApJ, 778, 53
- Ferguson et al. (2005) Ferguson, J. W., Alexander, D. R., Allard, F., et al. 2005, ApJ, 623, 585
- Fressin et al. (2013) Fressin, F., Torres, G., Charbonneau, D., et al. 2013, ApJ, 766, 81
- Fung et al. (2014) Fung, J., Shi, J.-M., & Chiang, E. 2014, ApJ, 782, 88
- Goldreich et al. (2004) Goldreich, P., Lithwick, Y., & Sari, R. 2004, ARA&A, 42, 549
- Grevesse & Noels (1993) Grevesse, N., & Noels, A. 1993, Origin and Evolution of the Elements (Cambridge University Press)
- Guillot (2005) Guillot, T. 2005, Annual Review of Earth and Planetary Sciences, 33, 493
- Guillot et al. (1994) Guillot, T., Gautier, D., Chabrier, G., & Mosser, B. 1994, Icarus, 112, 337
- Guillot & Hueso (2006) Guillot, T., & Hueso, R. 2006, MNRAS, 367, L47
- Hansen & Murray (2012) Hansen, B. M. S., & Murray, N. 2012, ApJ, 751, 158
- Hansen & Murray (2013) —. 2013, ApJ, 775, 53
- Harpsøe et al. (2013) Harpsøe, K. B. W., Hardis, S., Hinse, T. C., et al. 2013, A&A, 549, A10
- Harris (1978) Harris, A. W. 1978, in Lunar and Planetary Inst. Technical Report, Vol. 9, Lunar and Planetary Science Conference, 459–461
- Hori & Ikoma (2011) Hori, Y., & Ikoma, M. 2011, MNRAS, 416, 1419
- Howard et al. (2010) Howard, A. W., Marcy, G. W., Johnson, J. A., et al. 2010, Science, 330, 653
- Ikoma & Hori (2012) Ikoma, M., & Hori, Y. 2012, ApJ, 753, 66
- Ikoma et al. (2000) Ikoma, M., Nakazawa, K., & Emori, H. 2000, ApJ, 537, 1013
- Jones et al. (2003) Jones, H. R. A., Butler, R. P., Tinney, C. G., et al. 2003, MNRAS, 341, 948
- Karato (2011) Karato, S.-i. 2011, Icarus, 212, 14
- Kley & Nelson (2012) Kley, W., & Nelson, R. P. 2012, ARA&A, 50, 211
- Knutson et al. (2014) Knutson, H. A., Benneke, B., Deming, D., & Homeier, D. 2014, Nature, 505, 66
- Kokubo & Ida (1998) Kokubo, E., & Ida, S. 1998, Icarus, 131, 171
- Kokubo & Ida (2000) —. 2000, Icarus, 143, 15
- Kominami & Ida (2002) Kominami, J., & Ida, S. 2002, Icarus, 157, 43
- Kratter et al. (2010) Kratter, K. M., Murray-Clay, R. A., & Youdin, A. N. 2010, ApJ, 710, 1375
- Kreidberg et al. (2014) Kreidberg, L., Bean, J. L., Désert, J.-M., et al. 2014, Nature, 505, 69
- Lecar et al. (2006) Lecar, M., Podolak, M., Sasselov, D., & Chiang, E. 2006, ApJ, 640, 1115
- Leconte & Chabrier (2012) Leconte, J., & Chabrier, G. 2012, A&A, 540, A20
- Leconte & Chabrier (2013) —. 2013, Nature Geoscience, 6, 347
- Lissauer et al. (2009) Lissauer, J. J., Hubickyj, O., D’Angelo, G., & Bodenheimer, P. 2009, Icarus, 199, 338
- Lissauer & Stevenson (2007) Lissauer, J. J., & Stevenson, D. J. 2007, Protostars and Planets V, 591
- Lissauer et al. (2011) Lissauer, J. J., Fabrycky, D. C., Ford, E. B., et al. 2011, Nature, 470, 53
- Lissauer et al. (2013) Lissauer, J. J., Jontof-Hutter, D., Rowe, J. F., et al. 2013, ApJ, 770, 131
- Lopez & Fortney (2013) Lopez, E. D., & Fortney, J. J. 2013, ApJ, 776, 2
- Lopez & Fortney (2014) —. 2014, ApJ, 792, 1
- Mamajek (2009) Mamajek, E. E. 2009, in American Institute of Physics Conference Series, Vol. 1158, American Institute of Physics Conference Series, ed. T. Usuda, M. Tamura, & M. Ishii, 3–10
- Marois et al. (2008) Marois, C., Macintosh, B., Barman, T., et al. 2008, Science, 322, 1348
- Marois et al. (2010) Marois, C., Zuckerman, B., Konopacky, Q. M., Macintosh, B., & Barman, T. 2010, Nature, 468, 1080
- Mizuno (1980) Mizuno, H. 1980, Progress of Theoretical Physics, 64, 544
- Mizuno et al. (1978) Mizuno, H., Nakazawa, K., & Hayashi, C. 1978, Progress of Theoretical Physics, 60, 699
- Mordasini (2014) Mordasini, C. 2014, ArXiv e-prints, arXiv:1406.4127
- Morley et al. (2013) Morley, C. V., Fortney, J. J., Kempton, E. M.-R., et al. 2013, ApJ, 775, 33
- Moses et al. (2013) Moses, J. I., Line, M. R., Visscher, C., et al. 2013, ApJ, 777, 34
- Movshovitz et al. (2010) Movshovitz, N., Bodenheimer, P., Podolak, M., & Lissauer, J. J. 2010, Icarus, 209, 616
- Nettelmann et al. (2011) Nettelmann, N., Fortney, J. J., Kramm, U., & Redmer, R. 2011, ApJ, 733, 2
- Öberg et al. (2011) Öberg, K. I., Murray-Clay, R., & Bergin, E. A. 2011, ApJ, 743, L16
- Okuzumi & Ormel (2013) Okuzumi, S., & Ormel, C. W. 2013, ApJ, 771, 43
- Ormel (2014) Ormel, C. W. 2014, ApJ, 789, L18
- Ormel et al. (2014) Ormel, C. W., Kuiper, R., & Shi, J.-M. 2014, ArXiv e-prints, arXiv:1410.4658
- Ormel & Shi (2014) Ormel, C. W., & Shi, J.-M. 2014, in IAU Symposium, Vol. 299, IAU Symposium, ed. M. Booth, B. C. Matthews, & J. R. Graham, 173–174
- Owen & Wu (2013) Owen, J. E., & Wu, Y. 2013, ApJ, 775, 105
- Owen et al. (1999) Owen, T., Mahaffy, P., Niemann, H. B., et al. 1999, Nature, 402, 269
- Papaloizou & Nelson (2005) Papaloizou, J. C. B., & Nelson, R. P. 2005, A&A, 433, 247
- Papuc & Davies (2008) Papuc, A. M., & Davies, G. F. 2008, Icarus, 195, 447
- Perri & Cameron (1974) Perri, F., & Cameron, A. G. W. 1974, Icarus, 22, 416
- Petigura et al. (2013) Petigura, E. A., Marcy, G. W., & Howard, A. W. 2013, ApJ, 770, 69
- Pfalzner et al. (2014) Pfalzner, S., Steinhausen, M., & Menten, K. 2014, ApJ, 793, L34
- Piso & Youdin (2014) Piso, A.-M. A., & Youdin, A. N. 2014, ApJ, 786, 21
- Pollack et al. (1996) Pollack, J. B., Hubickyj, O., Bodenheimer, P., et al. 1996, Icarus, 124, 62
- Rafikov (2006) Rafikov, R. R. 2006, ApJ, 648, 666
- Rafikov (2011) —. 2011, ApJ, 727, 86
- Rogers et al. (2011) Rogers, L. A., Bodenheimer, P., Lissauer, J. J., & Seager, S. 2011, ApJ, 738, 59
- Rogers & Seager (2010a) Rogers, L. A., & Seager, S. 2010a, ApJ, 712, 974
- Rogers & Seager (2010b) —. 2010b, ApJ, 716, 1208
- Rowe et al. (2014) Rowe, J. F., Bryson, S. T., Marcy, G. W., et al. 2014, ApJ, 784, 45
- Sato et al. (2005) Sato, B., Fischer, D. A., Henry, G. W., et al. 2005, ApJ, 633, 465
- Saumon et al. (1995) Saumon, D., Chabrier, G., & van Horn, H. M. 1995, ApJS, 99, 713
- Schlichting (2014) Schlichting, H. E. 2014, ApJ, 795, L15
- Schlichting et al. (2015) Schlichting, H. E., Sari, R., & Yalinewich, A. 2015, Icarus, 247, 81
- Stamenković et al. (2012) Stamenković, V., Noack, L., Breuer, D., & Spohn, T. 2012, ApJ, 748, 41
- Stevenson (1982) Stevenson, D. J. 1982, Planet. Space Sci., 30, 755
- Udry et al. (2003) Udry, S., Mayor, M., & Santos, N. C. 2003, A&A, 407, 369
- von Braun et al. (2012) von Braun, K., Boyajian, T. S., Kane, S. R., et al. 2012, ApJ, 753, 171
- Watson et al. (1981) Watson, A. J., Donahue, T. M., & Walker, J. C. G. 1981, Icarus, 48, 150
- Weiss & Marcy (2014) Weiss, L. M., & Marcy, G. W. 2014, ApJ, 783, L6
- Williams & Best (2014) Williams, J. P., & Best, W. M. J. 2014, ApJ, 788, 59
- Wolf et al. (2007) Wolf, A. S., Laughlin, G., Henry, G. W., et al. 2007, ApJ, 667, 549
- Wright et al. (2012) Wright, J. T., Marcy, G. W., Howard, A. W., et al. 2012, ApJ, 753, 160
- Wu & Lithwick (2013) Wu, Y., & Lithwick, Y. 2013, ApJ, 772, 74
- Wuchterl (1993) Wuchterl, G. 1993, Icarus, 106, 323
- Wuchterl et al. (2000) Wuchterl, G., Guillot, T., & Lissauer, J. J. 2000, Protostars and Planets IV, 1081
- Youdin & Chiang (2004) Youdin, A. N., & Chiang, E. I. 2004, ApJ, 601, 1109
- Youdin & Shu (2002) Youdin, A. N., & Shu, F. H. 2002, ApJ, 580, 494
- Zhou et al. (2007) Zhou, J.-L., Lin, D. N. C., & Sun, Y.-S. 2007, ApJ, 666, 423