Breakdown of Fermi liquid description for strongly interacting fermions
Abstract
The nature of the normal state of an ultracold Fermi gas in the BCS-BEC crossover regime is an intriguing and controversial topic. While the many-body ground state remains a condensate of paired fermions, the normal state must evolve from a Fermi liquid to a Bose gas of molecules as a function of the interaction strength. How this occurs is still largely unknown. We explore this question with measurements of the distribution of single-particle energies and momenta in a nearly homogeneous gas above . The data fit well to a function that includes a narrow, positively dispersing peak that corresponds to quasiparticles and an “incoherent background” that can accommodate broad, asymmetric line shapes. We find that the quasiparticle’s spectral weight vanishes abruptly as the strength of interactions is modified, which signals the breakdown of a Fermi liquid description. Such a sharp feature is surprising in a crossover.
pacs:
67.85.Lm,03.75.SsLandau’s Fermi liquid theory is a well-established and powerful paradigm for describing systems of interacting fermions Landau (1957); Lifshitz and Pitaevskii (1980). It postulates that even in the presence of strong interactions, the system retains a Fermi surface and has low energy excitations that are long-lived, fermionic, and nearly non-interacting. The effect of interactions is incorporated into renormalized properties of these quasiparticle excitations, such as an effective mass, , that is larger than the bare fermion mass, , and a spectral weight, or quasiparticle residue, that is between zero and one Lifshitz and Pitaevskii (1980). While Fermi liquid theory is extremely successful in describing a wide range of materials, it fails in systems exhibiting strong fluctuations or spatial correlations. Understanding the origin of such breakdowns of a Fermi liquid description is an outstanding challenge in strongly correlated electron physics Hill et al. (2001).
An ultracold Fermi gas with tunable interactions is a paradigmatic strongly correlated system. These atomic gases provide access to the crossover from Bardeen-Cooper-Schrieffer (BCS) superconductivity to Bose-Einstein condensation (BEC) of tightly bound fermion pairs Regal and Jin (2006); Ketterle and Zwierlein (2008); Chen et al. (2005); Zwerger (2012); Randeria and Taylor (2014). The question of whether the Fermi liquid paradigm breaks down in the normal state of the crossover is related to the prediction of a “pseudogap” phase, where incoherent many-body pairing occurs above the transition temperature . This pseudogap phase has bosonic (pair) excitations, in contrast to the fermionic excitations of a conventional Fermi liquid. In experiments that probed the strongly interacting gas in the middle of the crossover, Fermi-liquid-like behavior was observed in thermodynamic Nascimbène et al. (2010); Navon et al. (2010) and spin transport properties Sommer et al. (2011). Meanwhile, evidence for pairing above was reported in photoemission spectroscopy (PES) measurements Gaebler et al. (2010), which reveal the distribution of single-particle energies and momenta in a many-body system Stewart et al. (2008); Chen et al. (2009). Interpretation of these data has been controversial, with a Fermi liquid theory and a pseudogap theory each separately argued to agree with the observations Nascimbène et al. (2011); Perali et al. (2011); Wulin et al. (2011). Issues raised include the fact that the PES measurements probed a trapped gas, where averaging over the inhomogeneous density can obscure the intrinsic physics Nascimbène et al. (2011); Haussmann et al. (2009), and that thermodynamics measurements are relatively insensitive to a pseudogap compared to spectroscopy. Thus, the question of how a Fermi liquid evolves into a Bose gas of paired fermions in the BCS-BEC crossover, and whether a Fermi liquid description breaks down, remains open. Here, we answer this question with the first PES of a nearly homogeneous Fermi gas; we perform measurements above for a range of interaction strengths through the crossover (Fig. 1a), and find that quasiparticle excitations, which exist on the BCS side, vanish abruptly beyond a certain interaction strength on the BEC side.
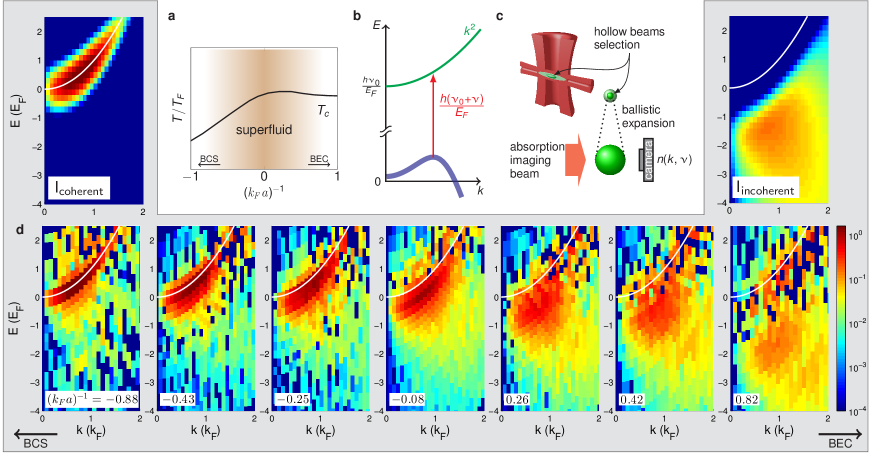
We prepare a gas of atoms in an equal mixture of two spin states, where the scattering length, , that parametrizes the interactions is varied using a Fano-Feshbach scattering resonance Chin et al. (2010) (see Fig. 1a and Supplementary Material PRL ). To eliminate the complications arising from density inhomogeneity, we combine momentum-resolved rf spectroscopy Stewart et al. (2008) (Fig. 1b) with spatially selective imaging that probes only atoms from the trap center where the density is the highest and has the smallest spatial gradients Drake et al. (2012) (Fig. 1c). The lower panel of Fig. 1d shows PES data taken above for several values of , where is the Fermi wave number. The PES signal, , is proportional to , where is the atomic spectral function Stewart et al. (2008); Veillette et al. (2008) and is the Fermi function. Here, and are in units of and , respectively, and we normalize each data set so that the integral over all and equals 1.
The data in Fig. 1d show an evolution from a positively dispersing, quasiparticle-like spectrum to a broad, negatively dispersing spectrum. Previous trap-averaged atom PES data showed back-bending and large energy widths Gaebler et al. (2010); Perali et al. (2011). These features are also apparent in the nearly homogeneous data PRL . However, these data are more amenable to quantitative analysis because (and ) are approximately single-valued across the sample. Similar to the analysis done in electron systems, we use a two-mode function to describe the PES signal Damascelli et al. (2003):
| (1) |
where the first part describes quasiparticles with a positive dispersion, the second part accommodates an “incoherent background” that exhibits negative dispersion, and is the quasiparticle spectral weight. When these two parts (defined below) are combined, the resulting dispersion can exhibit back-bending.
The quasiparticles in Fermi liquid theory are long-lived and therefore give rise to narrow energy peaks, which, in principle, could be directly observed. However, such peaks would be broadened by our experimental resolution of about . This resolution is set by the number of atoms (with scaling only weakly with increasing ) and the rf pulse duration (see Supplementary Material PRL ), which must be short compared to the harmonic trap period in order to probe momentum states. We convolve Eqn. 1 with a Gaussian function that accounts for our energy resolution before fitting to the data in order to determine the spectral weight of the quasiparticles (Fig. 1d, upper panel).
To describe quasiparticles, we use
| (2) |
which consists of a quadratic dispersion of sharp quasiparticles multiplied by a normalized Fermi distribution ( is the Dirac delta function, and is the polylogarithm function). We include as fit parameters, a Hartree shift , effective mass , chemical potential , and temperature . Here, energies are given in units of and in units of . This description of Fermi liquid quasiparticles is typically only used very near and for approaching zero, whereas we fit to data for a larger range in and with temperatures near 0.2 (just above ). The latter is necessitated by the unusually large interaction energy compared to , and we note that 0.2 is still sufficiently cold that one can observe a sharp Fermi surface in momentum Drake et al. (2012). Any increase in quasiparticle widths away from will have little effect on the data as long as the quasiparticles have an energy width less than our energy resolution, which should be the case for long-lived quasiparticles. Finally, using a quadratic dispersion over a large range of is supported by the data PRL .
The second part in Eq. 1 needs to accommodate the remainder of the signal, which is often referred to as an “incoherent background” in a Fermi liquid description. For fermions with contact interactions, one expects an incoherent background at high momentum due to short-range pair correlations Tan (2008); Braaten (2012); Schneider and Randeria (2010). Motivated by this and by the normal state in the BEC limit, we use for a function that describes a thermal gas of pairs. The pairs have a wave function that decays as , where is the relative distance and is the pair size Chin and Julienne (2005), and a Gaussian distribution of center-of-mass kinetic energies characterized by an effective temperature . This gives
| (3) |
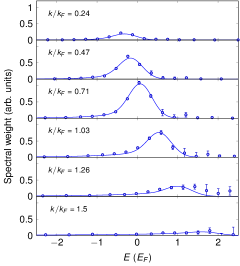
where is the Heaviside step function, is a pairing energy defined by , and both and are dimensionless fitting parameters (see Supplementary Material PRL ). While this description of the incoherent piece may not fully capture the microscopic behavior except in the BEC limit, we find nonetheless that Eq. 1, after convolution with a Gaussian function that accounts for our energy resolution, fits the data very well throughout the crossover. For each value of , we perform a surface fit to the roughly 300 points that comprise the PES data for and . The reduced chi-squared statistic, , after accounting for the seven fit parameters, is between 0.75 and 1.3. An example fit is shown in Fig. 2, where we show several traces at fixed for PES data taken near unitarity.
In Fig. 3a, we show as a function of . For our lowest , ; however, decreases rapidly going from the BCS side of the crossover (negative ) to the BEC side (positive ), reaching at unitarity. Beyond , vanishes, signalling the breakdown of a Fermi liquid description. Restricting the fitting to a smaller region around gives results for that are consistent with the fits to (see Fig. 3a). We note that the interaction strength where vanishes, as well as the sharpness with which goes to zero, are likely to be temperature dependent Doggen and Kinnunen (2014). The best fit values for the effective mass, are shown in Fig. 3b, where increases with increasing interaction strength as expected for a Fermi liquid. A linear fit gives at unitarity, which is somewhat higher than measured in Ref. Nascimbène et al. (2010), but close to the prediction of from Ref. Haussmann et al. (2009). The other fit parameters for the two-mode function are shown in Fig. S4 in Ref. PRL .
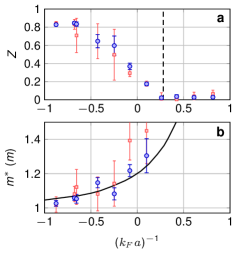
We note an interesting comparison of our results with the Fermi polaron, which is the quasiparticle in the limit of a highly imbalanced Fermi gas. Schirotzek et al. measured for the Fermi polaron at unitarity Schirotzek et al. (2009), which is similar to our result for the balanced Fermi gas. For the polaron case, also goes to zero in a similar fashion to our results, but farther on the BEC side of the crossover Schirotzek et al. (2009). This similarity is surprising because we expect a phase transition from polarons to molecules in the extreme imbalance limit Prokof’ev and Svistunov (2008a, b), with acting as an order parameter Punk et al. (2009), while, in contrast, the balanced Fermi gas should exhibit a continuous crossover. For , we also find that our result is close to the measured effective mass of the Fermi polaron at unitarity Nascimbène et al. (2010), , and similar to the predicted polaron mass Combescot et al. (2009); Navon et al. (2010) throughout our measurement range (solid line in Fig. 3b).
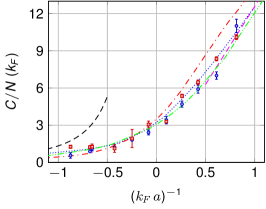
As increases, short-range correlations are expected to increase. This gives rise to increased weight in the high- part of the spectral function Schneider and Randeria (2010), which is quantified by a parameter called the contact Tan (2008); Braaten (2012); Stewart et al. (2010); Sagi et al. (2012). In a Fermi liquid description, the contact must be accounted for by the incoherent part of the spectral function Schneider and Randeria (2010). We note that our particular choice for has the expected form of a high- tail in the momentum distribution Tan (2008) and a large- tail in the rf line shape Braaten (2012), where is the rf detuning. Remarkably, we find that the contact can be accurately extracted from the fits to the PES data even though we restrict the fits to . For comparison, behavior in the momentum distribution was observed for Stewart et al. (2010). In Fig. 4, we plot the measured contact per particle, , in units of , as a function of . The data extend previous measurements of the contact at unitarity Sagi et al. (2012); Kuhnle et al. (2011) and agree well with several theoretical predictions Palestini et al. (2010); Haussmann et al. (2009).
The results presented here can explain how different observations lead to different conclusions regarding the nature of the normal state of the unitary Fermi gas. Although the data here taken just above show that a Fermi liquid description breaks down for , remains finite at unitary. Fermionic quasiparticles may play a key role in thermodynamics, while PES data reveal back-bending and significant spectral weight in an “incoherent” part that is consistent with pairing. With the nearly homogeneous PES data, we find that vanishes surprisingly abruptly and note some similarity to Fermi polaron measurements. Comparing the PES data with various BCS-BEC crossover theories may help elucidate these observations and advance quantitative understanding of the crossover.
Acknowledgements
This work was supported by the National Science Foundation under Grant Number 1125844 and by the National Institute of Standards and Technology.
References
- Landau (1957) L. D. Landau, Sov. Phys. JETP 3, 920 (1957).
- Lifshitz and Pitaevskii (1980) E. Lifshitz and L. P. Pitaevskii, Statistical Physics, Part 2, Landau and Lifshitz Course of Theoretical Physics, Vol. 9 (Butterworth-Heinemann, 1980).
- Hill et al. (2001) R. W. Hill, C. Proust, L. Taillefer, P. Fournier, and R. L. Greene, Nature 414, 711 (2001).
- Regal and Jin (2006) C. A. Regal and D. S. Jin, Adv. Atom. Mol. Opt. Phys. 54, 1 (2006).
- Ketterle and Zwierlein (2008) W. Ketterle and M. W. Zwierlein, in Proceedings of the International School of Physics “Enrico Fermi”, Course CLXIV, edited by M. Inguscio, W. Ketterle, and C. Salomon (IOS Press, Amsterdam, 2008).
- Chen et al. (2005) Q. Chen, J. Stajic, S. Tan, and K. Levin, Phys. Rep. 412, 1 (2005).
- Zwerger (2012) W. Zwerger, ed., The BCS-BEC Crossover and the Unitary Fermi Gas, Lecture Notes in Physics, Vol. XVI (Springer, 2012) p. 532.
- Randeria and Taylor (2014) M. Randeria and E. Taylor, Annu. Rev. Condens. Matter Phys. 5, 209 (2014).
- Nascimbène et al. (2010) S. Nascimbène, N. Navon, K. J. Jiang, F. Chevy, and C. Salomon, Nature 463, 1057 (2010).
- Navon et al. (2010) N. Navon, S. Nascimbène, F. Chevy, and C. Salomon, Science 328, 729 (2010).
- Sommer et al. (2011) A. Sommer, M. Ku, G. Roati, and M. W. Zwierlein, Nature 472, 201 (2011).
- Gaebler et al. (2010) J. P. Gaebler, J. T. Stewart, T. E. Drake, D. S. Jin, A. Perali, P. Pieri, and G. C. Strinati, Nat. Phys. 6, 569 (2010).
- Stewart et al. (2008) J. T. Stewart, J. P. Gaebler, and D. S. Jin, Nature 454, 744 (2008).
- Chen et al. (2009) Q. Chen, Y. He, C.-C. Chien, and K. Levin, Rep. Prog. Phys. 72, 122501 (2009).
- Nascimbène et al. (2011) S. Nascimbène, N. Navon, S. Pilati, F. Chevy, S. Giorgini, A. Georges, and C. Salomon, Phys. Rev. Lett. 106, 215303 (2011).
- Perali et al. (2011) A. Perali, F. Palestini, P. Pieri, G. C. Strinati, J. T. Stewart, J. P. Gaebler, T. E. Drake, and D. S. Jin, Phys. Rev. Lett. 106, 060402 (2011).
- Wulin et al. (2011) D. Wulin, H. Guo, C.-C. Chien, and K. Levin, Phys. Rev. A 83, 061601 (2011).
- Haussmann et al. (2009) R. Haussmann, M. Punk, and W. Zwerger, Phys. Rev. A 80, 063612 (2009).
- Sá de Melo et al. (1993) C. A. R. Sá de Melo, M. Randeria, and J. R. Engelbrecht, Phys. Rev. Lett. 71, 3202 (1993).
- Drake et al. (2012) T. E. Drake, Y. Sagi, R. Paudel, J. T. Stewart, J. P. Gaebler, and D. S. Jin, Phys. Rev. A 86, 031601 (2012).
- Sagi et al. (2012) Y. Sagi, T. E. Drake, R. Paudel, and D. S. Jin, Phys. Rev. Lett. 109, 220402 (2012).
- Chin et al. (2010) C. Chin, R. Grimm, P. Julienne, and E. Tiesinga, Rev. Mod. Phys. 82, 1225 (2010).
- (23) See Supplementary Material (below) for more information regarding methods, comparison to previous data, the form of the quasiparticle dispersion, derivation of the spectral function for pairs, additional fitting parameters, and extracting the contact, which includes Refs. [24-29].
- Regal et al. (2004) C. A. Regal, M. Greiner, and D. S. Jin, Phys. Rev. Lett. 92, 040403 (2004).
- Regal (2006) C. Regal, Experimental realization of BCS-BEC crossover physics with a Fermi gas of atoms, Ph.D. thesis, University of Colorado (2006).
- Magierski et al. (2009) P. Magierski, G. Wlazłowski, A. Bulgac, and J. E. Drut, Phys. Rev. Lett. 103, 210403 (2009).
- Kinnunen (2012) J. J. Kinnunen, Phys. Rev. A 85, 012701 (2012).
- Bruun and Baym (2006) G. M. Bruun and G. Baym, Phys. Rev. A 74, 033623 (2006).
- Braaten et al. (2008) E. Braaten, D. Kang, and L. Platter, Phys. Rev. A 78, 053606 (2008).
- Veillette et al. (2008) M. Veillette, E. G. Moon, A. Lamacraft, L. Radzihovsky, S. Sachdev, and D. E. Sheehy, Phys. Rev. A 78, 033614 (2008).
- Damascelli et al. (2003) A. Damascelli, Z. Hussain, and Z.-X. Shen, Rev. Mod. Phys. 75, 473 (2003).
- Tan (2008) S. Tan, Ann. Phys. 323, 2971 (2008).
- Braaten (2012) E. Braaten, in The BCS-BEC Crossover and the Unitary Fermi Gas, Lecture Notes in Physics, Vol. 836, edited by W. Zwerger (Springer Berlin / Heidelberg, 2012) pp. 193–231.
- Schneider and Randeria (2010) W. Schneider and M. Randeria, Phys. Rev. A 81, 021601 (2010).
- Chin and Julienne (2005) C. Chin and P. S. Julienne, Phys. Rev. A 71, 012713 (2005).
- Doggen and Kinnunen (2014) E. V. H. Doggen and J. J. Kinnunen, ArXiv e-prints (2014), arXiv:1411.7207 [cond-mat.quant-gas] .
- Combescot et al. (2009) R. Combescot, S. Giraud, and X. Leyronas, Europhys. Lett. 88, 60007 (2009).
- Schirotzek et al. (2009) A. Schirotzek, C.-H. Wu, A. Sommer, and M. W. Zwierlein, Phys. Rev. Lett. 102, 230402 (2009).
- Prokof’ev and Svistunov (2008a) N. Prokof’ev and B. Svistunov, Phys. Rev. B 77, 020408 (2008a).
- Prokof’ev and Svistunov (2008b) N. V. Prokof’ev and B. V. Svistunov, Phys. Rev. B 77, 125101 (2008b).
- Punk et al. (2009) M. Punk, P. T. Dumitrescu, and W. Zwerger, Phys. Rev. A 80, 053605 (2009).
- Stewart et al. (2010) J. T. Stewart, J. P. Gaebler, T. E. Drake, and D. S. Jin, Phys. Rev. Lett. 104, 235301 (2010).
- Kuhnle et al. (2011) E. D. Kuhnle, S. Hoinka, P. Dyke, H. Hu, P. Hannaford, and C. J. Vale, Phys. Rev. Lett. 106, 170402 (2011).
- Palestini et al. (2010) F. Palestini, A. Perali, P. Pieri, and G. C. Strinati, Phys. Rev. A 82, 021605 (2010).
See pages 1 of Supplementary_Material_final_arXiv.pdf See pages 2 of Supplementary_Material_final_arXiv.pdf See pages 3 of Supplementary_Material_final_arXiv.pdf See pages 4 of Supplementary_Material_final_arXiv.pdf See pages 5 of Supplementary_Material_final_arXiv.pdf See pages 6 of Supplementary_Material_final_arXiv.pdf See pages 7 of Supplementary_Material_final_arXiv.pdf See pages 8 of Supplementary_Material_final_arXiv.pdf See pages 9 of Supplementary_Material_final_arXiv.pdf See pages 10 of Supplementary_Material_final_arXiv.pdf See pages 11 of Supplementary_Material_final_arXiv.pdf See pages 12 of Supplementary_Material_final_arXiv.pdf See pages 13 of Supplementary_Material_final_arXiv.pdf See pages 14 of Supplementary_Material_final_arXiv.pdf See pages 15 of Supplementary_Material_final_arXiv.pdf