The Relation Between Large-Scale Coronal Propagating Fronts and Type II Radio Bursts
Abstract
Large-scale, wave-like disturbances in extreme-ultraviolet (EUV) and type II radio bursts are often associated with coronal mass ejections (CMEs). Both phenomena may signify shock waves driven by CMEs. Taking EUV full-disk images at an unprecedented cadence, the Atmospheric Imaging Assembly (AIA) onboard the Solar Dynamics Observatory has observed the so-called EIT waves or large-scale coronal propagating fronts (LCPFs) from their early evolution, which coincides with the period when most metric type II bursts occur. This article discusses the relation of LCPFs as captured by AIA with metric type II bursts. We show examples of type II bursts without a clear LCPF and fast LCPFs without a type II burst. Part of the disconnect between the two phenomena may be due to the difficulty in identifying them objectively. Furthermore, it is possible that the individual LCPFs and type II bursts may reflect different physical processes and external factors. In particular, the type II bursts that start at low frequencies and high altitudes tend to accompany an extended arc-shaped feature, which probably represents the 3D structure of the CME and the shock wave around it, rather than its near-surface track, which has usually been identified with EIT waves. This feature expands and propagates toward and beyond the limb. These events may be characterized by stretching of field lines in the radial direction, and be distinct from other LCPFs, which may be explained in terms of sudden lateral expansion of the coronal volume. Neither LCPFs nor type II bursts by themselves serve as necessary conditions for coronal shock waves, but these phenomena may provide useful information on the early evolution of the shock waves in 3D when both are clearly identified in eruptive events.
keywords:
Shock waves; Coronal mass ejections; Solar Dynamics Observatory; Extreme Ultraviolet emission; Radio emission1 Introduction
S-Introduction
Large-scale wave-like disturbances at coronal temperatures are one of the most spectacular phenomena revealed by the Solar and Heliospheric Observatory (SOHO) [Moses et al. (1997), Thompson et al. (1998)]. They were called EUV waves, or EIT waves, after the instrument (Extreme-ultraviolet Imaging Telescope (EIT: Delaboudinière et al., 1995)) that observed them. \inlineciteThompson99 proposed that EIT waves may be the coronal counterpart of chromospheric Moreton–Ramsey waves observed in H Moreton and Ramsey (1960), which had been explained in terms of flare-launched fast-mode magnetohydrodynamic (MHD) shock waves as they were refracted downward Uchida (1968). The same shock waves in the corona have been thought to be responsible for type II radio bursts observed in the metric range (Uchida, 1974; Vršnak et al., 2002, 2006). We therefore expect a good correlation between EIT waves and type II bursts. Indeed, \inlineciteKlassen00 showed that 90 % (19 of 21) of their sample of type II bursts were associated with EIT waves. Note that the fast-mode MHD shock waves have become more commonly attributed to coronal mass ejections (CMEs) than to flares, following several studies that showed close relationships with CMEs of both EIT waves Biesecker et al. (2002); Cliver et al. (2005); Chen (2006) and type II bursts Cliver, Webb, and Howard (1999); Gopalswamy et al. (2001); Cliver et al. (2004).
In contradiction to the interpretation that EIT waves signify fast-mode MHD waves, many of them were found considerably slower (e.g. 200 – 400 km s-1, see Thompson and Myers 2009) than Moreton–Ramsey waves (e.g. 500 – 1200 km s-1, see Warmuth et al., 2004). Alternatively, some authors linked EIT waves with direct manifestations of CMEs. These are called the “non-wave” or “pseudo-wave” interpretations. Numerous articles have been published on the nature of EIT waves (see the latest review by \inlineciteWeiLiu14 and references cited therein including several comprehensive reviews).
In retrospect, the controversy over the nature of EIT waves has been caused largely by inadequate observations of the phenomenon. In particular, the compromised 10 – 20-minute cadence of the EIT created considerable ambiguities as to what should be registered as EIT waves, except for the small number of canonical or “typical” examples with a clear front propagating in almost all directions (e.g. Wills-Davey and Attrill, 2009). In the detailed catalog of EIT waves up to June 1998 as compiled by \inlineciteThompson09, many events were marked with a low confidence level, which often indicated that very few images captured the coronal disturbances. The compromised cadence was also responsible for the lower speed of EIT waves (Long et al., 2008, 2011). Concerning the apparent discrepancy of the speeds of EIT waves and Moreton–Ramsey waves, \inlineciteWarmuth04a showed in the distance–time plots that EIT waves could be seen as an extension of Moreton–Ramsey waves, which experienced deceleration within ten minutes after the onsets. The EIT seldom observed these periods.
The problem of the insufficient image cadence has been drastically ameliorated by the Atmospheric Imaging Assembly (AIA) onboard the Solar Dynamics Observatory, which was launched in February 2010. Thanks to the unprecedented 12-second regular cadence of EUV full disk images, we now can trace the large-scale wave-like disturbances as soon as they are launched. Here we call them large-scale coronal propagating fronts (LCPFs) as did \inlineciteNitta13a, remembering that both fast-mode MHD waves and CME-related features could contribute to the propagating front especially during the early evolution (Schrijver et al., 2011; Downs et al., 2011). Shock waves may be present at the flanks of the CMEs more likely in the early phase of LCPFs than later, when LCPFs would be identified with freely propagating MHD waves. Observations of LCPFs in the early phase, which usually coincides with the occurrence of the metric type II burst (Gopalswamy et al., 2009, 2013), should give us a better insight into how shock waves are driven in the CME processes. Many LCPFs in this phase were found to be much faster than EIT waves, with an average speed of 600 km s-1 Nitta et al. (2013a), although a small number of LCPFs were intrinsically slow (e.g. 300 km s-1). In contrast to the recent work to group EIT waves into different origins on the basis of their kinematic behaviors Warmuth and Mann (2011), faster (slower) LCPFs do not necessarily decelerate (accelerate) as revealed by AIA observations, which contain much faster LCPFs than EIT waves Nitta et al. (2013a).
The main purpose of the present article is to revisit the relation of LCPFs with type II bursts. This is intended as a first step toward determining when and where shock waves form in solar eruptions (e.g. Gopalswamy et al., 2013), which may have an important consequence in our understanding of the temporal and spatial properties of solar energetic particle events (e.g. Rouillard et al., 2012). To study the association of LCPFs with type II bursts, we examine radio dynamic spectra rather than relying on the NOAA event lists111Annual lists of metric radio bursts at ftp://ftp.ngdc.noaa.gov/STP/space-weather/solar-data/solar-features/solar-radio/radio-bursts/reports/spectral-listings/ until January 2011 and daily event lists thereafter at www.swpc.noaa.gov/ftpmenu/warehouse.html., which have served as the reference in several statistical studies in the past. In Section 2, we recapitulate the basic results on LCPFs and their association with type II bursts as presented in the ensemble study by \inlineciteNitta13a. Section 3 gives examples of type II bursts without a clear LCPF and fast LCPFs without a reported type II burst. This section raises the question of how objectively the two phenomena can be identified in the data. In Section 4 we study the height of the CME at the type II onset and the starting frequency of the type II burst, with an emphasis on type II bursts that start at low frequencies and high altitudes. Section 5 discusses the implications of our findings, and a summary is given in Section 6.
2 Overview of the Relation between LCPFs and Type II Bursts
Overview
In \inlineciteNitta13a, a total of 171 LCPFs were manually isolated in AIA data taken during April 2010 – January 2013. In the absence of a universal definition of the EIT wave beyond “the outermost propagating intensity front reaching global scales” Patsourakos and Vourlidas (2012), our working definition of the LCPF was that it had an angular expanse of 45∘ and propagated at least 200 Mm away from the center of the associated eruption or flare. The events are archived at aia.lmsal.com/AIA˙Waves, which was created as a side product of that publication. This was not meant to be a complete list of events, which would be more objectively produced by automated detection algorithms (e.g. Long et al., 2014). Nevertheless, the web site contains extensive movies and is periodically updated, providing a useful resource to workers on solar eruptions and related topics.
As was often the case with past works on EIT waves (e.g. Thompson and Myers, 2009), \inlineciteNitta13a concentrated on the events with an arc-shaped front propagating on the solar disk in AIA images. There were 138 events in this category. In other events, the front was either seen to propagate almost exclusively along the limb (22 events) or too diffuse to trace accurately (11 events). All the events propagating along the limb as viewed from Earth satisfied the above working definition of the LCPF in data from the EUV Imager (EUVI: Wuelser et al., 2004; Howard et al., 2008) on the Solar and Terrestrial Relations Observatory (STEREO) sampled at a 2.5 – 5-minute cadence. The apparent speed of the front was measured from the eruption center along the great circle, averaged over the 15∘-wide longitudinal sectors. This was to take into account the spherical shape of the surface of the Sun. The zero height from the photosphere was assumed. \inlineciteWeiLiu14 showed that the error from this assumption may be negligible on the disk or if the height of the front does not significantly change from what has often been cited (see below). The measurement was made until the front reached discontinuities such as coronal holes and active regions, where it was usually deflected (e.g. Gopalswamy et al., 2009; Olmedo et al., 2012); it was difficult to trace the same front after that point. The sector that both showed a clear front and yielded the highest speed was recorded, and the speed of the front in that sector was entered as the speed of the event. For regions close to the limb, the sectors toward the limb were excluded because foreshortening would seriously impact the measurement accuracy. It is also possible that an extended arc-shaped feature moving toward and beyond the limb may represent the 3D extent of the CME and the shock wave around it (see Subsection 3.1 and Section 4). This is different from what has usually been conceived as an EIT wave, which is essentially a near-surface phenomenon. See \inlinecitePatsourakos09 and \inlineciteKienreich09 for the height measurement of the front, yielding the range of 0.1 – 0.2 R from the surface.
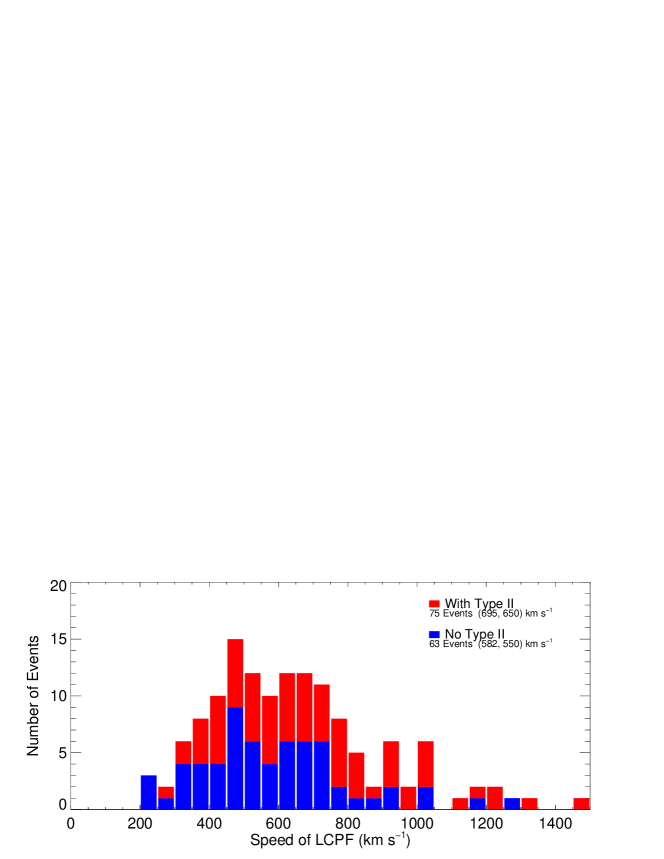
The distribution of the speed of the 138 LCPFs is given in Figure 1, plotted separately for those associated (55 %) and not associated (45 %) with a type II burst on the basis of the NOAA lists. We first confirm that many LCPFs are as fast as typical Moreton–Ramsey waves although a small number of slow ( 300 km s-1) fronts exist. Additionally, we have not seen super-fast (e.g. 2000 km s-1) events, which were predicted on the basis of Solar Cycle 23 ground-level-enhancement (GLE) particle events Nitta et al. (2012). This may be related with the generally weak solar activity of Cycle 24 (e.g. Gopalswamy et al., 2014). Fast LCPFs tend to be associated with a type II burst but many are not. Conversely, many slow LCPFs are associated with a type II burst. Concerning the association in the opposite direction, out of the 141 type II bursts included in the NOAA lists during the same period, 85 (60 %) were associated with a clear LCPF including those that propagate primarily along the limb with negligible presence on the disk as seen in AIA data. Most of the remaining type II bursts are associated with eruptive signatures, if not as extended as LCPFs.
LCPFs are often thought to result from sudden lateral expansion of the CME volume Patsourakos and Vourlidas (2012), whereas CMEs are considered to represent expulsion of coronal structures primarily in the radial direction. A subset of 86 LCPFs were observed as limb events by either or both of the twin STEREO spacecraft (“B” for Behind, and “A” for Ahead of the Sun–Earth line), allowing us to measure the speed of the associated CMEs without serious projection effect. Moreover, the STEREO carries the COR-1 coronagraph Howard et al. (2008), which observes the corona in the heliocentric distance of (1.4 – 4.0)R at a typical cadence of 2.5 – 5 minutes. Therefore the CME kinematic information calculated from the COR-1 data may be readily comparable with LCPFs.
Figure 2 shows the CME speed against the LCPF speed for the 86 events, again plotted separately for those associated and not associated with a type II burst. This plot suggests the existence of two classes of events, depending on whether the lateral expansion (LCPF) is faster than the radial expansion (CME). Type II bursts may be associated with LCPFs irrespective of which speed is higher. As was the case with LCPFs, fast CMEs tend to be associated with a type II burst, but again several of them are not. A handful of type II bursts are observed when both the associated LCPF and CME are slow (e.g. 600 km s-1). \inlineciteNitta13a suggested that neither nor may be a deciding factor for the LCPF to be associated with a type II burst.
3 Revisiting the Relation between LCPFs and Type II Bursts
Main section
Type II bursts, identified with slowly drifting narrow-band features in radio dynamic spectra, have long been known as a good indicator of MHD shock waves produced by solar eruptions (e.g. Nelson and Melrose, 1985; Gopalswamy, 2000). Previous statistical studies of type II bursts often relied on the NOAA lists, but we choose to examine the dynamic spectra and to understand what they objectively tell us. Unlike modern spacecraft data of the Sun, radio dynamic spectra produced by ground-based observatories had not been easily accessible apart from pre-scaled graphic files. However, the dynamic spectra obtained at the US Air Force Radio Solar Telescope Network (RSTN) sites have been archived as raw data and made available through the National Geophysical Data Center since the early 2000s. The daily files are presently downloadable at www.ngdc.noaa.gov/stp/space-weather/solar-data/solar-features/solar-radio/rstn-spectral/. Note that the archive is not perfect, and data of some well-known type II bursts are missing. In addition, some useful information on the RSTN dynamic spectra is available in ftp://ftp.ngdc.noaa.gov/STP/space-weather/solar-data/solar-features/solar-radio/rstn-spectral/docs/SRSData.ppt.
We study the RSTN dynamic spectra for almost all the type II bursts included in the NOAA lists during April 2010 – January 2013, and for all the LCPFs in the same period as analyzed by \inlineciteNitta13a. Although the frequency range of the RSTN dynamic spectra is limited to 180 – 25 MHz, there is a unique advantage of around-the-clock coverage, which is made possible by the four RSTN sites in Canada, Australia, Hawaii, and Italy. Many type II bursts are observed at more than one RSTN site, allowing us to evaluate the consistency of the spectra.
As shown in Subsection 3.2 and Section 4, it is not always easy to find a type II burst objectively in the dynamic spectrum, partly because of other bursts or non-solar features including interference. Furthermore, the real dynamic spectra rarely show clear and isolated lanes of fundamental and harmonic emissions. Indeed, we could not confidently confirm all the type II bursts in the NOAA lists, and yet it was also difficult to rule out the slowly drifting features possibly undermined by the ongoing type III or IV bursts. In other words, we accept all the type II bursts in the NOAA lists, except for a few cases that correspond to no radio bursts of any kind, because of obvious typographic errors. Certain type II bursts may show greater presence above 200 MHz or below 30 MHz. They may be left out in the NOAA lists (S. M. White, 2013, 2014, private communication). Here we have not taken extra steps to find additional type II bursts outside the RSTN spectra, but when there is ambiguity about the presence of a type II burst in the RSTN data we access the radio dynamic spectra as provided by other observatories, including Greenbank and BIRS (www.astro.umd.edu/~white/gb/index.shtml), Nançay (secchirh.obspm.fr/select.php), Hiraiso (sunbase.nict.go.jp/solar/denpa/index.html), IZMIRAN (www.izmiran.ru/stp/lars/), and e-Callisto (e-callisto.org/).
Because our immediate goal is to find the trend and range of the relation between LCPFs and type II bursts, study of sub-features of type II bursts such as herringbones and band splits (e.g. Nelson and Melrose, 1985; Carley et al., 2013), although important, is outside the scope of this work. We also do not make use of radio imaging observations. During the period of interest, they have been limited to the frequencies above 150 MHz, and there is almost no direct overlap with the type II bursts observed at RSTN.
3.1 Type II Bursts Not Associated With a Clear LCPF
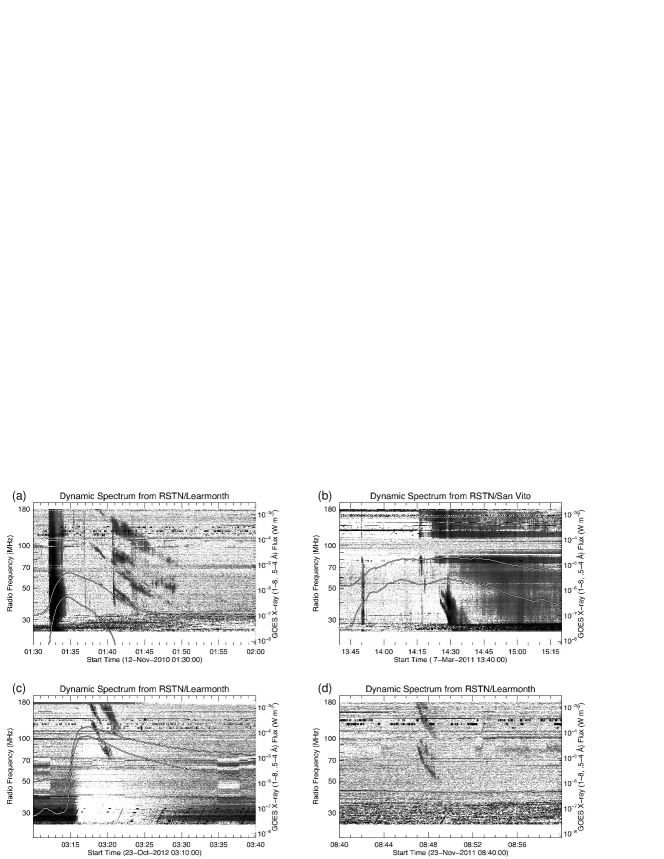
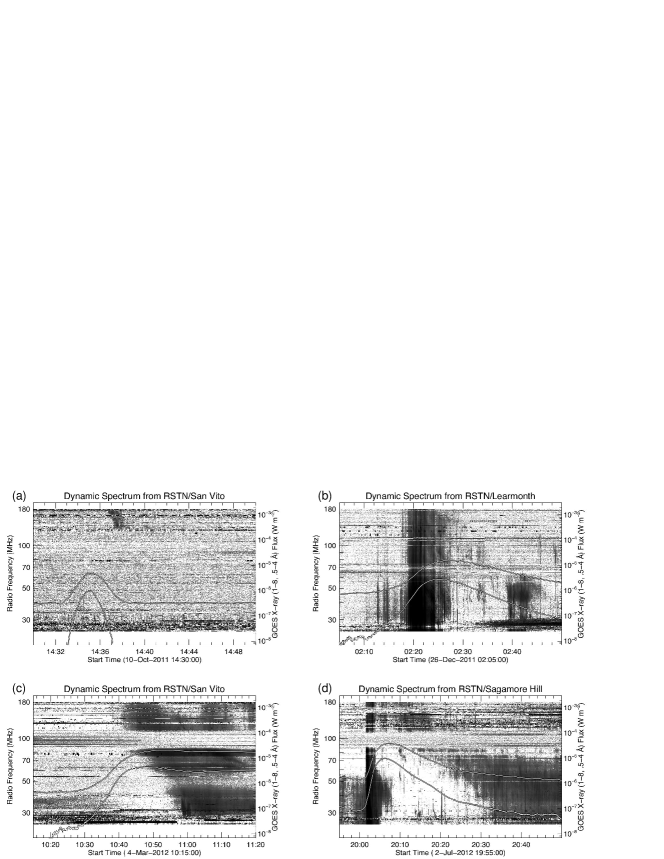
Figure 3 shows dynamic spectra of four events in this category. In this figure as well as Figures 6 (in Subsection 3.2) and 8 (in Seciton 4), the spectra are displayed in negative with a fixed scaling that we found was good to bring up weak signals. The GOES X-ray light curves are also included in the plots. In Figure 3a we note a clear type II burst consisting of four lanes that correspond to two fundamental–harmonic pairs. They are preceded by strong type III bursts during the rising phase of a short-lived C-class flare. In Figure 3b, the type II burst may be only barely seen at low frequencies between 14:25 and 14:35 UT; the dynamic spectrum is dominated by a broad-band type IV burst. Most features in the dynamic spectrum started with the second episode of the long-duration M1.9 flare. The type II burst in Figure 3c is associated with an X1.8 flare. It is band-split, and the starting frequency in the upper fundamental track seems to be above the RSTN range. In Figure 3d the type II burst is very short-lived and no X-ray flare is registered as the GOES X-ray light curves remain flat.
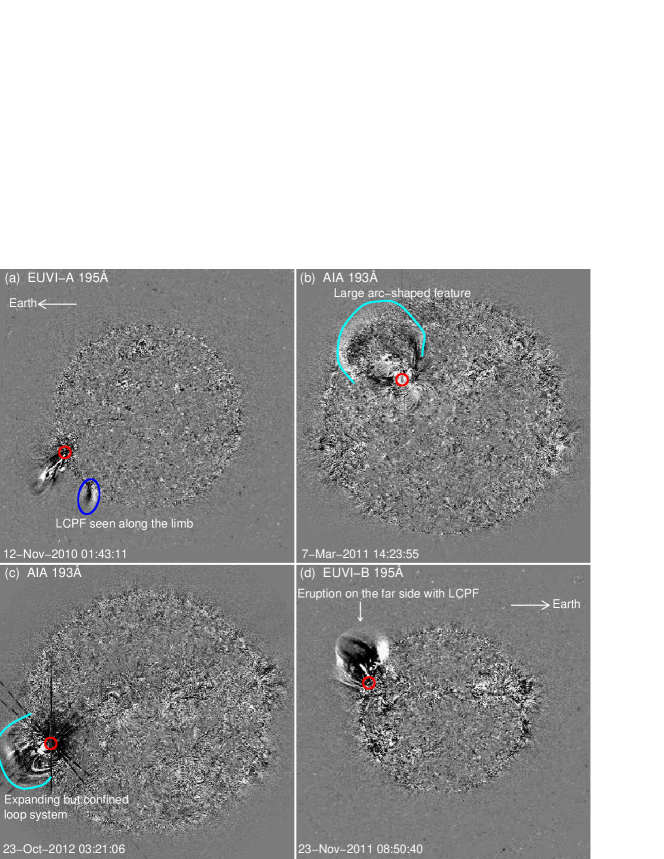
In Figures 4a – d we show solar images around the times of the four type II bursts in Figures 3a – d. They are EUV difference images from the AIA (193 Å) and EUVI (195 Å). The temporal differences of these images are 144 seconds for AIA and 150 or 300 seconds for EUVI. The associated flares are encircled in red.
The type II burst in Figure 3a is associated with a minor filament eruption but not with a clear LCPF in AIA images. We show in Figure 4a an image from the EUVI on STEREO-A (EUVI-A), which gives a limb view of the event. At the 150-second cadence, EUVI-A images captured a propagating front along the limb (counterclockwise). Encircled in blue is the feature that corresponds to the front during the type II burst. This is an example that indicates that a LCPF can be more difficult to observe on the disk than along the limb.
The image in Figure 4b is dominated by a large arc-shaped feature (traced in cyan), which is seen to expand and to propagate toward and beyond the northeast limb. This likely represents the 3D structure of the CME and the shock wave around it, rather than its near-surface track, which has usually been linked with an EIT wave. This event was actually included in \inlineciteNitta13a, because there was a diffuse front that could be traced toward north before the arc-shaped feature became prominent, which coincided with the onset of the type II burst. The speed of the diffuse front was only 300 km s-1. The difficulty of tracing the diffuse front, especially after the arc-shaped feature started to dominate, puts this event in the “no clear LCPF” category. In Section 4, we show more events that are similar.
In Figure 4c the expanding loop system is indicated in cyan, but unlike the arc-shaped feature in Figure 4b, it becomes too diffuse to follow at a certain distance. Data from the EUVI-B, from which the flare was W63, show the same pattern. This event may therefore be a confined ejection. As expected, there was no associated CME. Moreover, there was no front propagating along the limb in either AIA or EUVI-B data. This is another example of a type II burst that starts at a high frequency and has no associated CME (cf. Magdalenić et al., 2012).
Figure 4d is an EUVI 195 Å difference image taken just after the short-lived type II burst in Figure 3d. It is clear that the type II burst was associated with an eruption on the far side as was captured in EUVI-B images at the 300-second cadence. Based on the EUVI 195 Å flux, the eruption was likely associated with an M-class flare if observed by the GOES X-ray Sensor (XRS) (see Nitta et al., 2013b for the EUVI–XRS flux relation). The type II burst was seen only when the associated shock wave became visible from Earth and was located at the right range of density for the RSTN frequencies.
3.2 Fast LCPFs Not Associated With a Type II Burst
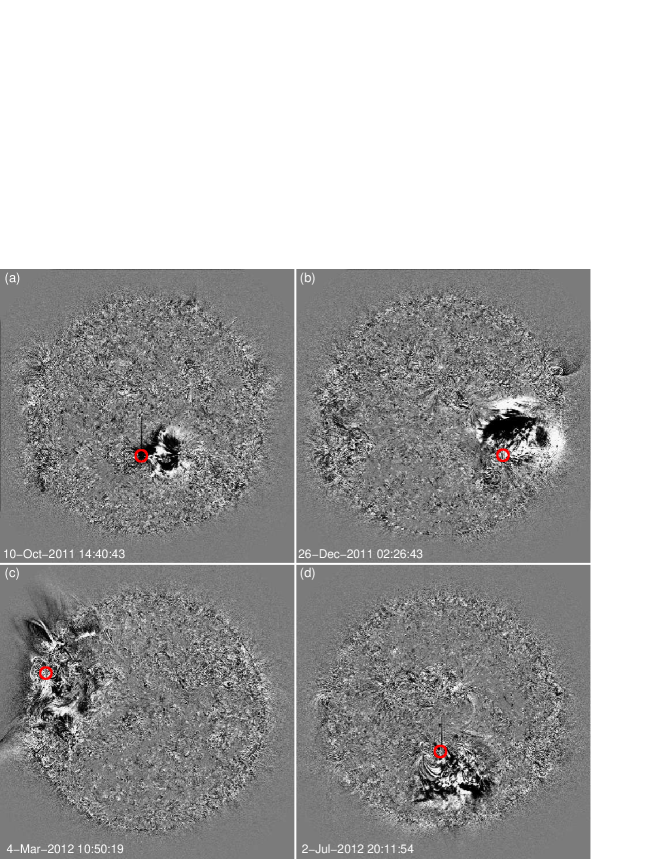
We tend to link faster LCPFs with shock waves and hence expect a more frequent association with type II bursts. Indeed, such a trend is seen in Figure 1, but it is not strong. For example, 8 LCPFs are faster than 800 km s-1 and not associated with a type II burst, according to the NOAA lists. In Figure 5, we show AIA 193 Å difference images of four of them.
The LCPF in Figure 5a was associated with a short-duration C-class flare, and with a marginal CME in COR-1 data viewed as a limb event. Nevertheless, it was a clear LCPF up to 320 Mm from the flare center. The LCPF in Figure 5b was produced by a more energetic eruption which was associated with a wide (angular width 130∘) CME as observed by the Large Angle Spectroscopic Coronagraph (LASCO) on SOHO. The LCPF in Figure 5c, occurring close to the limb, looked even more spectacular. In addition to the slow ( 300 km s-1) fronts along the limb, both clockwise and counterclockwise, a fast front was seen to propagate on the disk. The eruption that produced this LCPF was associated a fast ( 1300 km s-1) full halo CME observed by LASCO. It was also accompanied by quasi-periodic fast propagating (QFP) wave trains (e.g. Liu et al., 2012), which may be one of the signatures to indicate more energetic eruptions. The LCPF in Figure 5d came from an extensive filament eruption that resulted in the reformation of a large area in the south polar region. It was associated with a wide ( 145∘) CME.
The dynamic spectra and X-ray light curves of the four events in Figure 5 are shown in Figure 6. The dynamic spectrum of Figure 6a shows almost nothing, but we note a short-lived (14:37 – 14:38) feature above 130 MHz. This may be a small type II burst. The spectra of Figures 6b – d are dominated by other types of bursts: type III burst in Figure 6b, type IV burst in Figure 6c and both type III and type IV bursts in Figure 6d. It is difficult to find a slowly drifting narrow-band feature in these spectra, but we also cannot convincingly rule out the possibility that it may exist behind the dominant features. Complex spectra of this kind are characteristic of energetic eruptions that are associated with GLEs Gopalswamy et al. (2012b); Nitta et al. (2012). Accordingly, we may not be able to conclude that any of these four examples lack a type II burst. In fact, the confidence level of a type II burst may not be much higher in many energetic events that are associated with a type II burst as included in the NOAA lists.
4 CME Height at the Onset of Type II Bursts and Different Kinds of LCPFs
In this section, we study where the shock wave forms by measuring the height of the CME when the type II burst starts. We may safely assume that the stand-off distance of the shock wave from the CME is still small at its genesis. \inlineciteGopalswamy13 used two methods to study the height of shock formation, namely i) direct measurement of the CME viewed near the limb (to minimize projection effect), and ii) the so-called wave diameter method, where the outer edge of the LCPF on the disk was fitted to a circle and the radius of the circle was equated with the height of the CME shock, assuming spherical geometry. Here we exclusively use method i) as applied to data from STEREO (EUVI and COR-1), which observed the CMEs as limb events (see Figure 2). Out of the 86 LCPFs included in Figure 2, 42 are associated with a type II burst as included in the NOAA lists. A further advantage of this method is an overlap of fields of view of the EUVI and COR-1, which is not the case with the AIA and LASCO. Moreover, we can study the dynamic evolution of the LCPFs on the solar disk better with AIA than with EUVI because of the higher cadence.

We expect the shock formation height to inversely correlate with the starting frequency of the type II burst, reflecting the decreasing density of the solar corona with height. It appears that the frequency range shown in the NOAA lists is sometimes different from what we see in the dynamic spectrum. Therefore we re-evaluate the RSTN spectra to obtain independent ranges of time and frequency (fundamental) of the type II bursts, as in Table 1 for the four events discussed below. We assume that a slowly drifting feature in the dynamic spectrum corresponds to the harmonic if no emission is observed at about twice the frequency. As a result, our frequency range tends to be lower than that reported in the NOAA lists, especially when the latter does not cover the full RSTN range (180 – 25 MHz).
Figure 7 plots the starting frequency against the starting height of type II bursts. As expected, we immediately note a trend that type II bursts that start at low altitudes have high starting frequencies. Many start below the height (heliocentric) of 1.5 R, and a smaller number of type II bursts start around 2 R. This is basically consistent with the recent results by \inlineciteGopalswamy13. The difference as reflected in the fits may partly come from their primary use of the wave diameter method and their inclusion of events with high starting frequencies; here we exclude the 13 February 2013 event, whose starting frequency was well above the RSTN range. In Figure 7 we count nine type II bursts whose starting height are 1.7 R and starting frequencies 60 MHz. The plot suggests that they may represent a different class of events reflecting different physical processes and external conditions. The event shown in Figures 3b and 4b is one of them.
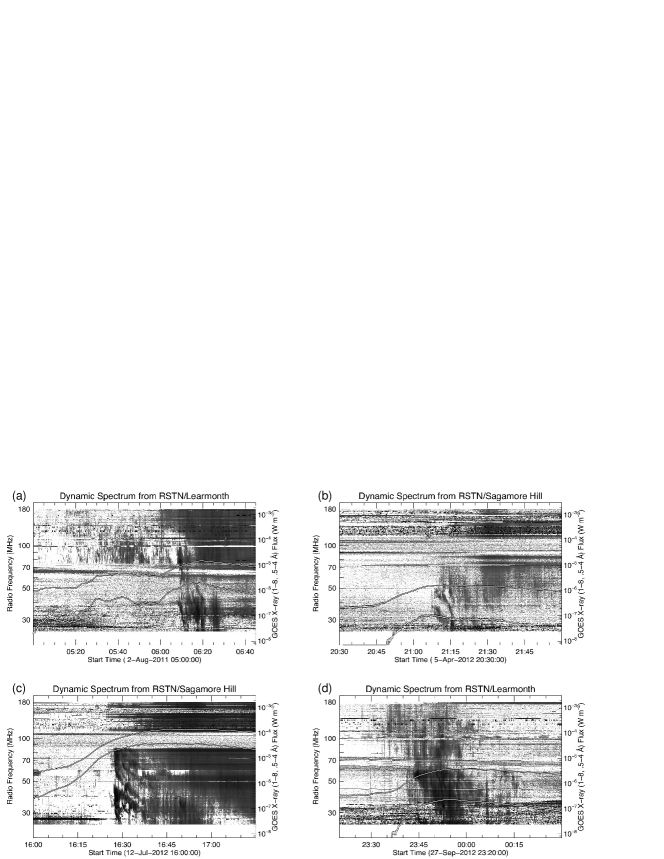
| Range of1 | Range of1 | Range of2 | Range of2 | ||
|---|---|---|---|---|---|
| Date | Time | Station | Frequency | Time | Frequency |
| 2 Aug 2011 | 06:08 – 06:22 | CUL | 90 – 23 | 06:08 – 06:26 | 39 – 15 |
| 5 Apr 2012 | 21:08 – 21:16 | PAL | 43 – 25 | 21:08 – 21:15 | 23 – 19 |
| 12 Jul 2012 | 16:25 – 16:53 | SAG | 82 – 25 | 16:28 – 16:40 | 43 – 25 |
| 27 Sep 2012 | 23:44 – 23:54 | CUL | 60 – 27 | 23:43 – 23:53 | 29 – 17 |
1: From the NOAA lists. 2: From our analysis.
We discuss four of these nine events, which are indicated by filled circles in Figure 7. Figure 8 shows their dynamic spectra with soft X-ray light curves. We note that none of them are short-duration flares. As in some of the spectra shown in Figures 3 and 6, the type II-like feature may not be objectively located. Nonetheless, Table 1 indicated that we choose essentially the same intervals as the RSTN observers. The difference in the frequency range may likely come from whether the given feature is interpreted to be either a fundamental or harmonic emission.
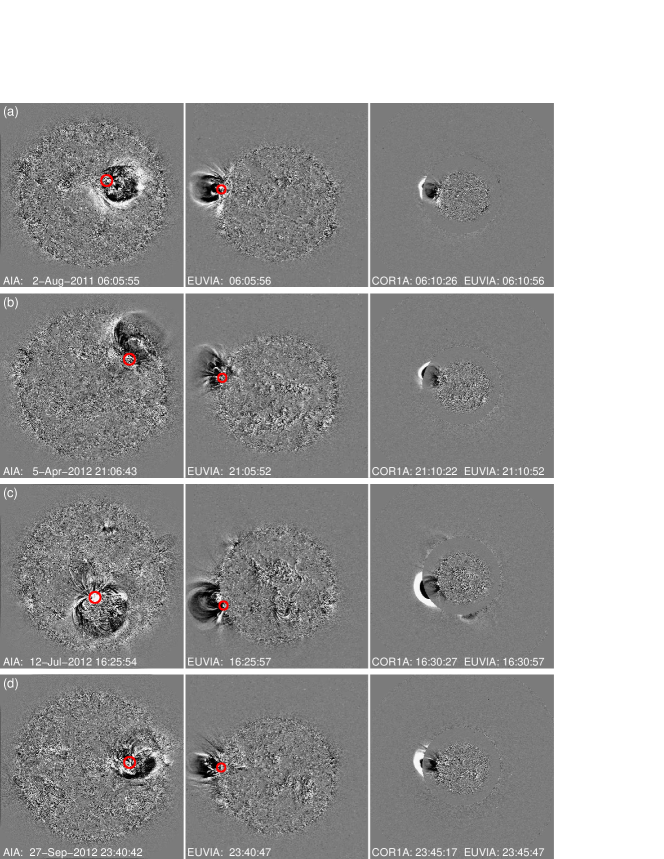
In Figure 9, we show images taken around the onsets of these four events. As in Figure 4b, a large arc-shaped feature is present in each event, and it is seen in movies to expand and to propagate toward and beyond the limb. This indicates that these features may not be the near-surface track of the coronal shock wave. Instead, they are probably the 3D structure of the CME and the shock wave around it. The middle and right panels give the limb view of these fronts, indicating that the arc-shaped feature on the disk corresponds to the height structure of the CME. In this type of event, it seems that the radial motions dominate over the lateral motions. In Figure 2, we set aside these nine type II bursts that start at low frequencies and high altitudes. They tend to have . However, other events also fall in this category. The lack of clear grouping may partly come from inadequate measurements of the speeds of the CMEs and LCPFs. They are average speeds, not capturing, for example, the impulsive acceleration of CMEs close to the Sun (e.g. Bein et al. 2011). In addition, the LCPF generally precedes the CME, meaning that the speeds are not measured simultaneously.
5 Discussion
The initial motivation of this work was to understand the reason for the modest (50 – 60 %) association of LCPFs with type II bursts Nitta et al. (2013a). In particular, we ask why the association does not depend strongly on . Are there different types of LCPFs and type II bursts? To complicate the issue, we first point out that the association of LCPFs with type II bursts may not only depend on their properties. It may also depend on the presence of a previous CME, which can have the effect of lowering the fast-mode speed of the corona in which the next CME is injected. In such a “preconditioned” corona, a shock wave can more easily form for the same driver (CME) speed Yashiro et al. (2014). This is an interesting idea that needs to be validated using a larger sample of events.
We note that past statistical studies of type II bursts had often relied on the NOAA lists and the information contained therein. On the other hand, the RSTN dynamic spectra have been available as raw data since the early 2000s, making it possible for us to analyze them and to extract more information than given in the NOAA lists. We immediately realize that type II bursts may not be objectively identified in dynamic spectra. We rarely find a clear fundamental-harmonic emission pair, and type III and IV bursts may occur around the same time especially in large events. Even when we have a clear type II burst, its association with a LCPF depends on the frequency range in which it is observed. Even within the limited RSTN frequency range, those start at higher frequencies may not involve a LCPF or CME (e.g. the event shown in Figures 3c and 4c), similar to the type II bursts studied by \inlineciteMagdalenic12. There are also a number of type II bursts that start below 30 MHz and are not included in the NOAA lists. They are often not associated with a CME, flare, or LCPF.
We experience similar difficulties with identifying LCPFs. We look in AIA data for signatures similar to what researchers have considered as EIT waves, namely an arc-shaped front propagating a large distance and in a wide angular extent. This excludes smaller events (e.g. Zheng et al., 2011), but the distinction could be arbitrary. Moreover, LCPFs are sometimes too diffuse to detect on the disk. The same event can be better seen to propagate along the limb if viewed from the side (or close to the limb) as is the case for the event given in Figures 3a and 4a. Some LCPFs that are seen to propagate along the limb also manifest on the disk (e.g. the event in Figures 5c and 6c). They are probably more energetic events with greater East–West extensions.
AIA has revealed the propagation of an arc-shaped feature from the solar disk toward and beyond the limb, which should be considered to be the 3D structure of the CME and shock wave rather than only their near-surface tracks. This pattern appears to be characteristic of type II bursts that start at low frequencies and high altitudes. The height of shock formation should closely reflect the height dependence of the CME speed and the fast-mode speed. The large arc-shaped feature in these events seems to expand more radially than laterally, and the associated near-surface feature is slow and diffuse. This reminds us of the scenario proposed by \inlinecitePFChen02, in which EIT waves as near-surface phenomena are dictated by stretching of field lines in the radial direction, resulting in Chen et al. (2002). The concept is aligned with the so-called standard model of eruptive flares due to magnetic reconnection in 2D (or 2.5D) settings. However, this type of LCPFs is a minority and other LCPFs seem to be driven by lateral expansion Patsourakos and Vourlidas (2012), which may not be naturally incorporated in the standard model. Note that the standard model has occasionally been applied to conflicting or at least ambiguous observations (e.g. Nitta, Freeland, and Liu, 2010), a tendency that needs to be corrected in advanced observations. It is possible that these “fat” CMEs due to lateral expansion may need different mechanisms from those that are already part of the standard model and applicable to “tall” CMEs dominated by radial expansion.
From the perspective of studying coronal shock waves due to solar eruptions, it is more productive to consider the 3D structure of the CME rather than to stick to the strict definition of LCPFs or EIT waves as the manifestations close to the surface. Following an example from EIT Chen (2009), a dome-like feature was observed by EUVI Veronig et al. (2010). A shock wave likely forms ahead of the CME, which more often appears off the limb (see the 13 June 2010 event studied by Kozarev et al., 2011; Ma et al., 2011; Gopalswamy et al., 2012a). The shock wave initially propagated faster at the nose than at the flanks, which corresponds to what were conceived as EIT waves. The observed kinematic behaviors have been partially reproduced in theory and models (Zhao et al., 2011; Grechnev et al., 2011; Temmer, Vrsnak, and Veronig, 2013) of the 17 January 2010 event reported by \inlineciteVeronig10. For the 13 June 2010 event, \inlineciteKouloumvakos14 concluded that both the nose and flank of the CME drove the shock. In a major eruptive event on 22 September 2011, \inlineciteCarley13 presented radio-imaging observations that located the shock wave on one of the flanks. Future observations may test whether the shock wave is driven primarily in the radial direction for type II bursts that start at low frequencies and high altitudes.
Although every type II burst is associated with a shock wave, not all of the shocks manifest as a type II burst Gopalswamy et al. (2010), partly because acceleration of electrons responsible for type II bursts may depend on the shock conditions. Based on \inlineciteNitta13a and confirmed in this study, LCPFs do not serve as a necessary condition for the coronal shock wave because not all type II bursts are associated with LCPFs. However, when both of the phenomena are observed in a given event, they provide information on when and where the shock wave forms. This is important for understanding the initial evolution of SEP events Rouillard et al. (2012). In a future work we will derive thermal properties of the LCPFs from AIA multi-channel data to understand how is related to the shock wave and why Moreton–Ramsey waves are so rare (only two published and possibly two more, A. Asai, 2014, private communication) in comparison with type II bursts and LCPFs.
6 Summary
S-Summary
We have studied the relation between LCPFs and type II bursts, by examining the RSTN dynamic spectra for the periods of almost all of them during April 2010 – January 2013. Apart from the difficulty of isolating them objectively and the source regions being far behind the limb, there are certainly type II bursts that do not accompany LCPFs, notably when they are seen primarily at high (200 MHz) or low (30 MHz) frequencies. When both phenomena are observed in a given eruptive event, they can be used to study when and where the shock wave forms. Based on AIA data in combination of STEREO EUVI and COR-1 data, the arc-shaped propagating fronts can embrace the 3D structures of nascent CMEs rather than just their near-surface tracks, which have usually been identified with EIT waves. Those fronts moving toward and beyond the limb are characteristic of type II bursts that start at low frequencies and high altitudes. In these events, expansion in the radial direction dominates, unlike other typical LCPFs where lateral expansion is essential, and this may affect the location of the shock waves that are responsible for type II bursts. This idea may be tested in future radio-imaging observations below 100 MHz. Moreover, it may be important to distinguish CMEs or eruptions (not necessarily detected by coronagraphs) that are initially dominated by radial or lateral expansions for theory or models to contribute to reliable space weather predictions.
Acknowledgements
This work has been supported by the NSF grant AGS-1259549, NASA AIA contract NNG04EA00C and the NASA STEREO mission under NRL Contract No. N00173-02-C-2035. NASA grant NNX11AO68G supported the work of WL. The work of NG and SY was supported by the NASA LWS TR&T program.
References
- Bein et al. (2011) Bein, B.M., Berkebile-Stoiser, S., Veronig, A.M., Temmer, M., Muhr, N., Kienreich, I., Utz, D., Vršnak, B.: 2011, Impulsive Acceleration of Coronal Mass Ejections. I. Statistics and Coronal Mass Ejection Source Region Characteristics. ApJ 738, 191. DOI. ADS.
- Biesecker et al. (2002) Biesecker, D.A., Myers, D.C., Thompson, B.J., Hammer, D.M., Vourlidas, A.: 2002, Solar Phenomena Associated with “EIT Waves”. ApJ 569, 1009. DOI. ADS.
- Carley et al. (2013) Carley, E.P., Long, D.M., Byrne, J.P., Zucca, P., Bloomfield, D.S., McCauley, J., Gallagher, P.T.: 2013, Quasiperiodic acceleration of electrons by a plasmoid-driven shock in the solar atmosphere. Nature Physics 9, 811. DOI. ADS.
- Chen (2006) Chen, P.F.: 2006, The Relation between EIT Waves and Solar Flares. ApJ 641, L153. DOI. ADS.
- Chen (2009) Chen, P.F.: 2009, The Relation Between EIT Waves and Coronal Mass Ejections. ApJ 698, L112. DOI. ADS.
- Chen et al. (2002) Chen, P.F., Wu, S.T., Shibata, K., Fang, C.: 2002, Evidence of EIT and Moreton Waves in Numerical Simulations. ApJ 572, L99. DOI. ADS.
- Cliver, Webb, and Howard (1999) Cliver, E.W., Webb, D.F., Howard, R.A.: 1999, On the origin of solar metric type II bursts. Sol. Phys. 187, 89. DOI. ADS.
- Cliver et al. (2004) Cliver, E.W., Nitta, N.V., Thompson, B.J., Zhang, J.: 2004, Coronal Shocks of November 1997 Revisited: The Cme Type II Timing Problem. Sol. Phys. 225, 105. DOI. ADS.
- Cliver et al. (2005) Cliver, E.W., Laurenza, M., Storini, M., Thompson, B.J.: 2005, On the Origins of Solar EIT Waves. ApJ 631, 604. DOI. ADS.
- Delaboudinière et al. (1995) Delaboudinière, J.-P., Artzner, G.E., Brunaud, J., Gabriel, A.H., Hochedez, J.F., Millier, F., Song, X.Y., Au, B., Dere, K.P., Howard, R.A., Kreplin, R., Michels, D.J., Moses, J.D., Defise, J.M., Jamar, C., Rochus, P., Chauvineau, J.P., Marioge, J.P., Catura, R.C., Lemen, J.R., Shing, L., Stern, R.A., Gurman, J.B., Neupert, W.M., Maucherat, A., Clette, F., Cugnon, P., van Dessel, E.L.: 1995, EIT: Extreme-Ultraviolet Imaging Telescope for the SOHO Mission. Sol. Phys. 162, 291. DOI. ADS.
- Downs et al. (2011) Downs, C., Roussev, I.I., van der Holst, B., Lugaz, N., Sokolov, I.V., Gombosi, T.I.: 2011, Studying Extreme Ultraviolet Wave Transients with a Digital Laboratory: Direct Comparison of Extreme Ultraviolet Wave Observations to Global Magnetohydrodynamic Simulations. ApJ 728, 2. DOI. ADS.
- Gopalswamy (2000) Gopalswamy, N.: 2000, Type II Solar Radio Bursts. Washington DC American Geophysical Union Geophysical Monograph Series 119, 123. ADS.
- Gopalswamy et al. (2001) Gopalswamy, N., Lara, A., Kaiser, M.L., Bougeret, J.-L.: 2001, Near-Sun and near-Earth manifestations of solar eruptions. J. Geophys. Res. 106, 25261. DOI. ADS.
- Gopalswamy et al. (2009) Gopalswamy, N., Thompson, W.T., Davila, J.M., Kaiser, M.L., Yashiro, S., Mäkelä, P., Michalek, G., Bougeret, J.-L., Howard, R.A.: 2009, Relation Between Type II Bursts and CMEs Inferred from STEREO Observations. Sol. Phys. 259, 227. DOI. ADS.
- Gopalswamy et al. (2010) Gopalswamy, N., Xie, H., Mäkelä, P., Akiyama, S., Yashiro, S., Kaiser, M.L., Howard, R.A., Bougeret, J.-L.: 2010, Interplanetary Shocks Lacking Type II Radio Bursts. ApJ 710, 1111. DOI. ADS.
- Gopalswamy et al. (2012a) Gopalswamy, N., Nitta, N., Akiyama, S., Mäkelä, P., Yashiro, S.: 2012a, Coronal Magnetic Field Measurement from EUV Images Made by the Solar Dynamics Observatory. ApJ 744, 72. DOI. ADS.
- Gopalswamy et al. (2012b) Gopalswamy, N., Xie, H., Yashiro, S., Akiyama, S., Mäkelä, P., Usoskin, I.G.: 2012b, Properties of Ground Level Enhancement Events and the Associated Solar Eruptions During Solar Cycle 23. Space Sci. Rev. 171, 23. DOI. ADS.
- Gopalswamy et al. (2013) Gopalswamy, N., Xie, H., Mäkelä, P., Yashiro, S., Akiyama, S., Uddin, W., Srivastava, A.K., Joshi, N.C., Chandra, R., Manoharan, P.K., Mahalakshmi, K., Dwivedi, V.C., Jain, R., Awasthi, A.K., Nitta, N.V., Aschwanden, M.J., Choudhary, D.P.: 2013, Height of shock formation in the solar corona inferred from observations of type II radio bursts and coronal mass ejections. Advances in Space Research 51, 1981. DOI. ADS.
- Gopalswamy et al. (2014) Gopalswamy, N., Akiyama, S., Yashiro, S., Xie, H., Mäkelä, P., Michalek, G.: 2014, Anomalous expansion of coronal mass ejections during solar cycle 24 and its space weather implications. Geophys. Res. Lett. 41, 2673. DOI. ADS.
- Grechnev et al. (2011) Grechnev, V.V., Afanasyev, A.N., Uralov, A.M., Chertok, I.M., Eselevich, M.V., Eselevich, V.G., Rudenko, G.V., Kubo, Y.: 2011, Coronal Shock Waves, EUV Waves, and Their Relation to CMEs. III. Shock-Associated CME/EUV Wave in an Event with a Two-Component EUV Transient. Sol. Phys. 273, 461. DOI. ADS.
- Howard et al. (2008) Howard, R.A., Moses, J.D., Vourlidas, A., Newmark, J.S., Socker, D.G., Plunkett, S.P., Korendyke, C.M., Cook, J.W., Hurley, A., Davila, J.M., Thompson, W.T., St Cyr, O.C., Mentzell, E., Mehalick, K., Lemen, J.R., Wuelser, J.P., Duncan, D.W., Tarbell, T.D., Wolfson, C.J., Moore, A., Harrison, R.A., Waltham, N.R., Lang, J., Davis, C.J., Eyles, C.J., Mapson-Menard, H., Simnett, G.M., Halain, J.P., Defise, J.M., Mazy, E., Rochus, P., Mercier, R., Ravet, M.F., Delmotte, F., Auchere, F., Delaboudiniere, J.P., Bothmer, V., Deutsch, W., Wang, D., Rich, N., Cooper, S., Stephens, V., Maahs, G., Baugh, R., McMullin, D., Carter, T.: 2008, Sun Earth Connection Coronal and Heliospheric Investigation (SECCHI). Space Sci. Rev. 136, 67. DOI. ADS.
- Kienreich, Temmer, and Veronig (2009) Kienreich, I.W., Temmer, M., Veronig, A.M.: 2009, STEREO Quadrature Observations of the Three-Dimensional Structure and Driver of a Global Coronal Wave. ApJ 703, L118. DOI. ADS.
- Klassen et al. (2000) Klassen, A., Aurass, H., Mann, G., Thompson, B.J.: 2000, Catalogue of the 1997 SOHO-EIT coronal transient waves and associated type II radio burst spectra. A&AS 141, 357. DOI. ADS.
- Kouloumvakos et al. (2014) Kouloumvakos, A., Patsourakos, S., Hillaris, A., Vourlidas, A., Preka-Papadema, P., Moussas, X., Caroubalos, C., Tsitsipis, P., Kontogeorgos, A.: 2014, CME Expansion as the Driver of Metric Type II Shock Emission as Revealed by Self-consistent Analysis of High-Cadence EUV Images and Radio Spectrograms. Sol. Phys. 289, 2123. DOI. ADS.
- Kozarev et al. (2011) Kozarev, K.A., Korreck, K.E., Lobzin, V.V., Weber, M.A., Schwadron, N.A.: 2011, Off-limb Solar Coronal Wavefronts from SDO/AIA Extreme-ultraviolet Observations — Implications for Particle Production. ApJ 733, L25. DOI. ADS.
- Liu and Ofman (2014) Liu, W., Ofman, L.: 2014, Advances in Observing Various Coronal EUV Waves in the SDO Era and Their Seismological Applications (Invited Review). Sol. Phys. 289, 3233. DOI. ADS.
- Liu et al. (2012) Liu, W., Ofman, L., Nitta, N.V., Aschwanden, M.J., Schrijver, C.J., Title, A.M., Tarbell, T.D.: 2012, Quasi-periodic Fast-mode Wave Trains within a Global EUV Wave and Sequential Transverse Oscillations Detected by SDO/AIA. ApJ 753, 52. DOI. ADS.
- Long et al. (2008) Long, D.M., Gallagher, P.T., McAteer, R.T.J., Bloomfield, D.S.: 2008, The Kinematics of a Globally Propagating Disturbance in the Solar Corona. ApJ 680, L81. DOI. ADS.
- Long et al. (2011) Long, D.M., Gallagher, P.T., McAteer, R.T.J., Bloomfield, D.S.: 2011, Deceleration and dispersion of large-scale coronal bright fronts. A&A 531, A42. DOI. ADS.
- Long et al. (2014) Long, D.M., Bloomfield, D.S., Gallagher, P.T., Pérez-Suárez, D.: 2014, CorPITA: An Automated Algorithm for the Identification and Analysis of Coronal ”EIT Waves”. Sol. Phys. 289, 3279. DOI. ADS.
- Ma et al. (2011) Ma, S., Raymond, J.C., Golub, L., Lin, J., Chen, H., Grigis, P., Testa, P., Long, D.: 2011, Observations and Interpretation of a Low Coronal Shock Wave Observed in the EUV by the SDO/AIA. ApJ 738, 160. DOI. ADS.
- Magdalenić et al. (2012) Magdalenić, J., Marqué, C., Zhukov, A.N., Vršnak, B., Veronig, A.: 2012, Flare-generated Type II Burst without Associated Coronal Mass Ejection. ApJ 746, 152. DOI. ADS.
- Moreton and Ramsey (1960) Moreton, G.E., Ramsey, H.E.: 1960, Recent Observations of Dynamical Phenomena Associated with Solar Flares. PASP 72, 357. DOI. ADS.
- Moses et al. (1997) Moses, D., Clette, F., Delaboudinière, J.-P., Artzner, G.E., Bougnet, M., Brunaud, J., Carabetian, C., Gabriel, A.H., Hochedez, J.F., Millier, F., Song, X.Y., Au, B., Dere, K.P., Howard, R.A., Kreplin, R., Michels, D.J., Defise, J.M., Jamar, C., Rochus, P., Chauvineau, J.P., Marioge, J.P., Catura, R.C., Lemen, J.R., Shing, L., Stern, R.A., Gurman, J.B., Neupert, W.M., Newmark, J., Thompson, B., Maucherat, A., Portier-Fozzani, F., Berghmans, D., Cugnon, P., van Dessel, E.L., Gabryl, J.R.: 1997, EIT Observations of the Extreme Ultraviolet Sun. Sol. Phys. 175, 571. DOI. ADS.
- Nelson and Melrose (1985) Nelson, G.J., Melrose, D.B.: 1985, In: McLean, D.J., Labrum, N.R. (eds.) Type II bursts, 333. ADS.
- Nitta, Freeland, and Liu (2010) Nitta, N.V., Freeland, S.L., Liu, W.: 2010, An Alternative View of the ”Masuda” Flare. ApJ 725, L28. DOI. ADS.
- Nitta et al. (2012) Nitta, N.V., Liu, Y., DeRosa, M.L., Nightingale, R.W.: 2012, What Are Special About Ground-Level Events?. Flares, CMEs, Active Regions and Magnetic Field Connection. Space Sci. Rev. 171, 61. DOI. ADS.
- Nitta et al. (2013a) Nitta, N.V., Schrijver, C.J., Title, A.M., Liu, W.: 2013a, Large-scale Coronal Propagating Fronts in Solar Eruptions as Observed by the Atmospheric Imaging Assembly on Board the Solar Dynamics Observatory — an Ensemble Study. ApJ 776, 58. DOI. ADS.
- Nitta et al. (2013b) Nitta, N.V., Aschwanden, M.J., Boerner, P.F., Freeland, S.L., Lemen, J.R., Wuelser, J.-P.: 2013b, Soft X-ray Fluxes of Major Flares Far Behind the Limb as Estimated Using STEREO EUV Images. Sol. Phys. 288, 241. DOI. ADS.
- Olmedo et al. (2012) Olmedo, O., Vourlidas, A., Zhang, J., Cheng, X.: 2012, Secondary Waves and/or the ”Reflection” from and ”Transmission” through a Coronal Hole of an Extreme Ultraviolet Wave Associated with the 2011 February 15 X2.2 Flare Observed with SDO/AIA and STEREO/EUVI. ApJ 756, 143. DOI. ADS.
- Patsourakos and Vourlidas (2012) Patsourakos, S., Vourlidas, A.: 2012, On the Nature and Genesis of EUV Waves: A Synthesis of Observations from SOHO, STEREO, SDO, and Hinode (Invited Review). Sol. Phys. 281, 187. DOI. ADS.
- Patsourakos et al. (2009) Patsourakos, S., Vourlidas, A., Wang, Y.M., Stenborg, G., Thernisien, A.: 2009, What Is the Nature of EUV Waves? First STEREO 3D Observations and Comparison with Theoretical Models. Sol. Phys. 259, 49. DOI. ADS.
- Rouillard et al. (2012) Rouillard, A.P., Sheeley, N.R., Tylka, A., Vourlidas, A., Ng, C.K., Rakowski, C., Cohen, C.M.S., Mewaldt, R.A., Mason, G.M., Reames, D., Savani, N.P., StCyr, O.C., Szabo, A.: 2012, The Longitudinal Properties of a Solar Energetic Particle Event Investigated Using Modern Solar Imaging. ApJ 752, 44. DOI. ADS.
- Schrijver et al. (2011) Schrijver, C.J., Aulanier, G., Title, A.M., Pariat, E., Delannée, C.: 2011, The 2011 February 15 X2 Flare, Ribbons, Coronal Front, and Mass Ejection: Interpreting the Three-dimensional Views from the Solar Dynamics Observatory and STEREO Guided by Magnetohydrodynamic Flux-rope Modeling. ApJ 738, 167. DOI. ADS.
- Temmer, Vrsnak, and Veronig (2013) Temmer, M., Vrsnak, B., Veronig, A.M.: 2013, The Wave-Driver System of the Off-Disk Coronal Wave of 17 January 2010. Sol. Phys. 287, 441. DOI. ADS.
- Thompson and Myers (2009) Thompson, B.J., Myers, D.C.: 2009, A Catalog of Coronal ”EIT Wave” Transients. ApJS 183, 225. DOI. ADS.
- Thompson et al. (1998) Thompson, B.J., Plunkett, S.P., Gurman, J.B., Newmark, J.S., St. Cyr, O.C., Michels, D.J.: 1998, SOHO/EIT observations of an Earth-directed coronal mass ejection on May 12, 1997. Geophys. Res. Lett. 25, 2465. DOI. ADS.
- Thompson et al. (1999) Thompson, B.J., Gurman, J.B., Neupert, W.M., Newmark, J.S., Delaboudinière, J.-P., Cyr, O.C.S., Stezelberger, S., Dere, K.P., Howard, R.A., Michels, D.J.: 1999, SOHO/EIT Observations of the 1997 April 7 Coronal Transient: Possible Evidence of Coronal Moreton Waves. ApJ 517, L151. DOI. ADS.
- Uchida (1968) Uchida, Y.: 1968, Propagation of Hydromagnetic Disturbances in the Solar Corona and Moreton’s Wave Phenomenon. Sol. Phys. 4, 30. DOI. ADS.
- Uchida (1974) Uchida, Y.: 1974, Behavior of the flare produced coronal MHD wavefront and the occurrence of type II radio bursts. Sol. Phys. 39, 431. DOI. ADS.
- Veronig et al. (2010) Veronig, A.M., Muhr, N., Kienreich, I.W., Temmer, M., Vršnak, B.: 2010, First Observations of a Dome-shaped Large-scale Coronal Extreme-ultraviolet Wave. ApJ 716, L57. DOI. ADS.
- Vršnak et al. (2002) Vršnak, B., Warmuth, A., Brajša, R., Hanslmeier, A.: 2002, Flare waves observed in Helium I 10 830 Å. A link between H Moreton and EIT waves. A&A 394, 299. DOI. ADS.
- Vršnak et al. (2006) Vršnak, B., Warmuth, A., Temmer, M., Veronig, A., Magdalenić, J., Hillaris, A., Karlický, M.: 2006, Multi-wavelength study of coronal waves associated with the CME-flare event of 3 November 2003. A&A 448, 739. DOI. ADS.
- Warmuth and Mann (2011) Warmuth, A., Mann, G.: 2011, Kinematical evidence for physically different classes of large-scale coronal EUV waves. A&A 532, A151. DOI. ADS.
- Warmuth et al. (2004) Warmuth, A., Vršnak, B., Magdalenić, J., Hanslmeier, A., Otruba, W.: 2004, A multiwavelength study of solar flare waves. I. Observations and basic properties. A&A 418, 1101. DOI. ADS.
- Wills-Davey and Attrill (2009) Wills-Davey, M.J., Attrill, G.D.R.: 2009, EIT Waves: A Changing Understanding over a Solar Cycle. Space Sci. Rev. 149, 325. DOI. ADS.
- Wuelser et al. (2004) Wuelser, J.-P., Lemen, J.R., Tarbell, T.D., Wolfson, C.J., Cannon, J.C., Carpenter, B.A., Duncan, D.W., Gradwohl, G.S., Meyer, S.B., Moore, A.S., Navarro, R.L., Pearson, J.D., Rossi, G.R., Springer, L.A., Howard, R.A., Moses, J.D., Newmark, J.S., Delaboudiniere, J.-P., Artzner, G.E., Auchere, F., Bougnet, M., Bouyries, P., Bridou, F., Clotaire, J.-Y., Colas, G., Delmotte, F., Jerome, A., Lamare, M., Mercier, R., Mullot, M., Ravet, M.-F., Song, X., Bothmer, V., Deutsch, W.: 2004, EUVI: the STEREO-SECCHI extreme ultraviolet imager. In: Fineschi, S., Gummin, M.A. (eds.) Telescopes and Instrumentation for Solar Astrophysics, Society of Photo-Optical Instrumentation Engineers (SPIE) Conference Series 5171, 111. DOI. ADS.
- Yashiro et al. (2014) Yashiro, S., Gopalswamy, N., Mäkelä, P., Akiyama, S., Uddin, W., Srivastava, A.K., Joshi, N.C., Chandra, R., Manoharan, P.K., Mahalakshmi, K., Dwivedi, V.C., Jain, R., Awasthi, A.K., Nitta, N.V., Aschwanden, M.J., Choudhary, D.P.: 2014, Homologous flare-CME events and their metric type II radio burst association. Advances in Space Research 42, 1. DOI.
- Zhao et al. (2011) Zhao, X.H., Wu, S.T., Wang, A.H., Vourlidas, A., Feng, X.S., Jiang, C.W.: 2011, Uncovering the Wave Nature of the EIT Wave for the 2010 January 17 Event through Its Correlation to the Background Magnetosonic Speed. ApJ 742, 131. DOI. ADS.
- Zheng et al. (2011) Zheng, R., Jiang, Y., Hong, J., Yang, J., Bi, Y., Yang, L., Yang, D.: 2011, A Possible Detection of a Fast-mode Extreme Ultraviolet Wave Associated with a Mini Coronal Mass Ejection Observed by the Solar Dynamics Observatory. ApJ 739, L39. DOI. ADS.