Defining Photometric Peculiar Type Ia Supernovae
Abstract
We present a new photometric identification technique for SN 1991bg-like type Ia supernovae (SNe Ia), i.e. objects with light-curve characteristics such as later primary maxima and absence of secondary peak in redder filters. This method is capable of selecting out this sub-group from the normal type Ia population. Furthermore, we find that recently identified peculiar sub-types such as SNe Iax and super-Chandrasekhar SNe Ia have similar photometric characteristics as 91bg-like SNe Ia, namely the absence of secondary maxima and shoulders at longer wavelengths, and can also be classified with our technique. The similarity of these different SN Ia sub-groups perhaps suggests common physical conditions. This typing methodology permits the photometric identification of peculiar SNe Ia in large up-coming wide field surveys either to study them further or to obtain a pure sample of normal SNe Ia for cosmological studies.
Subject headings:
supernovae: general1. Introduction
Despite great progress over recent years from the observational as well as from the theoretical perspective, the nature of type Ia supernovae (SNe Ia) remains elusive and under active debate. These luminous explosions have been used to obtain cosmological parameters with increasing precision (Riess et al., 1998; Perlmutter et al., 1999; Conley et al., 2011; Suzuki et al., 2012), yet the progenitor system remains still unknown. A key to unveil their origin relies in the study and understanding of the intrinsic diversity seen in their light-curves and colors, whose cosmic evolution ultimately also affects cosmology through systematics.
SNe Ia constitute in fact a heterogeneous sample with differing light-curves whose primary variety is well explained by the relations of luminosity and light-curve shape (Phillips, 1993), and of luminosity and color (Riess et al., 1996; Tripp, 1998). The variation of light-curve shape and luminosity is attributed to the amount of 56Ni produced in thermonuclear runaway of the exploding carbon-oxygen white dwarf (CO-WD) (Mazzali et al., 2007). The nature of the companion star of the binary system and the physics of the explosion are still unknown. Models include single degenerate scenarios with a non-degenerate companion and the WD exploding near the Chandrasekhar mass (e.g. Nomoto et al., 1984; Hachisu et al., 1996; Dessart et al., 2013) or at sub-Chandrasekhar mass (Nomoto, 1982; Sim et al., 2010; Kromer et al., 2010), as well as double degenerate scenarios with two WDs slowly coalescing (Lorén-Aguilar et al., 2009; Shen et al., 2012) or merging in a violent fashion (Iben & Tutukov, 1984; Pakmor et al., 2012; Kromer et al., 2013b); and even more exotic channels (Kashi & Soker, 2011; Wheeler, 2012). See Maoz et al. (2013) for a review.
Extreme cases and outliers in the SN Ia population were recognized early on: overluminous SNe Ia or SN 1991T-like objects (e.g Filippenko et al., 1992a; Phillips et al., 1992; Maza et al., 1994), and subluminous or SN 1991bg-like ones (e.g. Filippenko et al., 1992b; Leibundgut et al., 1993; Hamuy et al., 1994). These objects make up for a considerable fraction of SNe Ia (Li et al., 2011; Smartt et al., 2009, ) and represent a key ingredient to understand the SN Ia mechanism. Furthermore, in recent years new interesting outliers have been challenging further the general SN Ia picture adding more heterogeneity and complexity: peculiar 2002cx-like SNe or “SNe Iax” (e.g. Li et al., 2003; Foley et al., 2013), super-Chandrasekhar-mass candidates (e.g. Howell et al., 2006; Scalzo et al., 2012) and some peculiar SNe with few representatives in their groups: SN 2000cx-like (Li et al., 2001; Candia et al., 2003; Silverman et al., 2013a), SN 2006bt (Foley et al., 2010b) and PTF 10ops-like with 91bg-like SN Ia characteristics yet with wide light-curve (Maguire et al., 2011; Kromer et al., 2013b). Also, there is recent evidence for SNe Ia with possible circumstellar material (CSM) interaction (Hamuy, 2003; Dilday et al., 2012; Silverman et al., 2013b). Finally, new intriguing objects borderline of thermonuclear explosions are emerging: the Calcium-rich SN group (Ca-rich: Perets et al., 2010, 2011b; Valenti et al., 2013a; Kasliwal et al., 2012) and extremely underluminous “SN.Ia” candidates (Kasliwal et al. 2010 although see Drout et al. 2013, 2014).
This plethora of thermonuclear events asks for an urgent classification scheme and hopefully a proper theoretical explanation of the diversity of observables that will link them together to possible progenitor channels. The investigation of the characteristics of all these objects can help us carve the way. The method presented in this paper is such an attempt based solely on photometry and light-curve analysis of a large public SN Ia dataset.
The original aim of the present work was to separate SN 1991bg SNe Ia from the normal population in an efficient purely photometric fashion. Several studies of 91bg-like SNe Ia have been undertaken in the past (Garnavich et al., 2004; Taubenberger et al., 2008; Kasliwal et al., 2008). These SNe are known to be fainter with at maximum and to have a faster decline of the light-curve than their normal counterpart. Such a behaviour has been best portrayed by light-curve parameters such as and stretch from different fitters (e.g. Hamuy et al., 1996b; Riess et al., 1996; Jha et al., 2007; Perlmutter et al., 1997; Guy et al., 2007), always putting 91bg-like SNe Ia at the faint and fast extreme of the light-curve width-luminosity relation with or . In addition, 91bg-like events are much cooler as seen through their spectra with presence of strong Ti II lines and their red colors, . Such a deviation from the normal population that has made them unsuitable for cosmology. The different color evolution is particularly striking in the redder optical bands and the near-infrared (NIR) where neither shoulder nor secondary maxima are observed as opposed to classical SNe Ia (Phillips, 2011). The color evolution presents also other less noticeable differences in the relative time of maximum light in the different bands: 91bg-like SNe Ia have maxima in redder band that occur after the maximum in bluer bands, whereas for normal events it happens before. These different features can been explained with the differing spectroscopic and color evolution of SNe Ia (e.g. Kasen & Woosley, 2007): 91bg-like objects are cooler, therefore redder, and the recombination temperature of Fe III to Fe II for them happens earlier. The onset of this recombination determines the red and NIR secondary maxima since the Fe II line blanketing absorbs flux in the blue that is re-emitted at longer wavelengths.
The 91bg-like photometric typing technique we present here reveals surprising adequacy to adjust other peculiar SNe Ia that have atypical light-curves such as SNe Iax, SN 2006bt-like and super-Chandrasekhar SNe Ia, and the possibility to photometrically classify them as well. In the current and coming age of large wide field surveys such as the Dark Enery Survey (DES, Sako et al., 2011a), the Large Synoptic Survey Telecope (LSST, Ivezic et al., 2011), where thousands of transients are routinely discovered and the spectroscopic follow-up becomes expensive, the need of a photometric identification technique that provides a way to classify and recognize different sub-groups of SNe Ia for different scientific studies becomes imperative.
The paper is organized as follows: in section 2, we present the data, as well as our photometric typing technique based on light-curve fits, validating it with different light-curve and spectroscopic diagnostics. Section 3 presents the results of the classification for different sub-samples of SNe Ia and in section 4 we investigate contamination from core-collapse SNe, the relevance and impact of the training sample used in the classification, and finally we look for possible common physical origins of the similar photometric SN Ia groups. We summarize in section 5.
2. Analysis
2.1. Data
In this work, we make use of several large low-redshift () SN Ia samples from the literature. Multi-band photometry is available for more than 500 SNe Ia obtained through the effort of several teams, including the Calán/Tololo survey (Hamuy et al., 1996a), the Carnegie Supernova Project CSP (Contreras et al., 2010; Stritzinger et al., 2011), Center for Astrophysics CfA (Hicken et al., 2009, 2012), Lick Observatory Supernova Search (Ganeshalingam et al., 2010) and many more. Besides analyzing SN photometry obtained exclusively after 1980, initially we do no restrict on the source of the photometry used; as long as it is internally consistent, we do not require the type of precise calibration needed for cosmology. In order to test the typing technique, we also use a collection of nearby core-collapse (CC) SNe from the literature. A summary of the number of SNe before and after the different light-curve cuts we will apply is shown in table 1. A list of SNe Ia used and their sources is presented in table LABEL:Iaphot and of CC SNe in table LABEL:CCphot.
2.2. Methodology: light-curve fits
We use here SiFTO (Conley et al., 2008) to fit the optical light-curves of all SNe Ia with two different templates that reproduce the aforementioned differences between normal and 91bg-like SNe Ia. SiFTO is a powerful and versatile light-curve fitter that manipulates spectral templates to simultaneously match the multi-band photometric data of a particular SN with heliocentric redshift . The spectral template at a given epoch is adjusted to the observer-frame fluxes through multiplicative factors . A stretch parameterization is used to describe the shape of the light-curve and is defined as a factor multiplying the time axis (Perlmutter et al., 1997; Goldhaber et al., 2001). The time of peak luminosity in , , is an additional fit parameter. The light-curve fit thus minimizes following function:
| (1) |
where is the number of data points in the th filter for filters, are the observed fluxes with corresponding errors and is the modelled flux given by the integration of the SED through the given filter at a certain epoch and dependent on the model parameters. The is a general score of the fit taking all input bands together. The SiFTO color, , is obtained adjusting the SED to observed colors (via the normalization factors ) corrected only for Milky Way extinction with values from Schlafly & Finkbeiner (2011). No correction for the host reddening is attempted due to our poor understanding of it.
Given its nature, SiFTO is highly dependent on the spectral template series. We use the one developed by Hsiao et al. (2007) for normal SNe Ia, commonly used for cosmology (Conley et al., 2011) and other SN Ia studies (e.g. Pan et al., 2013), and the one by Nugent et al. (2002)111http://supernova.lbl.gov/~nugent/nugent_templates.html for 91bg-like SNe Ia, previously used to identify objects with 91bg-like characteristics (González-Gaitán et al., 2011; Maguire et al., 2011; Sullivan et al., 2011). The normal template was constructed with a large sample of SNe Ia at low and high redshift, whereas the 91bg-like SN Ia template comes from the classical subluminous SN 1991bg and SN 1999by. Although there are many more 91bg-like SNe Ia nowadays to improve this template, we show in the following that it is appropriate for our purposes.
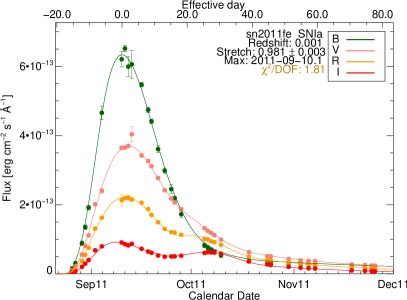
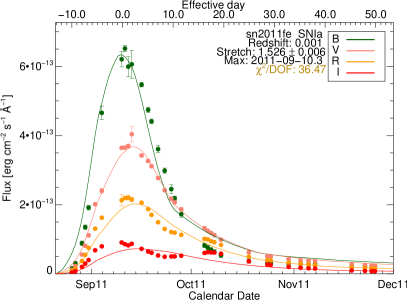
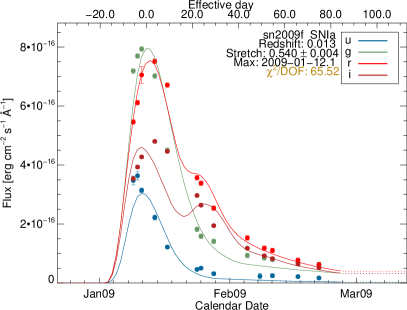
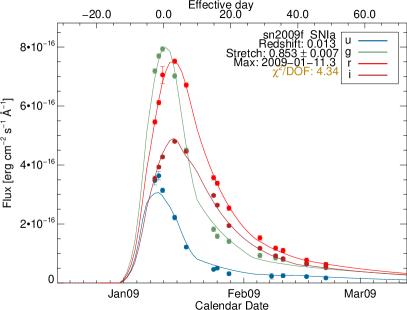
In order to ensure a proper fit, we require at least two filters, each with at least one data point between -15 and 0 days and one between 0 and 25 days past -band maximum. We perform fits using all available optical photometry down to 85 days past maximum. If different photometric calibrations from different instruments exist per filter set, we choose only one set, based on the number of data points, to ensure consistent photometry per filter. Ideally, as will be shown later, red bands such as or and or are benefitial to fully exploit the range of possible SN Ia sub-groups. The SiFTO fits are performed with both “normal” and “91bg” templates. Some example fits are shown in figure 1 and figure 2, where one can compare the quality of the fits for the two templates for two SNe Ia: SN 2011fe and SN 2009F. The first presents better normal template fit as seen in the figure as well as on the lower overall reduced fit quality, (Ia)(91bg), whereas the other shows better 91bg template fits and have (Ia)(91bg). We first use this simple photometric criterion (criterion 1) to separate the SN Ia population into photometric normal and SN 1991bg/SN 1999by-like objects. We note that for fits with a 91bg template, a “stretch” has a different meaning since it is with respect to a typical 91bg-like SN Ia, so SN 1991bg and SN 1999by have a “normal template” stretch of and but a “91bg template” stretch of and ,respectively. The definition of standard SN is shifted in both cases. We also emphasize that the stretch parameter is a factor defined in -band, so that it evaluates bests the variation near this wavelength.
2.3. Blue- and red-band template fits
Although the 91bg-like SN Ia typing technique based on the overall comparison between normal and 91bg template fits is quite good at separating 91bg-like from normal SNe Ia according to spectroscopic classifiers, as will be shown in next sections, there is a fraction of non 91bg-like objects that are typed as such. Investigating closely these objects, we find that many of them are actually peculiar SNe Ia of a different kind. SNe Iax are all typed as 91bg-like SNe Ia, super-Chandrasekhar objects as well, and even SN 2013bh, the only other 2000cx-like member in the literature (Silverman et al., 2013a) is also picked up. Although at first intriguing, one can understand this result as their light-curves in redder bands resemble those of typical 91bg-like objects more than those of normal ones, showing less or no shoulder and secondary maxima.
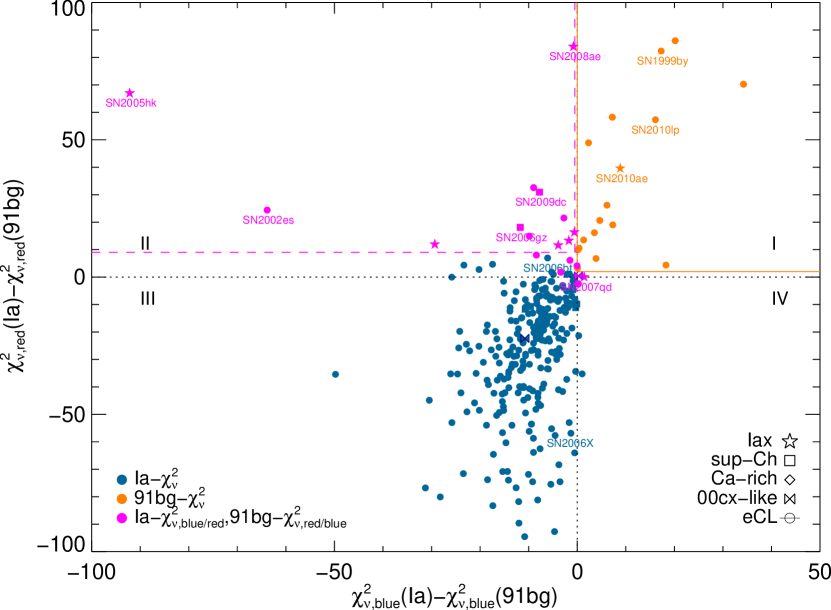
Nonetheless, one can also see that their photometric behaviour is different from the true 91bg-like objects in the bluer bands and that the overall is being driven by extremely poor normal template fits in the redder bands. To investigate this further, we re-fit all our sample restricting the fit to “blue-bands”, i.e. using following available filters simultaneously: or , and , with both templates, normal and 91bg-like. Then, we do the same but restricting the fit to “red-bands”, i.e. using simultaneously filters , or , and or . We require for this at least one filter with one point prior to maximum and one after maximum. Figure 3 shows the resulting difference in fit quality between normal and 91bg templates for the red-band versus blue-band fits. We denote four quadrants in this plot, which we will refer to throughout the paper. In this figure we can see that if we add a restriction to the photometric definition of a 91bg-like SN Ia based on the result of the comparison of fits in the blue and red bands, i.e. and (vertical and horizontal dotted lines), criterion 2, we discard almost all peculiar SNe Ia, in particular all SNe Iax except for SN 2010ae and SN 2007qd, and all super-Chandrasekhar SNe Ia, while keeping the known spectroscopic 91bg-like SNe Ia. It is worth mentioning that since only two objects have better 91bg template fits in blue bands but worse in red bands (quadrant IV), this criterion could also only consist of just a blue-band cut and no red-band cut to include most objects.
The separation between these groups does not necessarily need to be at exactly and (dotted lines in fiure 3), and could instead be offset from these lines. To investigate this further, we use a common photometric typing diagnostic (e.g. Kessler et al., 2010b), the Figure of Merit (FoM), given by the efficiency of the classification (), i.e. the fraction objects of a given type correctly tagged, and the purity () or fraction of classified objects that really are of that type, i.e. a measure of the false positive tags:
where is the number of correctly identified objects of a given type (e.g. 91bg-like objects), is the total input number of that type and is the number of objects falsely tagged as objects of that given type.
Calculating this FoM for known 91bg-like objects, FoM(91bg), for different boxes around and and looking for the maximum FoM, we find the areas highlighted in orange in figure 3. This box is similar to the original with a slight vertical offset of , which leaves out peculiar SN 2007qd and SN 2013bh. Objects inside this region, besides having a better overall 91bg template fit, are also 91bg-like candidates according to the blue/red-band fits (criterion 1 and 2). This selected group is located in quadrant I of the figure and symbols therein are shown in orange. SN 1991bg-like candidates according to the overall (criterion 1) that are not in this region, i.e. do not fulfill criterion 2, are denoted with purple symbols in the figure (mostly in quadrant II). Blue symbols are normal candidates according to the overall fit.
Alternatively, to eliminate the first criterion and be able to select peculiar SNe Ia, i.e. those objects in purple, one can also find a region of maximum FoM(pec) in a similar fashion to FoM(91bg). This results in the area shown in purple dashed lines. This zone however does not include the two objects in quadrant IV, SN 2007qd and SN 2013bh. These dividing lines are sensitive to the training sample used and will therefore be studied in more detail in section 4.
2.4. Comparison with other light-curve parameters
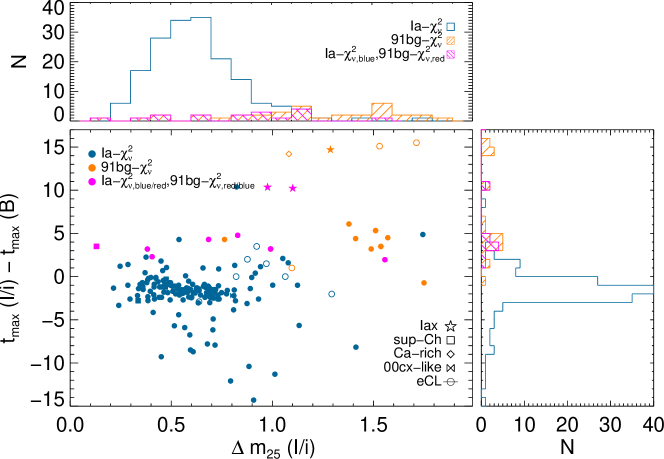
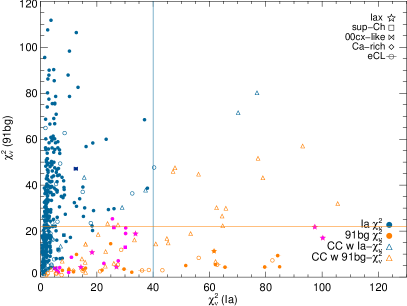
In the examples shown in figures 1 and 2, it seems evident that the shoulder and secondary maxima of bands at longer wavelength determine the quality of the fits since they are present in normal SNe Ia as opposed to 91bg-like objects. Nevertheless, it is important noting that the time of maximum in each band also plays a crucial role. To test these light-curve characteristics independently from SiFTO, we calculate the time of maximum in each band using a fourth degree polynomial fit and we also look for a secondary maximum with another polynomial fit. If the secondary maximum is not very separated in time from the primary maximum in redder bands such as / or /, we are not able to define such a secondary; in fact, we find a secondary maximum in / for only 2 (of 48) 91bg-like candidates according to criterium 1, whereas this is found for more than 90 (of 295) normal SNe Ia. A more continuous parameter that can be defined for a larger sample is the magnitude change after 25 days past maximum or : if a SN has a secondary shoulder or a maximum that typically occurs 20-35 days past maximum for redder bands, then this parameter should somewhat reflect this. In figure 4 we show two light-curve diagnostics, the difference in maximum between two different bands, and for the samples selected with the mechanism shown in the previous section. Clearly, as expected, the normal SNe Ia according to our light-curve fits have maxima in red bands that happen earlier and they also have lower than 91bg-like candidates that had better overall, blue and red band 91bg template fits (filled orange). Objects with better overall but worse blue/red 91bg template fits (filled purple) also differ from normal SN Ia candidates, although not as strongly as 91bg-like candidates. These trends happen in /, are stronger in / and are exacerbated in the NIR (Phillips, 2011).
2.5. Comparison with spectral classificators
The standard classification of supernovae is defined by identifying spectral features near maximum light. Several classification schemes for SNe Ia have been proposed, notably those by Benetti et al. (2005), Branch et al. (2006) and Wang et al. (2009a), all based on prominent line properties such as Silicon strength, velocity and velocity gradient. Additionally, some automated classification tools such as SNID (Blondin & Tonry, 2007) or GELATO222Available at https://gelato.tng.iac.es/login.cg (Harutyunyan et al., 2008) have been presented for general use.
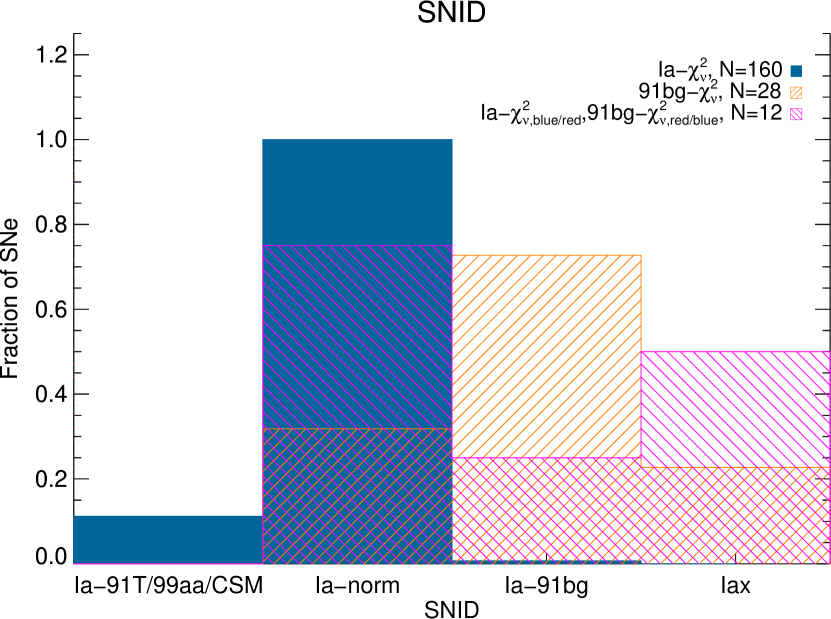
Using a large sample of classifications from SNID given by Silverman et al. (2012), we compare them to our photometric classificator. 220 SNe Ia match their sample and we show the result in figure 5. SNID gives the following classifications for SNe Ia: Ia-norm, Ia-91T, Ia-91bg, Ia-CSM, Ia-99aa and Ia-02cx. We group here Ia-91T, Ia-99aa and Ia-CSM together into a single bin that, as can be seen, has no further influence in our classification. From this figure, one can see that most of the 187 objects () photometrically classifed as normal SNe Ia are also normal according to SNID. On the other hand, we do see that photometric 91bg-like candidates are found in other bins. In particular, 7 objects leak into the Ia-norm bin. Some of these objects, like SN 2007on, are borderline between photometric normal and 91bg-like according to our overall fits having very similar , but some others have quite interesting properties that make them stand out, like super-Chandrasekhar SNe Ia. Most of these can be identified with quality of fit in particular filter sets, as shown in last section, and shown in the figure with purple histograms. All SNe Iax are typed as photometric 91bg-like SNe Ia according to the overall fit. This result is possibly physically interesting per se, and for cosmological studies seeking for purely normal SNe Ia, it also presents a way to photometrically take out more than one group of peculiar objects simultaneously. For a 91bg-like SN Ia typing technique however, this could be worrisome. Fortunately, the inclusion of blue/red-band fits permits us to discriminate quite well between both groups as well.
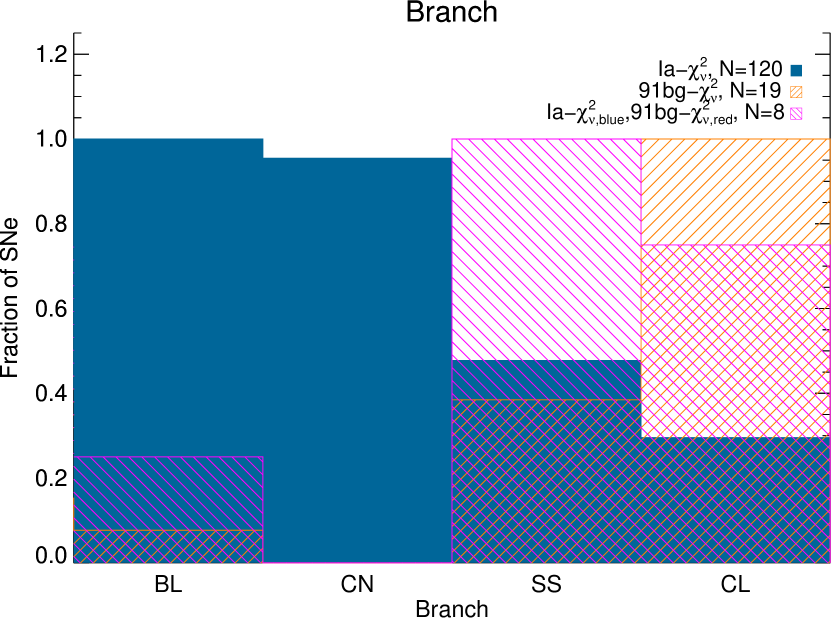
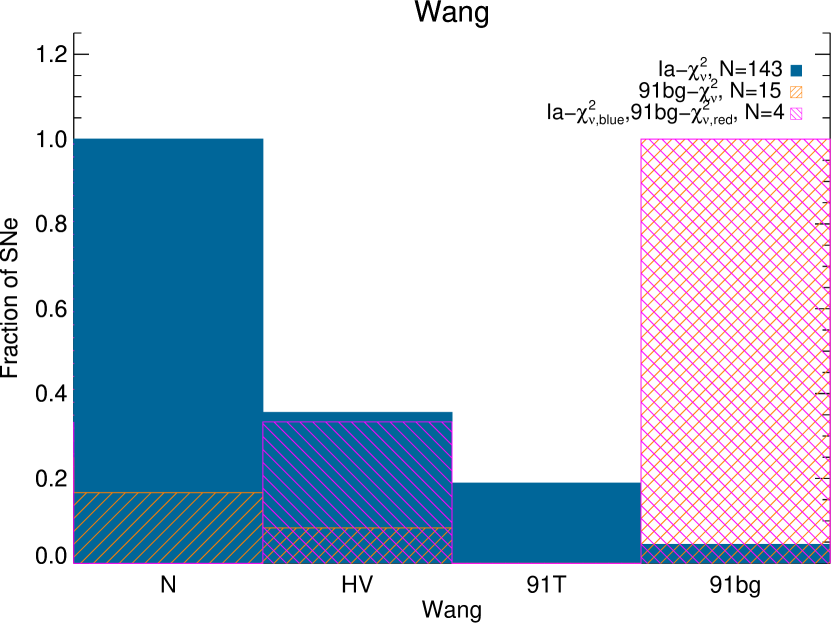
Blondin et al. (2012) also present a large spectroscopic dataset and publish the classifications of Branch et al. (2006) and Wang et al. (2009a) for their sample. We find 189 matches and show the comparison in figure 5 for these spectral groups. In general we find agreement with our typing (the “Cool”, CL, group corresponds to the 91bg-like for Branch et al. 2006). We again find that some objects that we type photometrically as 91bg-like according to the overall fit are misidentified according to these spectral classifications. Nevertheless, most of these actually correspond to SNe Iax and super-Chandrasekhar SNe Ia and are mostly included in the purple histograms that take into account blue/red-band fits. Thus, from this we see that the technique here presented allows to differentiate quite successfully normal, 91bg-like and other peculiar SNe Ia, notably SNe Iax. More on these other sub-classes will be discussed in next sections.
In general, we find a remarkable agreement between our photometric typing and the different spectroscopic classifiers. This is impressive given that SiFTO was not devised originally for this purpose and it opens up promising possibilities for other transient surveys.
3. Results
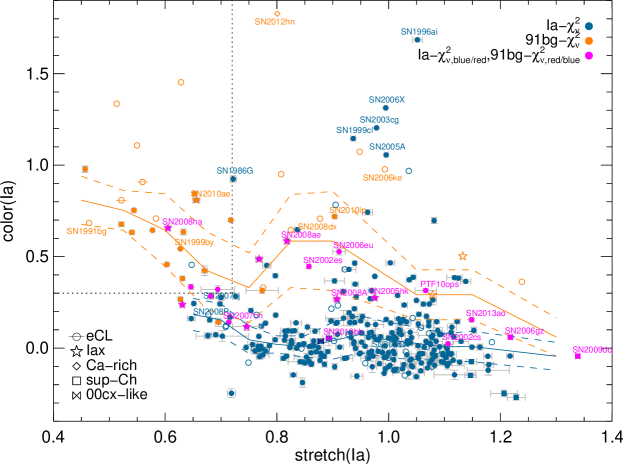
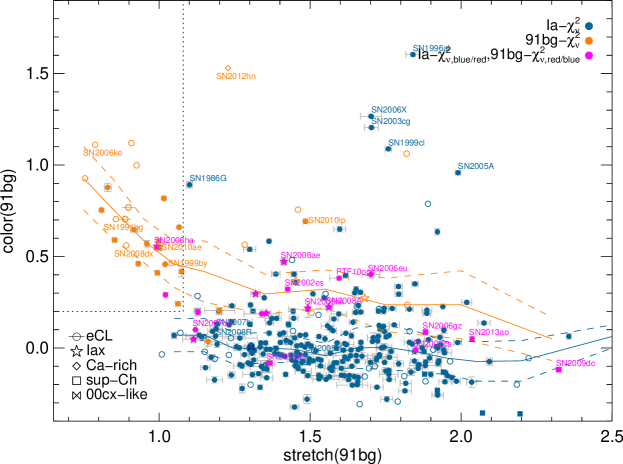
We explore in figure 6 the range of parameters obtained with our fits comparing SiFTO color with stretch obtained with both templates: normal and 91bg-like. Since SiFTO fits every filter flux scale independently, both colors, measured with normal and with 91bg templates, should in principle be comparable. For stretch, on the other hand, since a has different meanings in both cases, the values will be quite different but the stretches should be quite correlated. We find indeed following relation for stretch: with RMS, and for color: with RMS. Which parameters one should use is defined by the fit quality: e.g. if an object has better 91bg template fit, one should use the parameters obtained with the 91bg template fit, and vice versa.
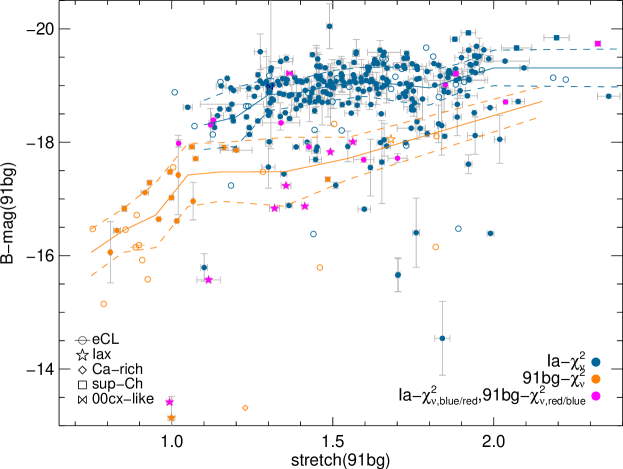
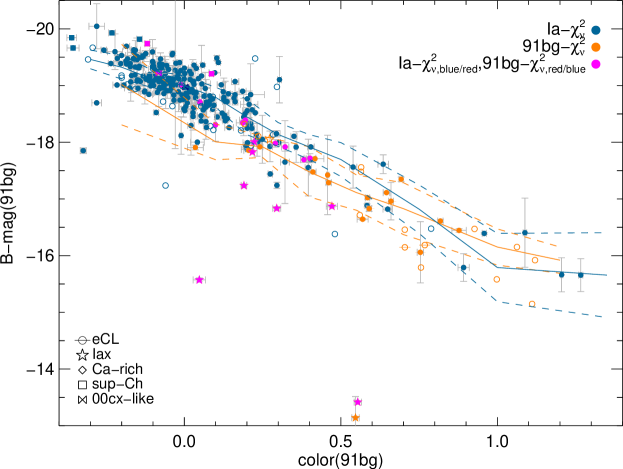
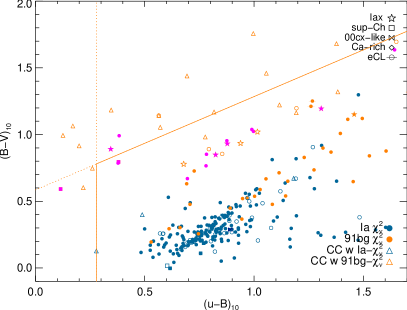
We also show the magnitude-stretch and magnitude-color obtained with SIFTO from the 91bg template fits in figure 7. These magnitudes are only corrected for distance assuming a standard cosmology for SNe in the Hubble flow () or different estimates from the NASA/IPAC Extragalactic Database (NED) when closer. We can see that most of SNe Ia, including normal and 91bg-like, follow a narrow trend of magnitude versus color, regardless of the nature of the color: intrinsic or reddened. Some SNe Iax are the only exception being very faint for their colors. The different aspects of the SN Ia sub-groups shown in these figures will be further developed in the next sections.
3.1. SN 1991bg-like SNe Ia
We now focus on the SN 1991bg-like sample defined as objects with better overall, blue and red 91bg template fits (orange box in figure 3), which represent the classical objects similar to SN 1991bg. In both panels of figure 6, we can see that this group spans the shortest stretch range, between (or ). However, we note that a cut based solely on normal stretch, as done in previous studies, would be insufficient to define classical 91bg-like SNe Ia photometrically. Some SNe Ia like SN 2008R have a fast evolving light-curve, i.e. low stretch, but are better fit with a normal SN Ia template. Some normal low-stretch SNe Ia do exist and are characterized for having bluer colors than normal SNe Ia. Therefore, a color cut would also be needed to ensure an almost uncontaminated population. Using a color cut of (or ) and a stretch cut of (or (shown with dashed lines in figure 6) instead of the above criteria, we recover most of the real 91bg-like candidates leaving out all other SNe Ia except for two SNe Iax of very low stretch. Using exclusively a cut with the 91bg stretch, , is a better discriminator that almost does not require the extra color cut needed when using the normal stretch. We note that a potential problem of a simple color and stretch cut instead of our fit analysis would be the presence of highly reddened normal SNe Ia at low stretch mimicking typical 91bg-like SNe Ia.
It is worth mentioning that the transition region between photometric normal and 91bg-like objects is well populated in both figures 3 and 6a, with no evidence of a clear gap as hinted in Phillips (2011). The few 91bg-like objects found in the defined normal region have very similar for both templates. This is the case for SN 2007on for example, a photometric 91bg-like SN Ia with a very similar fit quality with a normal template. On the other hand, SN 2007hj is a photometrically normal SN Ia with basically the same fit quality with both templates. In fact, there are in total 8 objects with , of which 5 lie in the transition region, i.e. . Other examples include SN 1986G, a low-stretch (), highly reddened from extincion in the host galaxy. This SN has slightly better normal templates fits with indications of shoulder and secondary maxima in the red-bands. This is ultimately confirmed through NIR observations (Phillips, 2011). These transition objects hint towards a smooth transition from 91bg-like to normal SNe Ia. Nonetheless, one can arguably see a slight gap in the color-stretch figure for the 91bg template (figure 6b) and the behaviour of the 91bg-like sample for the color-stretch relations, as well as for the relations between magnitude-stretch (see figure 7a) present different slopes than for the normal population. We will investigate this issue further with a cluster analysis in section 4.5.1.
Folatelli et al. (2013) define an “extreme cool” (eCL) spectroscopic sample based on the pseudo-equivalent width of the Mg II line complex around 4300Å, which includes Ti II lines. The more extreme 91bg-like objects have the strongest features and are therefore eCL objects. We identify those objects in our figures and we note that, as expected, they have the largest difference between normal and 91bg template fits, giving further evidence of the power of this technique.
Finally, it is worth noting that two objects, SN 2006ke and SN 2008dx, spectroscopically classified as SN 1991bg-like with SNID in Silverman et al. (2012) and that we identify as 91bg-like candidates according to the overall fit (but we do not have sufficient data in blue-bands to confirm them) lie in the proper region defined in the upper left of figure 6 for the 91bg fits (6b) but not for the normal fits (6a). This confirms that one should use the parameters obtained with the best template.
3.2. Slowly evolving SN 1991bg-like SNe Ia
The present study has revealed that many peculiar SNe Ia bear some light-curve similarities with typical 91bg-like SNe Ia and that they are classified as such with a simple single criterion. The clearest example of this are the high-stretch 91bg-like SNe Ia: PTF 10ops (Maguire et al., 2011) and SN 2010lp (Pignata et al., 2014; Kromer et al., 2013b), which have wide light-curves, yet 91bg-like spectra and red colors. This set of objects are classified as 91bg-like according to criterion 1 of our photometric method: they have better overall light-curve fits with a 91bg template. Furthermore, SN 2010lp has both blue- and red-band fits that are better with a 91bg template (criterion 2) as well. For PTF 10ops, there is only one blue band, filter, with few data points and whose fit is vs , basically identical, so it is difficult to disentangle between a peculiar SN Ia such as SN 2002cx or a high-stretch 91bg-like SN Ia. However, if we take into account the region denoted in purple in quadrant II of figure 3 as a delimiter of SNe Iax, and we include the purple dots below as possible 91bg-like objects, we add three more SNe Ia to the 91bg-like objects: PTF 10ops, SN 2006eu and SN 2007ba. The latter one is a transitional object with () for which SNID gives a 91bg-like classification. SN 2006eu is a higher-stretch object (,) with a normal SNID classification; the CfA classification333http://www.cfa.harvard.edu/supernova/RecentSN.html, however, signals its similarity to a 91bg-like object. Another object, SN 1999bh with and , is typed as 91bg-like according to the overall fits but not enough pre-maximum data in the blue is available to study it further. SNID, however, gives 91bg-like matches making this SN another potential member of this group, although it also finds some matches to SN 2006bt (see § 3.5). Ganeshalingam et al. (2012) also mention the peculiarity of this object. This would imply that we identify 3-4 high-stretch SNe with photometric 91bg-like characteristics according to criteria 1 and 2. No other similar SNe Ia are known in the low- literature, suggesting that they are rare or that they do occur in remote regions (Maguire et al., 2011), and therefore missed in historic galaxy targeted surveys.
3.3. Type Iax supernovae
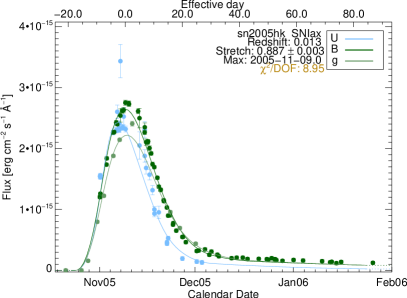
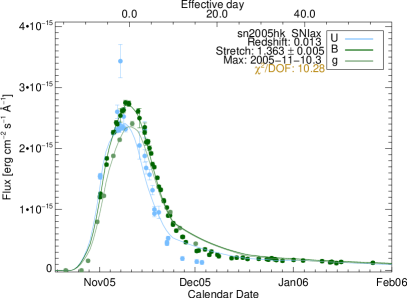
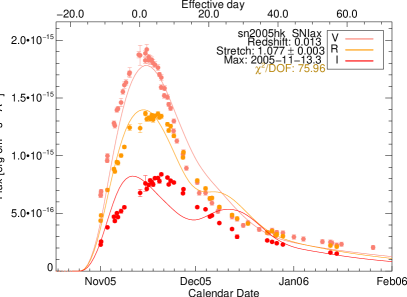
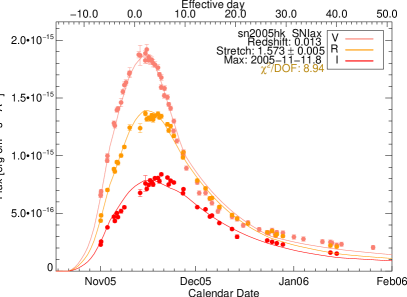
An important outcome of the initial overall comparison of the fits with the two different templates is the identification of all 10 SNe Iax in the literature that pass the light-curve cuts. Including then the blue- and red-band comparison, we can differentiate between real 91bg-like objects and the remaining 7 SNe Iax after the new cuts, with the exception of SN 2010ae which has better 91bg template fits in all cases as well as a low stretch. So, from a photometric perspective, SNe Iax appear as a mixture between normal and 91bg-like SNe Ia: they have a blue-band behaviour that is more similar to standard SNe Ia but have red-band light-curves much more similar to 91bg-like SNe Ia. In figure 8, we show SN 2005hk as an example of all four fits: blue-band and red-band fits for normal and 91bg templates. One can see that although the blue-band fit agrees more with a normal template, the fit is far from perfect. This behaviour is found in other SNe Iax, even when only one blue filter is available, like for SN 2002cx. Even with the use of templates that weren’t designed for SNe Iax, we are able to identify them quite well.
SN 2010ae is an extreme of the SN Iax population (Stritzinger et al., 2014) with very low stretch but also red colors. The difference in for both templates is quite large, also for the blue-band fits. This is a striking result given that SN 2008ha, another extreme case of the population, does fall into the SN Iax category through the blue-band fits. Both however are very faint (even taking into account extinction, see Stritzinger et al. 2014), far off the classical 91bg-like population, as shown in figures 7, so they can easily be identified. Two more SNe Iax, SN 2011ay and SN 2012Z, are photometrically identified as 91bg-like candidates with criterion 1 but not enough data in the blue bands permitted to evaluate criterion 2.
On the other hand, we do find another candidate that is not classified as SN Iax in the literature: SN 2002es. Classifying it with SNID, we find that it is a 91bg-like object with and ; no match to any SN Iax is found. Ganeshalingam et al. (2012) note the peculiarity of this object and discuss the similarities to 91bg-like and to 02cx-like objects. Therefore, it seems this object might be in between SNe Iax and slowly evolving 91bg-like objects, such as PTF 10ops. Alternatively, it could make part of another similarly peculiar group, SN 2006bt-like objects, that will be discussed later.
3.4. Super-Chandrasekhar SNe Ia
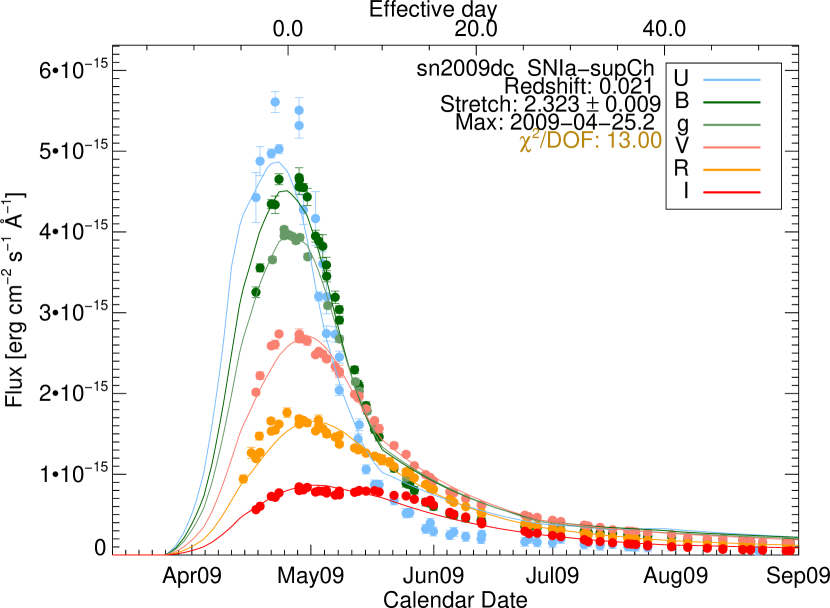
Besides SNe Iax, another 8 SNe Ia have better overall and worse blue- or red-band 91bg template fits. Two of those catch one’s attention: SN 2006gz and SN 2009dc. These two supernovae are super-Chandrasekhar SN Ia candidates (e.g. Hicken et al., 2007; Maeda et al., 2009; Taubenberger et al., 2011; Hachinger et al., 2012; Kamiya et al., 2012). Taking a closer look at their light-curves, one can understand why this happens: the red-band part is better fit with the 91bg template. Since super-Chandrasekhar SNe Ia have characteristic -band light-curves where the secondary maximum happens earlier than for normal SNe Ia, the two maxima merge and create almost a plateau with an unique elongated maximum. SN 1991bg-like SNe Ia have also only one maximum, that, even of shorter duration, can approximate super-Chandrasekhar light-curves better. The same occurs in the band where the shoulder of super-Chandrasekhar almost disappears, simulating the behaviour of 91bg-like objects (see figure 9). Investigating the classical super-Chandrasekhar SN 2003fg (Howell et al., 2006), which was not originally included in our analysis due to its higher redshift (), we find that it is also better fit with a 91bg template for the overall but also the blue- and red-band light-curves. However, given its high stretch (, ), one can easily tell it apart from regular 91bg-like and PTF 10ops-like objects. SN 2007if (Scalzo et al., 2010), on the other hand, does not have pre-maximum data to perform our analysis. In addition to these supernovae, Scalzo et al. (2012) present 5 super-Chandrasekhar candidates. Our technique does not pick these up at all. This is due to their wider definition more similar to typical SN 1991T-like objects. One can indeed see that these light-curves have clearly distinct secondary maxima in and definite shoulders in . Our method suggests that only the most extreme cases, the standard super-Chandrasekhar SNe Ia, have photometric similarities to other sub-classes as 91bg-like and SN Iax objects.
This method seems then capable of distinguishing also super-Chandrasekhar objects. How can one separate them from SNe Iax since they are all identified in the same manner? When one looks at the stretch of these objects, they are beyond (). Some super-Chandrasekhar candidates identified by Scalzo et al. (2012) have such wide light-curves but interestingly, their colors are bluer () as opposed to SN 2006gz () and SN 2009dc (). SNe Iax, on the contrary, all have (). As is the case for 91bg-like objects (§ 3.1), this division is clearest with the 91bg instead of the normal stretch.
Another interesting object, SN 2002cs, is identified with our method in a similar way to the super-Chandrasekhar candidates. It also has high stretch, (), red color ( and it shows small shoulders instead of a secondary maximum in the -band light-curve and no -band shoulder at all. It is better fit in the red with a 91bg template but not in the blue. However it is not as bright as typical super-Chandra (mag). An additional tentative super-Chandra candidate, SN 2009li, at (), and mag, did not have enough data to probe only the blue-bands.
3.5. SN 2006bt-like objects
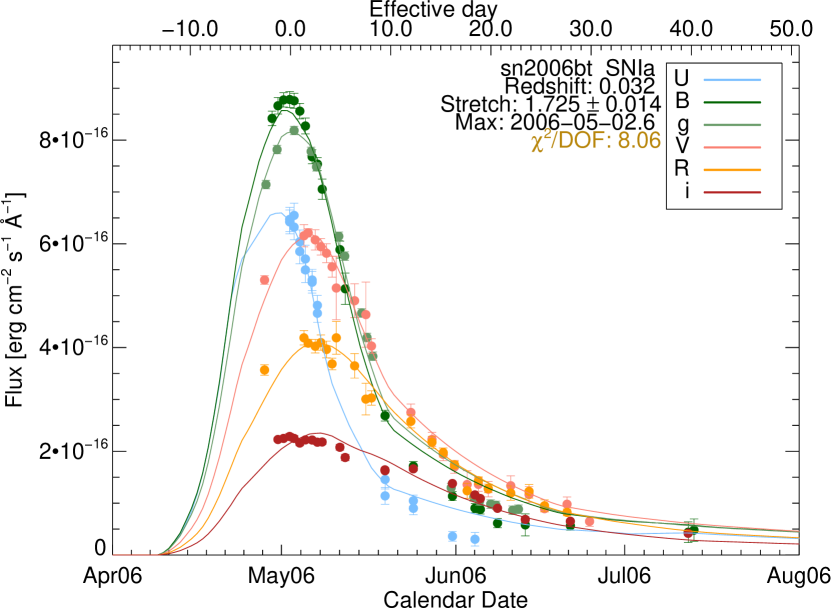
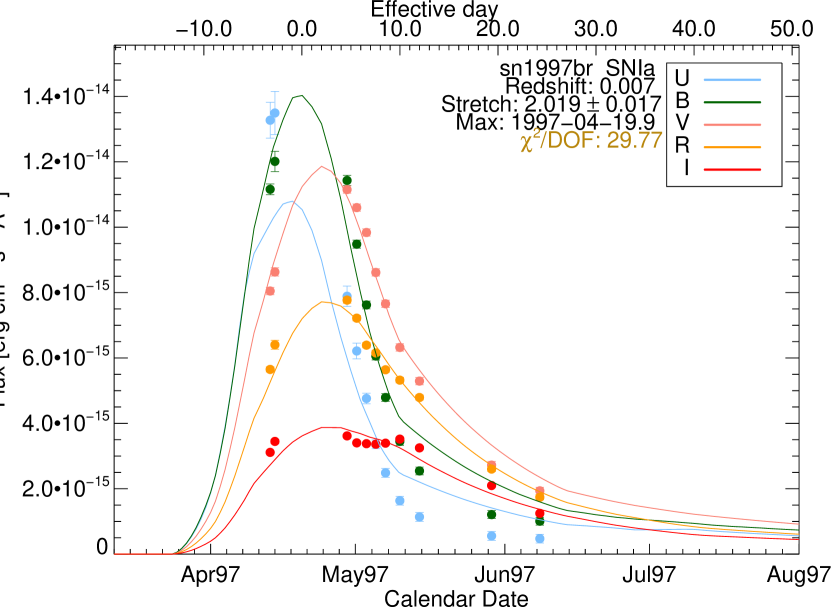
Some of the objects presented in last sections, like the latter super-Chandrasekhar candidate, SN 2002cs, are reminiscent of the peculiar SN Ia presented by Foley et al. (2010b), SN 2006bt. SN 2006bt has spectra similar to 91bg-like SNe Ia, red colors, no prominent secondary maxima and it occured in an early-type galaxy, yet it has a slowly declining light-curve. Taking a look at the fits of this SN, we see that although the overall fit is better with a normal template, the red-band part is better fit with a 91bg template. In fact, there are several objects for which the overall fit is better with a normal template but the red-band part is consistent with the 91bg template. All these objects are shown in blue in quadrant II of figure 3, as opposed to most SNe Iax and super-Chandrasekhar that, with better overall 91bg templates fit, are also in that same quadrant but in purple. Investigating these 9 objects, we find that 4 of them (SN 1986G, SN 2002dl, SN 2007fr and SN 2007hj), with (), are transitional objects between classical 91bg-like and normal SNe Ia. In fact, their spectra do have some SNID matches to 91bg-like objects as does the CfA classification. On the other hand, the other 5 objects (SN 1981D, SN 1989A, SN 1997br, SN 2001bf and SN 2006bt) have higher stretch () and red colors (). Of these SNe, the last three have sufficient coverage in and/or to inspect the behaviour more closely: SN 2001bf has a secondary maximum too close to the first maximum in the -band, SN 1997br shows the maximum much earlier almost forming a single elongated plateau with the first maximum, whereas for SN 2006bt this plateau is almost gone (see figure 9).
This means that, from the light-curve behaviour perspective, super-Chandrasekhar SNe Ia and these 06bt-like SNe Ia may form a same family going from the ones where the two maxima join in a long plateau in red bands, including typical super-Chandrasekhar SN 2006gz and SN 2009dc, but also SN 2002cs, then there is a transition of steeper and shorter plateau durations with SN 2006bt, to finish-up with SNe Ia that show a weak or very early secondary maximum like SN 1997br and SN 2001bf. These two last ones are more similar to normal SNe Ia and could be a link between super-Chandrasekhar and normal SNe Ia. In particular SN 2001bf is not as red as all the previous objects. Finally, it is interesting noting that SNID gives a normal Ia classification to SN 2001bf, a 91T-like classification to SN 1997br, and some matches to SN 2006bt are consistent with SN 1986G. This validates that the wide variety of objects that we find to be similar photometrically are partly similar spectroscopically as well.
Finally, the possible high-stretch 91bg-like candidate found in § 3.3, SN 2002es, has several interesting spectrocopic matches to SN 2009dc according to GELATO, whereas the one found in § 3.2, SN 1999bh, has SNID matches to SN 2006bt, making them other potential members of the 06bt-like instead of the PTF 10ops-like group. And some additional objects without enough data to do blue-band fits, SN 2003ae and SN 2007kd, are also typed as a photometric 91bg-like SN Ia according to criterion 1, while spectroscopic classificators indicate it to be a normal SN Ia. These ones could be like SN 2001bf.
3.6. Other peculiar SNe Ia
SN 2000cx-like SNe Ia: SN 2000cx-like objects are another class of peculiar, very rare SN Ia objects with only two reported members in the literature, SN 2000cx and SN 2013bh (Silverman et al., 2013a). We obtain very different results with our technique for both. SN 2000cx is quite compatible with a normal SN Ia template whereas SN 2013bh, having bad fits in both, is slightly more consistent with a 91bg-like SN Ia for the overall and blue-band fits but not for the red-band fits (one of the few objects in quadrant IV in figure 3). This SN has a blue color, lying far off from SNe Iax, 06bt-like objects and super-Chandrasekhar SNe Ia in the color-stretch diagram (figures 6). With such small statistics, it is hard to conclude much about them and their possible identification, however if such a blue object, , at mid-stretch, , passing criterion 1 but not 2, is found, it is probably a peculiar SN Ia that doesn’t fit any of the other categories, i.e. it is a SN 2000cx-like object.
Ca-rich transients: Ca-rich transients are an emerging class of objects, possibly thermonuclear in origin (Perets et al., 2010; Kasliwal et al., 2012). Only one of five, SN 2012hn, passes the light-curve cuts and has proper SiFTO fits. It is typed as a 91bg-like candidate with the overall fit but not enough pre-maximum data in the blue allows a further identification. If we were to force the fit anyway, we would obtain a better normal blue-band fit. Its extreme red color () is beyond the extreme cool 91bg-like SNe Ia and the most reddened SNe Ia in the top of figure 6. Additionally, if one relaxes the light-curve coverage cuts, one additional SN, PTF 09dav, a peculiar SN Ia with 91bg-like characteristics (Sullivan et al., 2011), has proper fits and is also typed as a 91bg-like SN Ia with also very red color (). It is then arguably possible to also include Ca-rich transients into the wide variety of peculiar SNe identified with the method presented here. An intriguing transient, SN 2006ha, has similar characteristics: it passes criterion 1 but it does not pass the cuts to check criterion 2, it has a very red color () and SNID and GELATO tend to find core-collapse or AGN matches.
4. Discussion
4.1. Core-collapse contamination
The versatibility of the photometric identification method we present may worry the reader as overly capable of fitting many different objects. What if CC SNe are also incorrectly typed as peculiar SNe Ia? We investigate this effect in this section by performing the same fits with SiFTO to a large sample of literature CC SNe (table LABEL:CCphot) and an additional sample of SNe II from Anderson et al. (2014). Of the 321 CC SNe in our sample, we obtain proper fits for 64 of them. Of these, only 11 have better overall normal template fits and 53 have better overall 91bg template fits. This is expected as 91bg-like SNe Ia are redder and more easily mistaken with CC SNe, notably SNe Ibc.
To deal with CC contamination, we perform several cuts based on the fit quality in the different filter sets, as well as on the magnitude-color relation shown in figure 7. In every case, we use a methodology similar to the one presented in section 2.3 based on the FoM(Ia) and FoM(pec/91bg) to select the best cuts that optimize the number of normal and peculiar SNe Ia correctly tagged and minimize the number of CC SNe falsely tagged. First, for those objects, Ia and CC, having better overall normal template fits, we explore cuts in the fit quality in the range finding a maximum FoM(Ia) at (see blue line in figure 10). This cut eliminates 4 CC SNe and no SN Ia. Similarly for objects with better overall 91bg template fits, we search for an optimum cut finding (orange line in figure 10). This eliminates 17 CC SNe and 3 SNe Ia.
In principle, we could do an equivalent analysis for the fit qualities of blue- and red-band fits searching for cuts that maximize the FoM, but we find that the final FoM does not improve considerably respect to the overall template fits. On the other hand, we can use the fact that many CC SNe lie outside the typical magnitude relations in figure 7. But most effectively, as previously investigated by several authors (e. g Poznanski et al., 2002; Perets et al., 2011a), the evolution of color and the use of color-color diagrams can be a powerful discriminator between SN groups. Since SiFTO does not enforce any color law for SNe Ia in the fit and allows indepentent flux factors for each band, we study the evolution of , , and colors obtained with the best SiFTO fit. We find that a good discriminator is vs at 10 days after -band maximum. As shown in the right of figure 10, CC SNe are redder in and bluer in than peculiar and 91bg-like SN Ia candidates and more so than normal SNe Ia. Requiring SN Ia candidates to lie underneath the solid line rejects 26 CC-SNe with only two peculiar SN Ia discarded. These boundaries are calculated similarly as other cuts: we vary the vertical and diagonal lines until we find a maximum FoM(Ia). Our final sample contains 1 CC contaminant that is typed as a normal SN Ia according to the overall fit and 4 that are tagged as 91bg-like SNe Ia according to the overall fit. All of these are stripped-envelope SNe as expected.
We obtain a final efficiency of for normal SNe Ia and a purity of from CC SNe and other peculiar SNe Ia resulting in a FoM(Ia). This is comparable to other photometric typing techniques as will be shown in section 4.4. For 91bg-like SNe Ia/peculiar SNe Ia we obtain and a purity of from CC SNe and normal SNe Ia resulting in a FoM(pec/91bg). These numbers will be discussed in next section, where we investigate how strongly the chosen boundaries and cuts depend on the training sample and how they affect the FoMs.
4.2. Bootstrap analisys
The method we use and the boundaries we define are very sensitive to the sample we use to train the technique. In order to test the importance of this, we perform a bootstrap analysis (Efron, 1982) in which different random samples are drawn from the original population to re-do the analysis and calculate the best FoM regions. The bootstrap is done for all SNe Ia and all CC SNe, where objects may be absent in a given iteration and others can also be repeated. For every one of the 200 realizations we re-calculate the best cuts presented in sections 2.3 and 4.1 by finding the maximum FoM box to divide better blue/red-band normal and 91bg template fits (orange box in figure 3). We can also find the best cuts for the overall normal and 91bg template fits to select SNe Ia against CC SNe (lines in figure 10) for each iteration, as well as the best factor multiplying the magnitude-color median standard deviation to reject CC contamination (dashed lines in figure 7). The final cuts and errors are calculated taking the mean and standard deviation of all realizations and are summarized in table 1. The FoMs for each sample with these respective cuts are also presented and the error on the FoM is the FoM calculated at the respective sigma cuts. We emphasize that the quoted FoMs are not the maximum ones, only the ones based on average cuts. Contamination is taken from CC SNe but also from any other SN Ia sub-sample.
We obtain a robust classification for normal SNe Ia with very low contamination in all realizations of the bootstrap analysis. The peculiar SN Ia identification is more dependent on the sample used for the training and in all cases contains at least 7 stripped-envelope CC SNe that lower the purity. Interestingly, these are all classified as 91bg-like objects based on overall, blue- and red-band fits. So, based on the fit quality in different bands, CC SNe are more easily mistaken with 91bg-like than SNe Iax. However, in the magnitude-color relation, SNe Iax can have extremely low magnitudes for their colors, emulating CC SNe. This means that if no magnitude-color relation for objects with overall 91bg template fits is used, the technique is better at classifying SNe Iax whereas if one enforces such a cut, then 91bg-like objects will be weighted higher. We note that in the case of a pure SN Ia sample, the blue/red-band cut of section 2.3 is sufficient to differentiate between the two: 91bg-like and SNe Iax (and super-Chandra with distinct high stretches).
4.3. Outlook for high-redshift typing
The technique presented can in principle also be used at higher redshifts. SiFTO has been shown to be a robust light-curve fitter across a wide range of redsfhits (e.g. Guy et al., 2010; Conley et al., 2011) that works directly with the SED templates in the observer frame, provided an input redshift. For large surveys this redshift can come from template fitting to multiband photometry from the host galaxy (e.g. Ilbert et al., 2009), as well as from direct SN light-curve fits (e.g. Palanque-Delabrouille et al., 2010). Sullivan et al. (2006) and González-Gaitán et al. (2011) used a light-curve fitter similar to SiFTO with an additional redshift parameter, that also allows the use of multiple templates such as the 91bg we use here. The particular “blue” and “red” filter sets will need to be adjusted due to redshift effects. For example, while at , a “blue”filter set consists of filters ug and a red filter set of riz, at these will be ugr and iz respectively, while at they would move to ugri and , respectively. Additionally, the cadence and signal-to-noise of the data will affect the quality of the light-curve fit and could induce mistakes in the typing as well. These effects should be considered when applying this technique to high- surveys; and they will be investigated in a future work.
| CUT | NORMAL SNe Ia | PECULIAR SNe Ia | 91BG-LIKE SNe Ia | SNe Iax | SUPER-CH SNe Ia | CC SNe |
|---|---|---|---|---|---|---|
| None | 602 | 59 | 35 | 13 | 5 | 321 |
| SiFTO fit & LC coverage & | 322 | 48 | 29 | 10 | 4 | 64 |
| † | 304 | 45 | 29 | 8 | 4 | 43 |
| Color-color relation | 299 | 44 | 29 | 7 | 2 | 17 |
| 263 | 31 | 19 | 6 | 2 | 5 | |
| Efficiency | - | |||||
| Purity | - | |||||
| FoM | - |
-
Peculiar SNe Ia include 91bg-like, SNe Iax, super-Ch, 00cx-like and Ca-rich SNe Ia.
-
Super-Ch candidates by Scalzo et al. (2012) not included.
-
†
This cut is applied to objects with better overall 91bg template fits and it requires enough data coverage in blue and red bands. Objects passing it are 91bg-like candidates and the others are other peculiar SNe Ia.
4.4. Comparison to other typing techniques
Photometric SN classification is an active area of research. Many early studies, ultimately aimed at cosmology, have focussed on normal SN Ia identification either for prioritization in spectral follow-up (Dahlén & Goobar, 2002; Sullivan et al., 2006) or posterior identification (e.g Riess et al., 2004; Barris & Tonry, 2006) of real datasets, even in the absence of spectroscopic confirmation (Bazin et al., 2011; Sako et al., 2011b; Perrett et al., 2012; Olmstead et al., 2014), or of simulated samples (Gong et al., 2010; Gjergo et al., 2013). These techniques most often use model template fits to the light-curve but also color-color diagrams, as well as host galaxy redshift prior information. The study of multiple SN types, including CC-SN classification, is more challenging given the wide diversity of light-curve behavior compared to normal SNe Ia. Building on the early efforts by Pskovskii (1978, 1984), more recent methods are: color-color evolution (Poznanski et al., 2002), color-magnitude evolution (Johnson & Crotts, 2006), Bayesian template fitting (Poznanski et al., 2007), Bayesian classification schemes (Kuznetsova & Connolly, 2007), Fuzzy Set Theory algorithms (Rodney & Tonry, 2009), boosting and kernel density estimation techniques (Newling et al., 2011), kernel Principal Component Analsys (Ishida & de Souza, 2013), a semi-supervised learning (Richards et al., 2011) and neural networks (Karpenka et al., 2013).
| Technique | Efficiency | Purity | FoM |
|---|---|---|---|
| () | () | () | |
| Poznanski et al. (2007) | 97 | 77-91 | 75-88 |
| Rodney & Tonry (2009) | 94 | 98 | 92 |
| Sako et al. (2011b) | 88-92 | 87-94 | 82-86 |
| Olmstead et al. (2014) | 85-92 | 89-93 | 79-83 |
| This work | 82 | 99 | 81 |
A direct comparison to these methods is difficult given the diversity of training samples (although see Kessler et al. 2010a). Nevertheless, we quote some of these studies final efficiencies, purities and Figures of Merit for normal SN Ia classification in table 2. We caution that, unlike our current study, most of these studies have samples with a wide redshift range, where factors like signal-to-noise become important. It is evident that the normal SN Ia classification is quite robust for all different techniques providing clean samples, % (see also Gjergo et al. 2013; Ishida & de Souza 2013; Karpenka et al. 2013). More challenging is the identification of peculiar groups of SNe Ia, which are more easily mistaken with CC-SNe, and the present work is a first step in that direction.
4.5. Photometric “dromedary” vs “camel” SN Ia class
A large range of spectroscopic peculiar SNe Ia are found here to have many similarities in their light-curve behaviour, resembling those of typical 91bg-like SNe Ia. SNe Iax and super-Chandrasekhar SNe Ia are better fit with a 91bg-like template with SiFTO. This trend is stronger in the redder bands, where post-maximum shoulders and secondary maxima are absent for all of these transients. SN 2006bt-like objects also resemble these, having better red-band 91bg template fits. Grouping them all together, we dub them the photometric “dromedary” class, as opposed to classical normal SNe Ia or the photometric “camel” class. For all of these “dromedary” objects, SNe Iax, 06bt-like and super-Chandra, a progressive increase in fit quality (decrease in ) is seen as one moves from short towards longer wavelengths when fitting the light-curves with a 91bg template. The opposite happens when fitting with the normal SN Ia template. If one were to order these groups according to light-curve similarities with SiFTO fit quality, one would have: 91bg-like Iax super-Chandra 06bt-like normal SNe Ia.
Furthermore, one can see that the objects of this photometric “dromedary” class (excluding 06bt-like SNe), besides being different from the normal SNe Ia according to two template fits, have different color-stretch (fig. 6) and magnitude-stretch (fig. 7a) relations than normal SNe Ia. In particular they are consistently redder and fainter, i.e. for a particular stretch, different colors and magnitudes are predicted for a normal “camel” SN Ia and a “dromedary” SN. This photometric closeness opens up the question if such a variety of SNe Ia is actually linked to some common physical process, if they arise from similar explosion mechanisms and even if their progenitors are connected. We examine this further in next sections.
4.5.1 Cluster Analysis
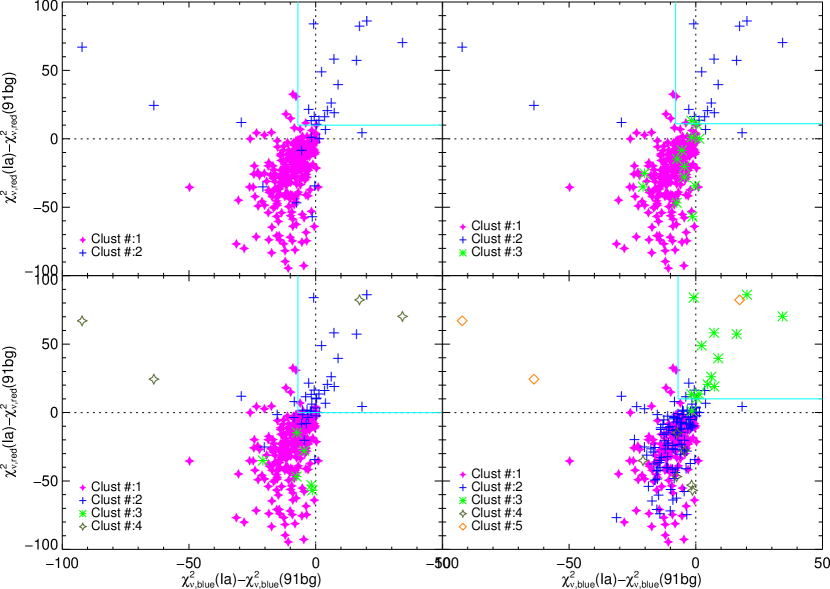
To investigate the hypothesis of physical commonality of SNe in the “dromedary” class, we perform a cluster analysis (-means clustering Everitt, 1993) in which, given certain SN characteristics, groups of objects more similar to each other than to the ones of other groups are searched. We provide standardized SiFTO stretch, color, absolute magnitude and for overall, blue and red-band fits with both normal and 91bg templates for a total of 12 variables for each SN. We present the results of the cluster analysis in figure 11 requiring different cluster groups (from top left to bottom right). No matter the number of cluster groups, in each case we observe clear separations between standard SNe Ia and 91bg-like SNe Ia in the top right area of each plot. Most of these SNe in the first quadrant are, as shown in figure 3, 91bg-like objects. However, we find that most SNe Iax also make part of this cluster group (5 of 8) strengthening the bond between the two peculiar sets. Super-Chandrasekhar and 06bt-like SNe Ia, on the contrary, are always grouped together with normal SNe Ia. This indicates that, even though their light-curves have similarities to 91bg-like objects in the redder bands, overall they are more akin to normal SNe Ia, as one would expect. We note that in the first cluster analysis, 5 quite normal SNe Ia are in the 91bg-like group, this is due to their extreme red colors, e. g. SN 2006X and SN 2003cg, and are put in a different group once we add more cluster groups (or if we do not include color as an input variable). This shows that their colors are of a different nature (interstellar or circumstellar rather than intrinsic) and that the cluster analysis can separate these effects. With , the peculiar SN 2005hk, SN 2002es and some extreme cool 91bg-like are grouped together since they lie off the bulk of the population.
For each cluster analysis, we show the box that separates best the objects in the cluster group similar to 91bg-like from the rest of the groups (cyan solid lines). This is done similarly to section 2.3 by maximizing the FoM of this cluster group. We find boxes ( and for each respectively) that compare very well with the box in figure 3 based on the FoM of known 91bg-objects. This is a strong confirmation of the validity of our technique with an independent and robust appraoch from data mining. Furthermore, the appearance of this separate region in all cluster analysis strongly supports the hypothesis of clear light-curve differences between two SN Ia populations: normal and 91bg-like/Iax SNe. To check for dependence on the sample, we again perform a bootstrap analysis, similar to section 4.2, finding full consistency with our results. We obtained following 91bg-like boxes based on the mean and standard deviation of all 200 realizations: and for each respectively.
4.5.2 Environments and progenitors
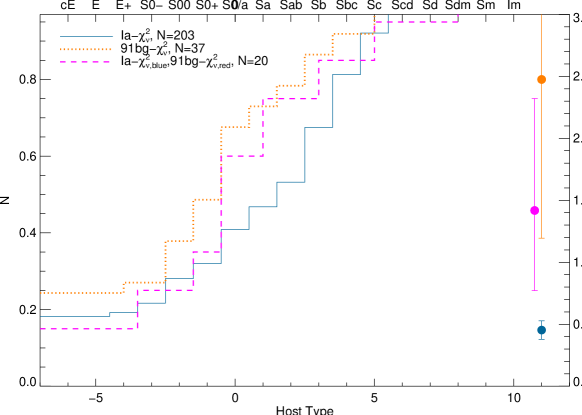
From another persepctive, the environments of different SNe Ia tell us important clues about their progenitors. Although classical 91bg-like objects are particuarly inclined to happen in elliptical and passive star-forming environments (e. g. Howell, 2001; González-Gaitán et al., 2011), PTF 10ops occured far away from its host (Maguire et al., 2011), SNe Iax seem to prefer late-type galaxies (Lyman et al., 2013; Foley et al., 2013) and super-Chandrasekhar appear in various environments with possible preference for low-mass galaxies (Taubenberger et al., 2011). In figure 12, we show the morphological type of a large subset of our sample binned in T-types from -5 to 10, from E/S0 galaxies to spiral and irregular galaxies. Performing a Kolmogorov-Smirnov (KS) test shows that the normal SN Ia distribution (solid blue) is significantly different from the distribution of photometric 91bg-like candidates according to overall, blue/red band fits (dotted orange) with a probability P(KS). On the other hand, other peculiar SNe Ia according to the overall but not blue or red-band fits, i. e. objects such as PTF 10ops-like, SNe Iax and super-Chandra together (dashed purple) are not statistically different from normal SNe Ia (P(KS)), nor from 91bg-like candidates (P(KS)). In the right bin of the figure we show that the ratio of passive to star forming hosts for the photometric normal SN Ia population (blue circle) is much lower than for the photometric 91bg-like candidates (orange cirle), which is a well-known relation. Interestingly, the ratio of the other peculiar SNe Ia (purple circle) lies in between those two samples. A Fisher exact test (Fisher, 1922) gives a similar result to the KS test: the number ratio of photometric normal SNe Ia in passive to star-forming galaxies is statistically different from the ratio of photometric 91bg-like SNe Ia with a probability P(F), whereas the ratio for peculiar SNe Ia in passive to star-forming galaxies is not statistically different from the ratio for normal SNe Ia (P(F)), nor from the ratio of 91bg-like SNe Ia (P(F)). Albeit with low statistics, this may point towards the peculiar SN Ia group being transitional in progenitor characteristics between normal and 91bg-like, or more likely, it evidences the presence of a mixed group with transitional objects, some 91bg-like and some normal SNe Ia.
From a theoretical standpoint, SNe Iax, SN 1991T and super-Chandra SNe Ia all have hot, highly ionized photospheres as has been shown spectroscopically (Foley et al., 2013). In the scenario of Kasen (2006) and Kasen & Woosley (2007), the secondary maximum at long wavelengths can be a direct consequence of the iron group abundance stratification: if the SN has the iron concentrated in the inner region, the recombination of doubly ionized Fe and Co into singly ionized will only happen at later times, redistributing radiation from the blue to the red and creating the secondary maximum. The absence of secondary maxima in red bands for these hot objects can thus be explained with high mixing of 56Ni in the outer layers (see also Scalzo et al., 2012) and argues against a delayed detonation mechanism. In this same framework, the absence of secondary maxima in 91bg-like SNe Ia is explained with quite an opposite argument: these are very cool objects and the recombination therefore sets on much earlier making the first maximum coincide with the second. So, in one case it’s mixing and in the other temperature that would explain the post-maximum red band behaviour. Although 91bg-like objects are spectroscopically different to the other peculiar sub-classes, there are some intriguing transitional objects between 91bg-like and Iax with spectroscopic similarities (Ganeshalingam et al., 2012) that may prove a continous set of explosion mechanisms.
Regarding the progenitor systems, the differences among these peculiar SNe Ia are strengthened. Linking classical 91bg-like and high-stretch PTF 10ops-like SN Ia progenitors, Taubenberger et al. (2013) argue that the nebular spectra of the high-stretch 91bg-like SN 2010lp presents clear evidence for a low density in the core that is only consistent with a violent merger of two CO-WDs (Kromer et al., 2013b). Pakmor et al. (2013), on the other hand, show that 91bg-like explosions can be reproduced via violent mergers of a CO-WD and a He-WD. Super-Chandrasekhar explosions in turn typically invoke slow double-degenerate mergers of massive CO-WDs (e. g. Hachinger et al., 2012). These all invoke variate scenarios of double-degenerate systems. On the contrary, the most favoured SN Iax progenitor scenarios are single-degenerate in origin: double detonations of a CO-WD and a He-star (Foley et al., 2013; Wang et al., 2013) or pure deflagrations of Chandrasekhar mass WDs (McClelland et al., 2010; Jordan et al., 2012; Kromer et al., 2013a). As for normal SNe Ia, another mechanism such as the prototypical single-degenerate delayed detonation (e. g. Blondin et al., 2013; Sim et al., 2013) or even double-degenerate mergers with higher WD masses (Pakmor et al., 2013) could explain the differences with the others SNe. Sub-Chandrasekhar explosions have also gained renewed popularity through the double detonation scenario arising from a shell detonation (Woosley & Weaver, 1986; Bildsten et al., 2007; Waldman et al., 2011; Fink et al., 2010), or via violent mergers of two WDs (Pakmor et al., 2012), or even through WD collisions (Benz et al., 1989; Rosswog et al., 2009; Raskin et al., 2009).
Putting this information together, although photometrically, the “dromedary” SN Ia class presents interesting common properties among its variate members, such as red color and lack of secondary maximima at longer wavelengths, a cluster analysis suggests that super-Chandrasekhar and 06bt-like are more similar to normal SNe Ia. SNe Iax and 91bg-like SNe are similar photometrically between each other, but they are known to have spectroscopic features that differ as do their environments. None of the members of the dromedary class can be well explained with a delayed detonation explosion, yet no other clear theoretical link exist among all members of this class. We therefore conclude that although there probably is some common physical mechanism driving the similar behaviour in the cooler redder part of their emission at epochs after maximum, their progenitor and explosion are not necessarily similar in nature.
4.6. Recipe to photometrically identify different SN Ia sub-groups
In this paper we have presented a photometric algorithm to identify normal SNe Ia and 91bg-like SNe Ia, the classical fast ones but also the new class of slowly declining 91bg-like SNe Ia such as PTF 10ops and SN 2010lp. The method also allows us to identify numerous peculiar SNe Ia, particularly SNe Iax, super-Chandrasekhar SNe Ia and SN 2006bt-like objects. For it to work at best, we recommend photometry before and after maximum light in several bands, in at least one blue and one red band. At higher distances, where the emission is redshifted, these bands will need to be adjusted. Here is a step-by-step recipe to classify the various events:
-
•
SiFTO fits: Fit each SN with SiFTO using the two templates, normal and 91bg. Also fit each SN with the two templates using only blue-bands and only red-bands.
-
•
CC contamination: Use cuts to remove CC contamination. For our bootstrapped sample: and keeps SNe Ia.
-
•
Normal SNe Ia: Objects passing the previous cut and with are normal SN Ia candidates with high confidence. One can reduce the CC contamination of all SNe Ia further with cuts in color-color diagrams. We use and . The selected sample may have a very small fraction of objects being of CC.
-
•
91bg-like SNe Ia: Objects that have better overall, blue-band and red-band 91bg template fits (with a definition of ) are considered 91bg-like SN Ia candidates. If they have low-stretch, i.e. , then they are the classical 91bg-like objects, at higher stretch (and ), they are like PTF 10ops or SN 2010lp.
-
•
Super Chandrasekhar SNe Ia: Those objects with better overall 91bg fits but better normal blue or red-bands fits, that also have very wide light-curves, i.e. (or ), are typical super-Chandrasekhar candidates.
-
•
SNe Iax: SNe Ia with better overall 91bg fits but better normal blue- or red-bands fits, and narrower light-curves than in the previous point are probable SNe Iax. There is a possibility that some of these are objects like SN 2002es, of unkown origin or transitional objects, i.e. maybe 91bg-like, maybe SN 2006bt-like, in which case there is no way to disentangle between those two groups according to our method. Given the numbers, it is more probable ( with the current sample) that such an SN will be a type Iax SN.
-
•
SN 2000cx-like SNe Ia: If the SN Ia has better overall 91bg but worse red- or blue-band fit, and it additionally has a blue color, , it is most probably not a 91bg-like high-stretch SN Ia nor a SN Iax but a peculiar SN 2000cx object, or rather a SN 2013bh-like object.
-
•
SN 2006bt-like SNe Ia: Finally, objects with better overall normal template fit but better red-band 91bg fits, and wider light-curves () are possibly a group similar to SN 2006bt. These could be a link between normal and super-Chandrasekhar SNe Ia.
5. Summary
We have investigated the light-curves of a large sample of low- SNe Ia with the light-curve fitter SiFTO and two spectral template series for normal and for SN 1991bg-like SNe Ia. By comparing the fit with the two templates in different filter sets, we are able to photometrically identify typical 91bg-like SNe Ia and also those spectroscopically similar but with wider light-curves such as recent PTF 10ops and SN 2010lp. We confirm the robustness of the technique comparing our photometric typing technique with different spectroscopic classificators such as SNID. We find that for standard fast-evolving 91bg-like SNe Ia the stretch obtained with a 91bg template fit, , is better at describing this sub-group than a normal template stretch, . The existence of two groups is strengthened by a cluster analysis that suggests two different populations based on a set of SN photometric properties. Despite this, we point out to the smooth transition between the two and the existence of transitional objects between normal and 91bg-like SNe. Regarding PTF 10ops-like transients, i.e. 91bg-like of wide light-curves, we find 3-4 possible candidates in the literature, confirming the rarity or different environment of such events.
Furthermore, we find a range of transient light-curves like SNe Iax, super-Chandrasekhar SNe Ia and SN 2006bt-like that are more similar to a 91bg-like than a normal template to varying degrees at longer wavelengths. All these “dromedary” objects lack the characteristic prominent secondary maxima or shoulders seen in red filters of classical SNe Ia and could suggest similar physical processes. Using fit qualities in the different filter sets, we are able to disentangle most of them from typical 91bg-like (which have better 91bg template fits in both blue and red filter sets) and normal SNe Ia (which have worse 91bg template fits in all filter sets). Of these peculiar objects, SNe Iax generally resemble 91bg-like objects more closely, also in their absolute magnitudes, and some of them can therefore not be differentiated with our technique. The cluster analysis also joins most of SNe Iax with the 91bg-like group, showing that without spectroscopic properties, the light-curve differences are not strong enough to form two different groups. Super-Chandra SNe Ia, on the other hand, are clearly distinct in several regards from other peculiar SNe Ia resembling more normal SNe Ia, and it is easy to select them out. We propose an interesting relation between super-Chandra and SN 2006bt-like SNe Ia, with the latter being a less extreme case of the most luminous of SNe Ia, and possibly even also a link with SNe Iax and slowly declining 91bg-like objects.
We have presented a simple yet powerful technique to identify different sub-groups of SNe Ia in a purely photometric manner. With a competitive FoM(Ia), we have shown that it robustly classifies normal SNe Ia with very little contamination from CC SNe, but also from other peculiar SNe Ia that are unsuit for cosmological studies. Alternatively, it also allows to search for these peculiar SNe Ia to investigate them further: 91bg-like objects, SNe Iax and even super-Chandrasekhar SNe. Thus, this method is applicable for photometric classification of transients in coming wide field large surveys such as LSST, and to prioritize the study of these interesting peculiar objects, or, on the other hand, to reject them for studies of purely normal SNe Ia.
Acknowledgements
We thank the anonymous referee for useful comments that improved this work. This paper has made use of a large public data set coming from the long lasting effort of a variety of surveys and groups, for which we are extremely thankful. The work of CSP has been supported by the National Science Foundation under grants AST 0306969, AST 0607438 and AST 1008343. The CfA Supernova Archive is funded in part by the National Science Foundation through grant AST 0907903. This research has also made use of the NASA/IPAC Extragalactic Database (NED) which is operated by the Jet Propulsion Laboratory, California Institute of Technology, under contract with the National Aeronautics.
S.G., F.B. and L.G. acknowledge support from CONICYT through FONDECYT grants 3130680, 3120227 and 3140566, respectively. Support for S.G., G.P., F.F, C.G, F.B., L.G., M.H. and T.J. is provided by the Ministry of Economy, Development, and Tourism’s Millennium Science Initiative through grant IC12009, awarded to The Millennium Institute of Astrophysics, MAS.
References
- Agnoletto et al. (2009) Agnoletto, I. et al. 2009, ApJ, 691, 1348
- Altavilla et al. (2004) Altavilla, G. et al. 2004, MNRAS, 349, 1344
- Anderson et al. (2014) Anderson, J. P. et al. 2014, ApJ, 786, 67
- Anupama et al. (2005) Anupama, G. C., Sahu, D. K., & Jose, J. 2005, A&A, 429, 667
- Barbon et al. (1989) Barbon, R., Ciatti, F., Iijima, T., & Rosino, L. 1989, A&A, 214, 131
- Barbon et al. (1982) Barbon, R., Ciatti, F., & Rosino, L. 1982, A&A, 116, 35
- Barris & Tonry (2006) Barris, B. J. & Tonry, J. L. 2006, ApJ, 637, 427
- Bazin et al. (2011) Bazin, G., Ruhlmann-Kleider, V., Palanque-Delabrouille, N., Rich, J., Aubourg, E., Astier, P., Balland, C., Basa, S., et al. 2011, A&A, 534, A43
- Benetti et al. (1991) Benetti, S., Cappellaro, E., & Turatto, M. 1991, A&A, 247, 410
- Benetti et al. (1994) Benetti, S. et al. 1994, A&A, 285, 147
- Benetti et al. (2001) —. 2001, MNRAS, 322, 361
- Benetti et al. (2004) —. 2004, MNRAS, 348, 261
- Benetti et al. (2005) —. 2005, ApJ, 623, 1011
- Benetti et al. (2013) —. 2013, ArXiv e-prints
- Benz et al. (1989) Benz, W., Thielemann, F.-K., & Hills, J. G. 1989, ApJ, 342, 986
- Bildsten et al. (2007) Bildsten, L., Shen, K. J., Weinberg, N. N., & Nelemans, G. 2007, ApJ, 662, L95
- Biscardi et al. (2012) Biscardi, I. et al. 2012, A&A, 537, A57
- Blanton et al. (1995) Blanton, E. L. et al. 1995, AJ, 110, 2868
- Blondin et al. (2013) Blondin, S., Dessart, L., Hillier, D. J., & Khokhlov, A. M. 2013, MNRAS, 429, 2127
- Blondin & Tonry (2007) Blondin, S. & Tonry, J. L. 2007, ApJ, 666, 1024
- Blondin et al. (2012) Blondin, S. et al. 2012, AJ, 143, 126
- Bose et al. (2013) Bose, S. et al. 2013, MNRAS, 433, 1871
- Botticella et al. (2009) Botticella, M. T. et al. 2009, MNRAS, 398, 1041
- Bouchet et al. (1989) Bouchet, P., Slezak, E., Le Bertre, T., Moneti, A., & Manfroid, J. 1989, A&AS, 80, 379
- Branch et al. (2006) Branch, D. et al. 2006, PASP, 118, 560
- Brown et al. (2012) Brown, P. J., Dawson, K. S., Harris, D. W., Olmstead, M., Milne, P., & Roming, P. W. A. 2012, ApJ, 749, 18
- Brown et al. (2007) Brown, P. J. et al. 2007, ApJ, 659, 1488
- Brown et al. (2009) —. 2009, AJ, 137, 4517
- Bufano et al. (2012) Bufano, F. et al. 2012, ApJ, 753, 67
- Cadonau & Leibundgut (1990) Cadonau, R. & Leibundgut, B. 1990, A&AS, 82, 145
- Candia et al. (2003) Candia, P. et al. 2003, PASP, 115, 277
- Cao et al. (2013) Cao, Y. et al. 2013, ApJ, 775, L7
- Cappellaro et al. (1995) Cappellaro, E., Danziger, I. J., della Valle, M., Gouiffes, C., & Turatto, M. 1995, A&A, 293, 723
- Chakradhari et al. (2014) Chakradhari, N. K., Sahu, D. K., Srivastav, S., & Anupama, G. C. 2014, MNRAS, 443, 1663
- Chornock et al. (2014) Chornock, R. et al. 2014, ApJ, 780, 44
- Chugai et al. (2005) Chugai, N. N. et al. 2005, Astronomy Letters, 31, 792
- Clocchiatti et al. (2011) Clocchiatti, A., Suntzeff, N. B., Covarrubias, R., & Candia, P. 2011, AJ, 141, 163
- Conley et al. (2008) Conley, A. et al. 2008, ApJ, 681, 482
- Conley et al. (2011) —. 2011, ApJS, 192, 1
- Contreras et al. (2010) Contreras, C. et al. 2010, AJ, 139, 519
- Corsi et al. (2011) Corsi, A. et al. 2011, ApJ, 741, 76
- Dahlén & Goobar (2002) Dahlén, T. & Goobar, A. 2002, PASP, 114, 284
- D’Andrea et al. (2010) D’Andrea, C. B. et al. 2010, ApJ, 708, 661
- Dessart et al. (2013) Dessart, L., Blondin, S., Hillier, D. J., & Khokhlov, A. 2013, ArXiv e-prints
- Dessart et al. (2008) Dessart, L. et al. 2008, ApJ, 675, 644
- Di Carlo et al. (2002) Di Carlo, E. et al. 2002, ApJ, 573, 144
- Dilday et al. (2012) Dilday, B. et al. 2012, Science, 337, 942
- Drout et al. (2013) Drout, M. R. et al. 2013, ApJ, 774, 58
- Drout et al. (2014) —. 2014, ArXiv e-prints
- Efron (1982) Efron, B. 1982, The Jackknife, the Bootstrap and Other Resampling Plans (Society of Industrial and Applied Mathematics CBMS-NSF Monographs, 38)
- Elias-Rosa et al. (2006) Elias-Rosa, N. et al. 2006, MNRAS, 369, 1880
- Elias-Rosa et al. (2008) —. 2008, MNRAS, 384, 107
- Everitt (1993) Everitt, B. S. 1993, Cluster Analysis (New York: Halsted Press)
- Filippenko et al. (1992a) Filippenko, A. V. et al. 1992a, ApJ, 384, L15
- Filippenko et al. (1992b) —. 1992b, AJ, 104, 1543
- Fink et al. (2010) Fink, M., Röpke, F. K., Hillebrandt, W., Seitenzahl, I. R., Sim, S. A., & Kromer, M. 2010, A&A, 514, A53
- Fisher (1922) Fisher, R. A. 1922, Journal of the Royal Statistical Society, 85, 87
- Folatelli et al. (2006) Folatelli, G. et al. 2006, ApJ, 641, 1039
- Folatelli et al. (2013) —. 2013, ApJ, 773, 53
- Foley et al. (2003) Foley, R. J. et al. 2003, PASP, 115, 1220
- Foley et al. (2010a) —. 2010a, AJ, 140, 1321
- Foley et al. (2010b) —. 2010b, ApJ, 708, 1748
- Foley et al. (2012) —. 2012, ApJ, 744, 38
- Foley et al. (2013) —. 2013, ApJ, 767, 57
- Foley et al. (2014) —. 2014, MNRAS, 443, 2887
- Ford et al. (1993) Ford, C. H. et al. 1993, AJ, 106, 1101
- Fraser et al. (2010) Fraser, M. et al. 2010, ArXiv e-prints
- Fraser et al. (2013) —. 2013, MNRAS, 433, 1312
- Gal-Yam et al. (2002) Gal-Yam, A., Maoz, D., & Sharon, K. 2002, MNRAS, 332, 37
- Gal-Yam et al. (2009) Gal-Yam, A. et al. 2009, Nature, 462, 624
- Gal-Yam et al. (2011) —. 2011, ApJ, 736, 159
- Galama et al. (1998) Galama, T. J. et al. 1998, Nature, 395, 670
- Gandhi et al. (2013) Gandhi, P. et al. 2013, ApJ, 767, 166
- Ganeshalingam et al. (2010) Ganeshalingam, M. et al. 2010, ApJS, 190, 418
- Ganeshalingam et al. (2012) —. 2012, ApJ, 751, 142
- Garnavich et al. (2004) Garnavich, P. M. et al. 2004, ApJ, 613, 1120
- Gehrels (1986) Gehrels, N. 1986, ApJ, 303, 336
- Germany et al. (2000) Germany, L. M., Reiss, D. J., Sadler, E. M., Schmidt, B. P., & Stubbs, C. W. 2000, ApJ, 533, 320
- Gezari et al. (2010) Gezari, S. et al. 2010, ApJ, 720, L77
- Gjergo et al. (2013) Gjergo, E., Duggan, J., Cunningham, J. D., Kuhlmann, S., Biswas, R., Kovacs, E., Bernstein, J. P., & Spinka, H. 2013, Astroparticle Physics, 42, 52
- Goldhaber et al. (2001) Goldhaber, G. et al. 2001, ApJ, 558, 359
- Gong et al. (2010) Gong, Y., Cooray, A., & Chen, X. 2010, ApJ, 709, 1420
- González-Gaitán et al. (2011) González-Gaitán, S. et al. 2011, ApJ, 727, 107
- Gutierrez et al. (2014) Gutierrez, C. P. et al. 2014, in preparation
- Guy et al. (2007) Guy, J. et al. 2007, A&A, 466, 11
- Guy et al. (2010) —. 2010, A&A, 523, A7+
- Hachinger et al. (2012) Hachinger, S., Mazzali, P. A., Taubenberger, S., Fink, M., Pakmor, R., Hillebrandt, W., & Seitenzahl, I. R. 2012, MNRAS, 427, 2057
- Hachisu et al. (1996) Hachisu, I., Kato, M., & Nomoto, K. 1996, ApJ, 470, L97+
- Hamuy (2003) Hamuy, M. 2003, ApJ, 582, 905
- Hamuy et al. (1990) Hamuy, M., Suntzeff, N. B., Bravo, J., & Phillips, M. M. 1990, PASP, 102, 888
- Hamuy et al. (1991) Hamuy, M. et al. 1991, AJ, 102, 208
- Hamuy et al. (1994) —. 1994, AJ, 108, 2226
- Hamuy et al. (1996a) —. 1996a, AJ, 112, 2408
- Hamuy et al. (1996b) —. 1996b, AJ, 112, 2398
- Hamuy et al. (2001) —. 2001, ApJ, 558, 615
- Harutyunyan et al. (2008) Harutyunyan, A. H. et al. 2008, A&A, 488, 383
- Hendry et al. (2006) Hendry, M. A. et al. 2006, MNRAS, 369, 1303
- Hicken et al. (2007) Hicken, M. et al. 2007, ApJ, 669, L17
- Hicken et al. (2009) —. 2009, ApJ, 700, 331
- Hicken et al. (2012) —. 2012, ApJS, 200, 12
- Ho et al. (2001) Ho, W. C. G. et al. 2001, PASP, 113, 1349
- Howell (2001) Howell, D. A. 2001, ApJ, 554, L193
- Howell et al. (2006) Howell, D. A. et al. 2006, Nature, 443, 308
- Hsiao et al. (2007) Hsiao, E. Y., Conley, A., Howell, D. A., Sullivan, M., Pritchet, C. J., Carlberg, R. G., Nugent, P. E., & Phillips, M. M. 2007, ApJ, 663, 1187
- Hunter et al. (2009) Hunter, D. J. et al. 2009, A&A, 508, 371
- Iben & Tutukov (1984) Iben, I. & Tutukov, A. V. 1984, ApJS, 54, 335
- Ilbert et al. (2009) Ilbert, O. et al. 2009, ApJ, 690, 1236
- Inserra et al. (2012) Inserra, C. et al. 2012, MNRAS, 422, 1122
- Inserra et al. (2013a) —. 2013a, A&A, 555, A142
- Inserra et al. (2013b) —. 2013b, ApJ, 770, 128
- Ishida & de Souza (2013) Ishida, E. E. O. & de Souza, R. S. 2013, MNRAS, 430, 509
- Ivezic et al. (2011) Ivezic, Z., Strauss, M. A., Tyson, J. A., Axelrod, T., Bloom, J. S., & LSST Collaboration. 2011, in Bulletin of the American Astronomical Society, Vol. 43, American Astronomical Society Meeting Abstracts #217, 252.01
- Jha et al. (2007) Jha, S., Riess, A. G., & Kirshner, R. P. 2007, ApJ, 659, 122
- Jha et al. (2006) Jha, S. et al. 2006, AJ, 131, 527
- Johnson & Crotts (2006) Johnson, B. D. & Crotts, A. P. S. 2006, AJ, 132, 756
- Jordan et al. (2012) Jordan, IV, G. C., Perets, H. B., Fisher, R. T., & van Rossum, D. R. 2012, ApJ, 761, L23
- Kamiya et al. (2012) Kamiya, Y., Tanaka, M., Nomoto, K., Blinnikov, S. I., Sorokina, E. I., & Suzuki, T. 2012, ApJ, 756, 191
- Kankare et al. (2012) Kankare, E. et al. 2012, MNRAS, 424, 855
- Kankare et al. (2013) —. 2013, ArXiv e-prints
- Karpenka et al. (2013) Karpenka, N. V., Feroz, F., & Hobson, M. P. 2013, MNRAS, 429, 1278
- Kasen (2006) Kasen, D. 2006, ApJ, 649, 939
- Kasen & Woosley (2007) Kasen, D. & Woosley, S. E. 2007, ApJ, 656, 661
- Kashi & Soker (2011) Kashi, A. & Soker, N. 2011, MNRAS, 417, 1466
- Kasliwal et al. (2008) Kasliwal, M. M. et al. 2008, ApJ, 683, L29
- Kasliwal et al. (2010) —. 2010, ApJ, 723, L98
- Kasliwal et al. (2012) —. 2012, ApJ, 755, 161
- Kawabata et al. (2009) Kawabata, K. S., Tanaka, M., Maeda, K., Hattori, T., Nomoto, K., Tominaga, N., & Yamanaka, M. 2009, ApJ, 697, 747
- Kessler et al. (2010a) Kessler, R., Bassett, B., Belov, P., Bhatnagar, V., Campbell, H., Conley, A., Frieman, J. A., Glazov, A., et al. 2010a, PASP, 122, 1415
- Kessler et al. (2010b) Kessler, R. et al. 2010b, ApJ, 717, 40
- Khan et al. (2011) Khan, R. et al. 2011, ApJ, 726, 106
- Kimeridze & Tsvetkov (1991) Kimeridze, G. N. & Tsvetkov, D. Y. 1991, AZh, 68, 341
- Kleiser et al. (2011) Kleiser, I. K. W. et al. 2011, MNRAS, 415, 372
- Kowalski et al. (2008) Kowalski, M. et al. 2008, ApJ, 686, 749
- Krisciunas et al. (2000) Krisciunas, K. et al. 2000, ApJ, 539, 658
- Krisciunas et al. (2001) —. 2001, AJ, 122, 1616
- Krisciunas et al. (2003) —. 2003, AJ, 125, 166
- Krisciunas et al. (2004a) —. 2004a, AJ, 127, 1664
- Krisciunas et al. (2004b) —. 2004b, AJ, 128, 3034
- Krisciunas et al. (2004c) —. 2004c, AJ, 131, 1639
- Krisciunas et al. (2009) —. 2009, AJ, 137, 34
- Kromer et al. (2010) Kromer, M., Sim, S. A., Fink, M., Röpke, F. K., Seitenzahl, I. R., & Hillebrandt, W. 2010, ApJ, 719, 1067
- Kromer et al. (2013a) Kromer, M. et al. 2013a, MNRAS, 429, 2287
- Kromer et al. (2013b) —. 2013b, ApJ, 778, L18
- Kumar et al. (2013) Kumar, B. et al. 2013, MNRAS, 431, 308
- Kuznetsova & Connolly (2007) Kuznetsova, N. V. & Connolly, B. M. 2007, ApJ, 659, 530
- Lair et al. (2006) Lair, J. C., Leising, M. D., Milne, P. A., & Williams, G. G. 2006, AJ, 132, 2024
- Leibundgut et al. (1993) Leibundgut, B. et al. 1993, AJ, 105, 301
- Leonard et al. (2005) Leonard, D. C., Li, W., Filippenko, A. V., Foley, R. J., & Chornock, R. 2005, ApJ, 632, 450
- Leonard et al. (2002a) Leonard, D. C. et al. 2002a, AJ, 124, 2490
- Leonard et al. (2002b) —. 2002b, PASP, 114, 35
- Li et al. (2011) Li, W., Leaman, J., Chornock, R., Filippenko, A. V., Poznanski, D., Ganeshalingam, M., Wang, X., Modjaz, M., et al. 2011, MNRAS, 412, 1441
- Li et al. (2001) Li, W. et al. 2001, PASP, 113, 1178
- Li et al. (2003) —. 2003, PASP, 115, 453
- Lira et al. (1998) Lira, P. et al. 1998, AJ, 115, 234
- Lorén-Aguilar et al. (2009) Lorén-Aguilar, P., Isern, J., & García-Berro, E. 2009, A&A, 500, 1193
- Lunnan et al. (2013) Lunnan, R. et al. 2013, ApJ, 771, 97
- Lyman et al. (2013) Lyman, J. D., James, P. A., Perets, H. B., Anderson, J. P., Gal-Yam, A., Mazzali, P., & Percival, S. M. 2013, MNRAS, 434, 527
- Maeda et al. (2009) Maeda, K., Kawabata, K., Li, W., Tanaka, M., Mazzali, P. A., Hattori, T., Nomoto, K., & Filippenko, A. V. 2009, ApJ, 690, 1745
- Maguire et al. (2011) Maguire, K. et al. 2011, MNRAS, 418, 747
- Malesani et al. (2004) Malesani, D. et al. 2004, ApJ, 609, L5
- Maoz et al. (2013) Maoz, D., Mannucci, F., & Nelemans, G. 2013, ArXiv e-prints
- Marion et al. (2013) Marion, G. H. et al. 2013, ArXiv e-prints
- Marion et al. (2014) —. 2014, ArXiv e-prints
- Mauerhan et al. (2013) Mauerhan, J. C. et al. 2013, MNRAS, 431, 2599
- Maza et al. (1994) Maza, J., Hamuy, M., Phillips, M. M., Suntzeff, N. B., & Aviles, R. 1994, ApJ, 424, L107
- Mazzali et al. (2007) Mazzali, P. A., Röpke, F. K., Benetti, S., & Hillebrandt, W. 2007, Science, 315, 825
- McClelland et al. (2010) McClelland, C. M. et al. 2010, ApJ, 720, 704
- McCully et al. (2013) McCully, C. et al. 2013, ArXiv e-prints
- McKenzie & Schaefer (1999) McKenzie, E. H. & Schaefer, B. E. 1999, PASP, 111, 964
- Meikle et al. (1996) Meikle, W. P. S. et al. 1996, MNRAS, 281, 263
- Miller et al. (2010) Miller, A. A. et al. 2010, MNRAS, 404, 305
- Misra et al. (2007) Misra, K. et al. 2007, MNRAS, 381, 280
- Modjaz et al. (2009) Modjaz, M. et al. 2009, ApJ, 702, 226
- Munari et al. (2013) Munari, U., Henden, A., Belligoli, R., Castellani, F., Cherini, G., Righetti, G. L., & Vagnozzi, A. 2013, New Astronomy, 20, 30
- Newling et al. (2011) Newling, J. et al. 2011, MNRAS, 545
- Nicholl et al. (2013) Nicholl, M. et al. 2013, Nature, 502, 346
- Nomoto (1982) Nomoto, K. 1982, ApJ, 257, 780
- Nomoto et al. (1984) Nomoto, K., Thielemann, F.-K., & Yokoi, K. 1984, ApJ, 286, 644
- Nugent et al. (2002) Nugent, P., Kim, A., & Perlmutter, S. 2002, PASP, 114, 803
- Ofek et al. (2013) Ofek, E. O. et al. 2013, Nature, 494, 65
- Olmstead et al. (2014) Olmstead, M. D. et al. 2014, AJ, 147, 75
- Pakmor et al. (2012) Pakmor, R., Kromer, M., Taubenberger, S., Sim, S. A., Röpke, F. K., & Hillebrandt, W. 2012, ApJ, 747, L10
- Pakmor et al. (2013) Pakmor, R., Kromer, M., Taubenberger, S., & Springel, V. 2013, ApJ, 770, L8
- Palanque-Delabrouille et al. (2010) Palanque-Delabrouille, N. et al. 2010, A&A, 514, A63
- Pan et al. (2013) Pan, Y.-C. et al. 2013, ArXiv e-prints
- Pastorello et al. (2004) Pastorello, A. et al. 2004, MNRAS, 347, 74
- Pastorello et al. (2007) —. 2007, MNRAS, 376, 1301
- Pastorello et al. (2008) —. 2008, MNRAS, 389, 131
- Pastorello et al. (2009) —. 2009, MNRAS, 394, 2266
- Pastorello et al. (2010) —. 2010, ApJ, 724, L16
- Patat et al. (1996) Patat, F., Benetti, S., Cappellaro, E., Danziger, I. J., della Valle, M., Mazzali, P. A., & Turatto, M. 1996, MNRAS, 278, 111
- Pennypacker et al. (1989) Pennypacker, C. R. et al. 1989, AJ, 97, 186
- Perets et al. (2011a) Perets, H. B., Badenes, C., Arcavi, I., Simon, J. D., & Gal-yam, A. 2011a, ApJ, 730, 89
- Perets et al. (2011b) Perets, H. B., Gal-yam, A., Crockett, R. M., Anderson, J. P., James, P. A., Sullivan, M., Neill, J. D., & Leonard, D. C. 2011b, ApJ, 728, L36
- Perets et al. (2010) Perets, H. B. et al. 2010, Nature, 465, 322
- Perlmutter et al. (1997) Perlmutter, S. et al. 1997, ApJ, 483, 565
- Perlmutter et al. (1999) —. 1999, ApJ, 517, 565
- Perrett et al. (2012) Perrett, K. et al. 2012, AJ, 144, 59
- Phillips (1993) Phillips, M. M. 1993, ApJ, 413, L105
- Phillips (2011) —. 2011, ArXiv e-prints
- Phillips et al. (1987) Phillips, M. M. et al. 1987, PASP, 99, 592
- Phillips et al. (1992) —. 1992, AJ, 103, 1632
- Phillips et al. (2006) —. 2006, AJ, 131, 2615
- Phillips et al. (2007) —. 2007, PASP, 119, 360
- Pian et al. (2006) Pian, E. et al. 2006, Nature, 442, 1011
- Pignata et al. (2004) Pignata, G. et al. 2004, MNRAS, 355, 178
- Pignata et al. (2008) —. 2008, MNRAS, 388, 971
- Pignata et al. (2011) —. 2011, ApJ, 728, 14
- Pignata et al. (2014) —. 2014, in preparation
- Poznanski et al. (2002) Poznanski, D., Gal-Yam, A., Maoz, D., Filippenko, A. V., Leonard, D. C., & Matheson, T. 2002, PASP, 114, 833
- Poznanski et al. (2007) Poznanski, D., Maoz, D., & Gal-Yam, A. 2007, AJ, 134, 1285
- Poznanski et al. (2010) Poznanski, D. et al. 2010, Science, 327, 58
- Pozzo et al. (2006) Pozzo, M. et al. 2006, MNRAS, 368, 1169
- Prieto et al. (2007) Prieto, J. L. et al. 2007, ArXiv e-prints
- Prieto et al. (2012) —. 2012, ApJ, 745, 70
- Pritchard et al. (2013) Pritchard, T. A., Roming, P. W. A., Brown, P. J., Bayless, A. J., & Frey, L. H. 2013, ArXiv e-prints
- Pskovskii (1978) Pskovskii, I. P. 1978, Soviet Ast., 22, 201
- Pskovskii (1984) Pskovskii, Y. P. 1984, Soviet Ast., 28, 658
- Raskin et al. (2009) Raskin, C., Timmes, F. X., Scannapieco, E., Diehl, S., & Fryer, C. 2009, MNRAS, 399, L156
- Richards et al. (2011) Richards, J. W., Homrighausen, D., Freeman, P. E., Schafer, C. M., & Poznanski, D. 2011, ArXiv e-prints
- Richmond & Smith (2012) Richmond, M. W. & Smith, H. A. 2012, Journal of the American Association of Variable Star Observers (JAAVSO), 40, 872
- Richmond et al. (1995) Richmond, M. W. et al. 1995, AJ, 109, 2121
- Riess et al. (1996) Riess, A. G., Press, W. H., & Kirshner, R. P. 1996, ApJ, 473, 88
- Riess et al. (1998) Riess, A. G. et al. 1998, AJ, 116, 1009
- Riess et al. (1999) —. 1999, AJ, 117, 707
- Riess et al. (2004) —. 2004, ApJ, 607, 665
- Riess et al. (2005) —. 2005, ApJ, 627, 579
- Rodney & Tonry (2009) Rodney, S. A. & Tonry, J. L. 2009, ApJ, 707, 1064
- Rosswog et al. (2009) Rosswog, S., Kasen, D., Guillochon, J., & Ramirez-Ruiz, E. 2009, ApJ, 705, L128
- Roy et al. (2011a) Roy, R. et al. 2011a, MNRAS, 414, 167
- Roy et al. (2011b) —. 2011b, ApJ, 736, 76
- Roy et al. (2013) —. 2013, MNRAS, 434, 2032
- Sadakane et al. (1996) Sadakane, K. et al. 1996, PASJ, 48, 51
- Sahu et al. (2013) Sahu, D. K., Anupama, G. C., & Chakradhari, N. K. 2013, MNRAS, 433, 2
- Sahu et al. (2011) Sahu, D. K., Gurugubelli, U. K., Anupama, G. C., & Nomoto, K. 2011, ArXiv e-prints
- Sako et al. (2011a) Sako, M., Dark Energy Survey DES Supernova Working Group, & DES Collaboration. 2011a, in Bulletin of the American Astronomical Society, Vol. 43, American Astronomical Society Meeting Abstracts #217, 205.07
- Sako et al. (2011b) Sako, M. et al. 2011b, ApJ, 738, 162
- Sako et al. (2014) —. 2014, ArXiv e-prints
- Salvo et al. (2001) Salvo, M. E., Cappellaro, E., Mazzali, P. A., Benetti, S., Danziger, I. J., Patat, F., & Turatto, M. 2001, MNRAS, 321, 254
- Scalzo et al. (2012) Scalzo, R. et al. 2012, ApJ, 757, 12
- Scalzo et al. (2010) Scalzo, R. A. et al. 2010, ApJ, 713, 1073
- Scalzo et al. (2014) —. 2014, ArXiv e-prints
- Schlafly & Finkbeiner (2011) Schlafly, E. F. & Finkbeiner, D. P. 2011, ApJ, 737, 103
- Schmidt et al. (1993) Schmidt, B. P. et al. 1993, AJ, 105, 2236
- Schmidt et al. (1994) —. 1994, ApJ, 432, 42
- Shen et al. (2012) Shen, K. J., Bildsten, L., Kasen, D., & Quataert, E. 2012, ApJ, 748, 35
- Silverman et al. (2012) Silverman, J. M. et al. 2012, MNRAS, 425, 1789
- Silverman et al. (2013a) —. 2013a, MNRAS, 436, 1225
- Silverman et al. (2013b) —. 2013b, ApJS, 207, 3
- Sim et al. (2010) Sim, S. A., Röpke, F. K., Hillebrandt, W., Kromer, M., Pakmor, R., Fink, M., Ruiter, A. J., & Seitenzahl, I. R. 2010, ApJ, 714, L52
- Sim et al. (2013) Sim, S. A. et al. 2013, MNRAS, 436, 333
- Smartt et al. (2009) Smartt, S. J., Eldridge, J. J., Crockett, R. M., & Maund, J. R. 2009, MNRAS, 395, 1409
- Smith et al. (2012) Smith, N., Mauerhan, J. C., Silverman, J. M., Ganeshalingam, M., Filippenko, A. V., Cenko, S. B., Clubb, K. I., & Kandrashoff, M. T. 2012, MNRAS, 426, 1905
- Smith et al. (2009) Smith, N. et al. 2009, ApJ, 697, L49
- Sollerman et al. (1998) Sollerman, J., Cumming, R. J., & Lundqvist, P. 1998, ApJ, 493, 933
- Stoll et al. (2011) Stoll, R., Prieto, J. L., Stanek, K. Z., Pogge, R. W., Szczygiel, D. M., Pojmanski, G., Antognini, J., & Yan, H. 2011, ApJ, 730, 34
- Stritzinger et al. (2002) Stritzinger, M. et al. 2002, AJ, 124, 2100
- Stritzinger et al. (2009) —. 2009, ApJ, 696, 713
- Stritzinger et al. (2012) —. 2012, ApJ, 756, 173
- Stritzinger et al. (2011) Stritzinger, M. D. et al. 2011, AJ, 142, 156
- Stritzinger et al. (2014) —. 2014, A&A, 561, A146
- Strolger et al. (2002) Strolger, L. et al. 2002, AJ, 124, 2905
- Sullivan et al. (2006) Sullivan, M. et al. 2006, AJ, 131, 960
- Sullivan et al. (2011) —. 2011, ApJ, 732, 118
- Suntzeff et al. (1999) Suntzeff, N. B. et al. 1999, AJ, 117, 1175
- Suzuki et al. (2012) Suzuki, N. et al. 2012, ApJ, 746, 85
- Taddia et al. (2012a) Taddia, F. et al. 2012a, A&A, 545, L7
- Taddia et al. (2012b) —. 2012b, A&A, 537, A140
- Taddia et al. (2013) —. 2013, A&A, 555, A10
- Takáts et al. (2013) Takáts, K. et al. 2013, ArXiv e-prints
- Tanaka et al. (2009) Tanaka, M. et al. 2009, ApJ, 700, 1680
- Taubenberger et al. (2013) Taubenberger, S., Kromer, M., Pakmor, R., Pignata, G., Maeda, K., Hachinger, S., Leibundgut, B., & Hillebrandt, W. 2013, ApJ, 775, L43
- Taubenberger et al. (2006) Taubenberger, S. et al. 2006, MNRAS, 371, 1459
- Taubenberger et al. (2008) —. 2008, MNRAS, 385, 75
- Taubenberger et al. (2011) —. 2011, MNRAS, 412, 2735
- Tomasella et al. (2013) Tomasella, L. et al. 2013, MNRAS, 434, 1636
- Tripp (1998) Tripp, R. 1998, A&A, 331, 815
- Trundle et al. (2009) Trundle, C. et al. 2009, A&A, 504, 945
- Tsvetkov et al. (1990) Tsvetkov, D. I., Volkov, I. M., Bartunov, O. S., Ikonnikova, N. P., & Kimeridze, G. N. 1990, A&A, 236, 133
- Tsvetkov (2006a) Tsvetkov, D. Y. 2006a, Peremennye Zvezdy, 26, 3
- Tsvetkov (2006b) —. 2006b, Peremennye Zvezdy, 26, 4
- Tsvetkov (2008) —. 2008, Peremennye Zvezdy, 28, 3
- Tsvetkov & Elenin (2010) Tsvetkov, D. Y. & Elenin, L. 2010, Peremennye Zvezdy, 30, 2
- Tsvetkov et al. (2008) Tsvetkov, D. Y., Goranskij, V., & Pavlyuk, N. 2008, Peremennye Zvezdy, 28, 8
- Tsvetkov et al. (2014) Tsvetkov, D. Y., Metlov, V. G., Shugarov, S. Y., Tarasova, T. N., & Pavlyuk, N. N. 2014, ArXiv e-prints
- Tsvetkov et al. (2006) Tsvetkov, D. Y. et al. 2006, A&A, 460, 769
- Tsvetkov et al. (2007) —. 2007, Peremennye Zvezdy, 27, 5
- Tsvetkov et al. (2010) —. 2010, Peremennye Zvezdy, 30, 3
- Tsvetkov et al. (2011) —. 2011, Astronomy Letters, 37, 775
- Turatto et al. (1993) Turatto, M. et al. 1993, MNRAS, 265, 471
- Valenti et al. (2008) Valenti, S. et al. 2008, MNRAS, 383, 1485
- Valenti et al. (2009) —. 2009, Nature, 459, 674
- Valenti et al. (2011) —. 2011, MNRAS, 416, 3138
- Valenti et al. (2012) —. 2012, ApJ, 749, L28
- Valenti et al. (2013a) —. 2013a, MNRAS
- Valenti et al. (2013b) —. 2013b, ArXiv e-prints
- Valentini et al. (2003) Valentini, G. et al. 2003, ApJ, 595, 779
- Waldman et al. (2011) Waldman, R., Sauer, D., Livne, E., Perets, H., Glasner, A., Mazzali, P., Truran, J. W., & Gal-Yam, A. 2011, ApJ, 738, 21
- Wang et al. (2013) Wang, B., Justham, S., & Han, Z. 2013, A&A, 559, A94
- Wang et al. (2009a) Wang, X. et al. 2009a, ApJ, 699, L139
- Wang et al. (2009b) —. 2009b, ApJ, 697, 380
- Wells et al. (1994) Wells, L. A. et al. 1994, AJ, 108, 2233
- Wheeler (2012) Wheeler, J. C. 2012, ApJ, 758, 123
- Woosley & Weaver (1986) Woosley, S. E. & Weaver, T. A. 1986, ARA&A, 24, 205
- Yoshii et al. (2003) Yoshii, Y. et al. 2003, ApJ, 592, 467
- Young et al. (2010) Young, D. R. et al. 2010, A&A, 512, A70+
- Younger & van den Bergh (1985) Younger, P. F. & van den Bergh, S. 1985, A&AS, 61, 365
- Zhang et al. (2010) Zhang, T. et al. 2010, PASP, 122, 1
- Zhang et al. (2012) —. 2012, AJ, 144, 131
| Name | Type | (Ia) | (91bg) | Source |
|---|---|---|---|---|
| PTF09dav | SN Ia-Ca | 8.20 | 3.86 | Sullivan et al. (2011) |
| PTF10bjs | SN Ia | 5.86 | 20.13 | Hicken et al. (2012) |
| PTF10ops | SN Ia | 9.99 | 2.08 | Maguire et al. (2011) |
| SN 1980N | SN Ia | 5.19 | 8.16 | Hamuy et al. (1991) |
| SN 1981B | SN Ia | 15.24 | 26.41 | Barbon et al. (1982) |
| SN 1981D | SN Ia | 0.84 | 1.28 | Hamuy et al. (1991) |
| SN 1982W | SN Ia | 574.22 | 437.40 | Barbon et al. (1989) |
| SN 1983G | SN Ia | 32.59 | 36.41 | Younger & van den Bergh (1985); Benetti et al. (1991); Cadonau & Leibundgut (1990) |
| SN 1983R | SN Ia | 6.76 | 28.75 | Barbon et al. (1989) |
| SN 1984A | SN Ia | 40.34 | 47.68 | Barbon et al. (1989); Cadonau & Leibundgut (1990) |
| SN 1986G | SN Ia | 3.17 | 3.84 | Phillips et al. (1987) |
| SN 1987N | SN Ia | 165.36 | 72.33 | Benetti et al. (1991) |
| SN 1989A | SN Ia | 15.05 | 39.19 | Tsvetkov et al. (1990); Benetti et al. (1991) |
| SN 1989B | SN Ia | 0.76 | 5.41 | Wells et al. (1994) |
| SN 1989M | SN Ia | 75.69 | 54.19 | Kimeridze & Tsvetkov (1991) |
| SN 1990af | SN Ia | 1.02 | 8.04 | Hamuy et al. (1996a) |
| SN 1990N | SN Ia | 3.72 | 111.73 | Lira et al. (1998) |
| SN 1991T | SN Ia | 16.18 | 56.79 | Altavilla et al. (2004); Ford et al. (1993); Lira et al. (1998) |
| SN 1992A | SN Ia | 4.77 | 49.99 | Altavilla et al. (2004) |
| SN 1992al | SN Ia | 0.52 | 13.91 | Hamuy et al. (1996a) |
| SN 1992bc | SN Ia | 3.60 | 28.25 | Hamuy et al. (1996a) |
| SN 1992bh | SN Ia | 0.68 | 11.32 | Hamuy et al. (1996a) |
| SN 1992bo | SN Ia | 1.49 | 28.63 | Hamuy et al. (1996a) |
| SN 1992bp | SN Ia | 2.23 | 14.75 | Hamuy et al. (1996a) |
| SN 1993ag | SN Ia | 1.20 | 13.21 | Hamuy et al. (1996a) |
| SN 1993H | SN Ia | 1.59 | 5.77 | Altavilla et al. (2004); Hamuy et al. (1996a) |
| SN 1993O | SN Ia | 1.99 | 15.01 | Hamuy et al. (1996a) |
| SN 1994ae | SN Ia | 1.85 | 27.15 | Altavilla et al. (2004); Riess et al. (2005) |
| SN 1994D | SN Ia | 13.32 | 82.56 | Altavilla et al. (2004); Meikle et al. (1996); Patat et al. (1996) |
| SN 1994S | SN Ia | 2.72 | 22.02 | Riess et al. (1999) |
| SN 1995ac | SN Ia | 5.78 | 16.08 | Riess et al. (1999) |
| SN 1995al | SN Ia | 0.48 | 10.81 | Riess et al. (1999) |
| SN 1995bd | SN Ia | 4.00 | 39.46 | Altavilla et al. (2004); Riess et al. (1999) |
| SN 1995D | SN Ia | 1.44 | 21.59 | Riess et al. (1999); Sadakane et al. (1996) |
| SN 1995E | SN Ia | 0.89 | 11.77 | Riess et al. (1999) |
| SN 1996bl | SN Ia | 2.13 | 27.31 | Riess et al. (1999) |
| SN 1996bo | SN Ia | 10.30 | 78.58 | Riess et al. (1999) |
| SN 1996X | SN Ia | 1.44 | 26.53 | Riess et al. (1999); Salvo et al. (2001) |
| SN 1997bp | SN Ia | 12.78 | 30.81 | Jha et al. (2006) |
| SN 1997bq | SN Ia | 18.57 | 58.35 | Jha et al. (2006) |
| SN 1997br | SN Ia | 26.09 | 29.77 | Jha et al. (2006) |
| SN 1997cy | SN Ia | 396.02 | 433.18 | Germany et al. (2000) |
| SN 1997do | SN Ia | 6.17 | 58.89 | Jha et al. (2006) |
| SN 1997E | SN Ia | 3.55 | 41.39 | Jha et al. (2006) |
| SN 1998ab | SN Ia | 15.68 | 30.14 | Jha et al. (2006) |
| SN 1998aq | SN Ia | 2.25 | 40.51 | Riess et al. (2005) |
| SN 1998bp | SN Ia | 12.78 | 9.88 | Jha et al. (2006) |
| SN 1998bu | SN Ia | 2.84 | 55.73 | Suntzeff et al. (1999) |
| SN 1998dh | SN Ia | 4.19 | 46.18 | Ganeshalingam et al. (2010); Jha et al. (2006) |
| SN 1998dm | SN Ia | 2.98 | 77.41 | Ganeshalingam et al. (2010); Jha et al. (2006) |
| SN 1998ef | SN Ia | 8.81 | 27.35 | Ganeshalingam et al. (2010); Jha et al. (2006) |
| SN 1998es | SN Ia | 1.33 | 22.18 | Jha et al. (2006) |
| SN 1999aa | SN Ia | 2.08 | 50.11 | Altavilla et al. (2004); Jha et al. (2006) |
| SN 1999ac | SN Ia | 9.07 | 15.53 | Jha et al. (2006); Phillips et al. (2006) |
| SN 1999ar | SN Ia | 2.99 | 7.30 | Kowalski et al. (2008) |
| SN 1999aw | SN Ia | 5.61 | 45.58 | Strolger et al. (2002) |
| SN 1999bi | SN Ia | 1.94 | 3.47 | Kowalski et al. (2008) |
| SN 1999bm | SN Ia | 1.86 | 3.02 | Kowalski et al. (2008) |
| SN 1999bn | SN Ia | 1.18 | 2.08 | Kowalski et al. (2008) |
| SN 1999bp | SN Ia | 3.35 | 15.11 | Kowalski et al. (2008) |
| SN 1999by | SN Ia | 84.91 | 4.51 | Ganeshalingam et al. (2010); Garnavich et al. (2004) |
| SN 1999cc | SN Ia | 2.01 | 17.25 | Jha et al. (2006); Krisciunas et al. (2004c) |
| SN 1999cl | SN Ia | 8.50 | 35.70 | Ganeshalingam et al. (2010); Jha et al. (2006); Krisciunas et al. (2004c) |
| SN 1999cp | SN Ia | 12.71 | 106.37 | Ganeshalingam et al. (2010); Krisciunas et al. (2000) |
| SN 1999da | SN Ia | 51.58 | 5.05 | Krisciunas et al. (2001) |
| SN 1999dg | SN Ia | 3.78 | 17.68 | Ganeshalingam et al. (2010) |
| SN 1999dk | SN Ia | 3.45 | 29.17 | Altavilla et al. (2004); Ganeshalingam et al. (2010); Krisciunas et al. (2001) |
| SN 1999dq | SN Ia | 2.64 | 25.98 | Jha et al. (2006) |
| SN 1999ee | SN Ia | 2.97 | 87.85 | Stritzinger et al. (2002) |
| SN 1999ej | SN Ia | 1.83 | 21.49 | Ganeshalingam et al. (2010) |
| SN 1999ek | SN Ia | 2.35 | 43.79 | Jha et al. (2006); Krisciunas et al. (2004b) |
| SN 1999gp | SN Ia | 5.50 | 38.02 | Ganeshalingam et al. (2010); Jha et al. (2006); Krisciunas et al. (2001) |
| SN 2000cn | SN Ia | 5.25 | 22.19 | Ganeshalingam et al. (2010); Jha et al. (2006) |
| SN 2000cu | SN Ia | 1.66 | 14.02 | Ganeshalingam et al. (2010) |
| SN 2000cw | SN Ia | 2.32 | 11.04 | Ganeshalingam et al. (2010) |
| SN 2000cx | SN Ia | 12.55 | 47.15 | Altavilla et al. (2004); Candia et al. (2003); Jha et al. (2006) |
| SN 2000dk | SN Ia | 8.40 | 38.14 | Ganeshalingam et al. (2010); Jha et al. (2006) |
| SN 2000dm | SN Ia | 2.03 | 33.25 | Ganeshalingam et al. (2010) |
| SN 2000dn | SN Ia | 1.43 | 14.89 | Ganeshalingam et al. (2010) |
| SN 2000dr | SN Ia | 5.59 | 8.08 | Ganeshalingam et al. (2010) |
| SN 2000E | SN Ia | 5.88 | 36.99 | Lair et al. (2006); Tsvetkov (2006a); Valentini et al. (2003) |
| SN 2000fa | SN Ia | 2.90 | 33.51 | Ganeshalingam et al. (2010); Jha et al. (2006) |
| SN 2001ah | SN Ia | 0.77 | 2.55 | Ganeshalingam et al. (2010); Hicken et al. (2009) |
| SN 2001ba | SN Ia | 2.12 | 29.69 | Krisciunas et al. (2004a) |
| SN 2001bf | SN Ia | 18.83 | 28.94 | Hicken et al. (2009) |
| SN 2001bt | SN Ia | 2.78 | 28.56 | Krisciunas et al. (2004b) |
| SN 2001cj | SN Ia | 1.51 | 24.88 | Ganeshalingam et al. (2010) |
| SN 2001ck | SN Ia | 0.90 | 9.59 | Ganeshalingam et al. (2010) |
| SN 2001cp | SN Ia | 2.31 | 33.93 | Ganeshalingam et al. (2010); Hicken et al. (2009) |
| SN 2001cz | SN Ia | 1.79 | 56.26 | Krisciunas et al. (2004b) |
| SN 2001da | SN Ia | 6.73 | 30.56 | Hicken et al. (2009) |
| SN 2001dl | SN Ia | 2.58 | 32.75 | Ganeshalingam et al. (2010) |
| SN 2001E | SN Ia | 2.13 | 12.39 | Ganeshalingam et al. (2010) |
| SN 2001eh | SN Ia | 1.55 | 24.29 | Hicken et al. (2009) |
| SN 2001el | SN Ia | 6.06 | 44.16 | Krisciunas et al. (2003) |
| SN 2001en | SN Ia | 3.06 | 90.01 | Hicken et al. (2009) |
| SN 2001ep | SN Ia | 7.37 | 35.13 | Hicken et al. (2009) |
| SN 2001ex | SN Ia | 7.77 | 2.94 | Ganeshalingam et al. (2010) |
| SN 2001fe | SN Ia | 0.63 | 12.62 | Hicken et al. (2009) |
| SN 2001fh | SN Ia | 36.94 | 68.47 | Hicken et al. (2009) |
| SN 2001V | SN Ia | 1.50 | 30.45 | Hicken et al. (2009) |
| SN 2002bf | SN Ia | 1.85 | 8.61 | Hicken et al. (2009); Leonard et al. (2005) |
| SN 2002bo | SN Ia | 4.67 | 44.03 | Benetti et al. (2004); Ganeshalingam et al. (2010); Hicken et al. (2009) |
| SN 2002cd | SN Ia | 6.38 | 47.28 | Hicken et al. (2009) |
| SN 2002cf | SN Ia | 10.07 | 3.40 | Ganeshalingam et al. (2010) |
| SN 2002cr | SN Ia | 4.49 | 61.34 | Hicken et al. (2009) |
| SN 2002cs | SN Ia | 30.25 | 21.43 | Ganeshalingam et al. (2010) |
| SN 2002cu | SN Ia | 3.90 | 50.32 | Ganeshalingam et al. (2010) |
| SN 2002cv | SN Ia | 6.48 | 11.68 | Elias-Rosa et al. (2008) |
| SN 2002cx | SN Iax | 18.30 | 10.79 | Phillips et al. (2007) |
| SN 2002de | SN Ia | 3.89 | 33.39 | Hicken et al. (2009) |
| SN 2002dj | SN Ia | 5.03 | 60.16 | Ganeshalingam et al. (2010); Hicken et al. (2009); Pignata et al. (2008) |
| SN 2002dl | SN Ia | 18.48 | 20.28 | Ganeshalingam et al. (2010) |
| SN 2002dp | SN Ia | 4.70 | 54.32 | Hicken et al. (2009) |
| SN 2002eb | SN Ia | 2.72 | 39.65 | Ganeshalingam et al. (2010) |
| SN 2002ef | SN Ia | 3.66 | 29.35 | Ganeshalingam et al. (2010) |
| SN 2002el | SN Ia | 2.69 | 46.33 | Ganeshalingam et al. (2010) |
| SN 2002er | SN Ia | 3.39 | 48.05 | Ganeshalingam et al. (2010); Pignata et al. (2004) |
| SN 2002es | SN Ia | 27.61 | 7.09 | Ganeshalingam et al. (2012); Hicken et al. (2009) |
| SN 2002fb | SN Ia | 32.41 | 2.14 | Hicken et al. (2009) |
| SN 2002fk | SN Ia | 3.69 | 60.81 | Hicken et al. (2009) |
| SN 2002ha | SN Ia | 4.33 | 60.43 | Hicken et al. (2009) |
| SN 2002he | SN Ia | 4.00 | 59.38 | Hicken et al. (2009) |
| SN 2002hu | SN Ia | 2.29 | 26.25 | Hicken et al. (2009) |
| SN 2002hw | SN Ia | 4.68 | 35.88 | Hicken et al. (2009) |
| SN 2002jg | SN Ia | 3.16 | 39.55 | Ganeshalingam et al. (2010) |
| SN 2003ae | SN Ia | 28.64 | 11.89 | Hicken et al. (2009) |
| SN 2003cg | SN Ia | 4.04 | 43.52 | Elias-Rosa et al. (2006); Ganeshalingam et al. (2010); Hicken et al. (2009) |
| SN 2003du | SN Ia | 5.09 | 55.52 | Anupama et al. (2005); Hicken et al. (2009); Leonard et al. (2005) |
| SN 2003fa | SN Ia | 2.15 | 39.49 | Hicken et al. (2009) |
| SN 2003gn | SN Ia | 1.84 | 14.44 | Ganeshalingam et al. (2010) |
| SN 2003gq | SN Ia | 26.99 | 4.46 | Ganeshalingam et al. (2010) |
| SN 2003gt | SN Ia | 4.68 | 90.25 | Ganeshalingam et al. (2010) |
| SN 2003fg | SN Ia-supCh | 11.54 | 4.60 | Howell et al. (2006) |
| SN 2003he | SN Ia | 2.65 | 29.34 | Ganeshalingam et al. (2010) |
| SN 2003it | SN Ia | 0.75 | 6.60 | Hicken et al. (2009) |
| SN 2003iv | SN Ia | 0.59 | 17.95 | Hicken et al. (2009) |
| SN 2003kc | SN Ia | 5.20 | 10.39 | Hicken et al. (2009) |
| SN 2003kf | SN Ia | 4.26 | 35.76 | Hicken et al. (2009) |
| SN 2003U | SN Ia | 2.44 | 35.24 | Hicken et al. (2009) |
| SN 2003W | SN Ia | 8.21 | 41.90 | Hicken et al. (2009) |
| SN 2003Y | SN Ia | 21.85 | 3.04 | Ganeshalingam et al. (2010) |
| SN 2004as | SN Ia | 2.07 | 16.48 | Hicken et al. (2009) |
| SN 2004br | SN Ia | 5.33 | 58.42 | Ganeshalingam et al. (2010) |
| SN 2004bv | SN Ia | 3.85 | 49.51 | Ganeshalingam et al. (2010) |
| SN 2004bw | SN Ia | 2.14 | 32.02 | Ganeshalingam et al. (2010) |
| SN 2004ef | SN Ia | 4.71 | 69.01 | Contreras et al. (2010) |
| SN 2004eo | SN Ia | 7.64 | 43.43 | Contreras et al. (2010) |
| SN 2004ey | SN Ia | 2.62 | 86.19 | Contreras et al. (2010) |
| SN 2004fu | SN Ia | 2.48 | 22.22 | Hicken et al. (2009); Tsvetkov (2006b) |
| SN 2004fz | SN Ia | 9.80 | 87.89 | Ganeshalingam et al. (2010) |
| SN 2004gs | SN Ia | 3.43 | 16.71 | Contreras et al. (2010) |
| SN 2004gu | SN Ia | 2.44 | 48.96 | Contreras et al. (2010) |
| SN 2005A | SN Ia | 23.31 | 59.97 | Contreras et al. (2010) |
| SN 2005ag | SN Ia | 1.12 | 17.09 | Contreras et al. (2010) |
| SN 2005al | SN Ia | 1.57 | 36.33 | Contreras et al. (2010) |
| SN 2005am | SN Ia | 2.54 | 35.40 | Contreras et al. (2010) |
| SN 2005bc | SN Ia | 3.13 | 26.53 | Ganeshalingam et al. (2010) |
| SN 2005bl | SN Ia | 29.66 | 3.50 | Contreras et al. (2010) |
| SN 2005cf | SN Ia | 4.06 | 41.67 | Hicken et al. (2009); Pastorello et al. (2007); Wang et al. (2009b) |
| SN 2005de | SN Ia | 5.07 | 75.35 | Ganeshalingam et al. (2010) |
| SN 2005dm | SN Ia | 21.16 | 2.55 | Ganeshalingam et al. (2010) |
| SN 2005el | SN Ia | 2.52 | 28.56 | Contreras et al. (2010) |
| SN 2005eq | SN Ia | 1.37 | 32.54 | Contreras et al. (2010) |
| SN 2005eu | SN Ia | 5.93 | 37.69 | Hicken et al. (2009) |
| SN 2005gj | SN Ia | 247.03 | 151.35 | Prieto et al. (2007) |
| SN 2005hc | SN Ia | 1.08 | 20.40 | Contreras et al. (2010) |
| SN 2005hj | SN Ia | 4.60 | 25.15 | Stritzinger et al. (2011); Hicken et al. (2009) |
| SN 2005hk | SN Iax | 100.24 | 17.06 | Hicken et al. (2009); McCully et al. (2013); Phillips et al. (2007) |
| SN 2005iq | SN Ia | 4.18 | 75.47 | Stritzinger et al. (2011); Hicken et al. (2009) |
| SN 2005ir | SN Ia | 2.75 | 17.46 | Stritzinger et al. (2011) |
| SN 2005kc | SN Ia | 5.09 | 75.65 | Stritzinger et al. (2011); Hicken et al. (2009) |
| SN 2005ke | SN Ia | 79.61 | 4.41 | Stritzinger et al. (2011); Hicken et al. (2009) |
| SN 2005ki | SN Ia | 1.80 | 37.62 | Stritzinger et al. (2011); Hicken et al. (2009) |
| SN 2005lz | SN Ia | 2.51 | 6.76 | Hicken et al. (2009) |
| SN 2005M | SN Ia | 2.07 | 50.93 | Stritzinger et al. (2011) |
| SN 2005ms | SN Ia | 3.50 | 38.91 | Hicken et al. (2009) |
| SN 2005mz | SN Ia | 22.50 | 5.98 | Hicken et al. (2009) |
| SN 2005na | SN Ia | 2.38 | 53.92 | Stritzinger et al. (2011); Hicken et al. (2009) |
| SN 2005W | SN Ia | 5.39 | 78.59 | Stritzinger et al. (2011) |
| SN 2006ac | SN Ia | 2.27 | 27.59 | Hicken et al. (2009) |
| SN 2006ar | SN Ia | 5.88 | 41.52 | Hicken et al. (2009) |
| SN 2006ax | SN Ia | 2.40 | 74.01 | Stritzinger et al. (2011); Hicken et al. (2009) |
| SN 2006az | SN Ia | 3.50 | 24.36 | Hicken et al. (2009) |
| SN 2006bh | SN Ia | 1.88 | 60.14 | Stritzinger et al. (2011) |
| SN 2006bt | SN Ia | 6.94 | 8.06 | Stritzinger et al. (2011); Hicken et al. (2009) |
| SN 2006bz | SN Ia | 15.10 | 3.31 | Hicken et al. (2009) |
| SN 2006cc | SN Ia | 3.73 | 36.85 | Hicken et al. (2009) |
| SN 2006cp | SN Ia | 2.36 | 24.62 | Hicken et al. (2009) |
| SN 2006cq | SN Ia | 2.14 | 8.60 | Hicken et al. (2009) |
| SN 2006D | SN Ia | 3.13 | 41.76 | Stritzinger et al. (2011) |
| SN 2006dd | SN Ia | 6.73 | 55.36 | Stritzinger et al. (2011) |
| SN 2006dm | SN Ia | 2.01 | 30.52 | Ganeshalingam et al. (2010) |
| SN 2006ef | SN Ia | 3.32 | 66.58 | Stritzinger et al. (2011); Hicken et al. (2009) |
| SN 2006ej | SN Ia | 2.53 | 36.34 | Stritzinger et al. (2011); Hicken et al. (2009) |
| SN 2006em | SN Ia | 11.72 | 2.31 | Hicken et al. (2009) |
| SN 2006et | SN Ia | 2.37 | 51.53 | Stritzinger et al. (2011); Hicken et al. (2009) |
| SN 2006eu | SN Ia | 6.34 | 2.14 | Hicken et al. (2009) |
| SN 2006fw | SN Ia | 24.11 | 29.39 | Stritzinger et al. (2011) |
| SN 2006gj | SN Ia | 3.41 | 12.94 | Stritzinger et al. (2011); Hicken et al. (2009) |
| SN 2006gr | SN Ia | 3.04 | 19.81 | Hicken et al. (2009) |
| SN 2006gt | SN Ia | 2.59 | 5.05 | Stritzinger et al. (2011) |
| SN 2006gz | SN Ia-supCh | 26.04 | 21.65 | Hicken et al. (2007) |
| SN 2006ha | SN Ia | 2.50 | 1.65 | Hicken et al. (2009) |
| SN 2006hx | SN Ia | 8.34 | 39.02 | Stritzinger et al. (2011) |
| SN 2006ke | SN Ia | 43.28 | 3.00 | Hicken et al. (2009) |
| SN 2006kf | SN Ia | 2.69 | 45.59 | Stritzinger et al. (2011); Hicken et al. (2009) |
| SN 2006le | SN Ia | 2.32 | 36.66 | Hicken et al. (2009) |
| SN 2006lf | SN Ia | 2.45 | 44.13 | Hicken et al. (2009) |
| SN 2006mo | SN Ia | 4.36 | 16.27 | Hicken et al. (2009) |
| SN 2006mp | SN Ia | 1.28 | 15.39 | Hicken et al. (2009) |
| SN 2006mr | SN Ia | 84.22 | 9.38 | Stritzinger et al. (2011) |
| SN 2006nz | SN Ia | 6.80 | 4.15 | Hicken et al. (2009) |
| SN 2006oa | SN Ia | 1.78 | 9.06 | Hicken et al. (2009) |
| SN 2006ob | SN Ia | 1.82 | 11.25 | Stritzinger et al. (2011); Hicken et al. (2009) |
| SN 2006qo | SN Ia | 1.71 | 33.12 | Hicken et al. (2009) |
| SN 2006S | SN Ia | 3.04 | 25.87 | Hicken et al. (2009) |
| SN 2006sr | SN Ia | 2.06 | 27.67 | Hicken et al. (2009) |
| SN 2006X | SN Ia | 6.84 | 53.81 | Stritzinger et al. (2011) |
| SN 2007af | SN Ia | 1.36 | 38.75 | Stritzinger et al. (2011); Hicken et al. (2009) |
| SN 2007au | SN Ia | 18.30 | 22.29 | Hicken et al. (2009) |
| SN 2007ax | SN Ia | 62.76 | 5.45 | Stritzinger et al. (2011); Hicken et al. (2009) |
| SN 2007ba | SN Ia | 10.98 | 8.63 | Stritzinger et al. (2011); Hicken et al. (2009) |
| SN 2007bc | SN Ia | 1.93 | 32.47 | Stritzinger et al. (2011); Hicken et al. (2009) |
| SN 2007bd | SN Ia | 4.87 | 85.43 | Stritzinger et al. (2011); Hicken et al. (2009) |
| SN 2007bm | SN Ia | 2.50 | 80.15 | Stritzinger et al. (2011); Hicken et al. (2009) |
| SN 2007ca | SN Ia | 4.11 | 56.21 | Stritzinger et al. (2011); Hicken et al. (2009) |
| SN 2007ci | SN Ia | 37.97 | 38.69 | Hicken et al. (2009) |
| SN 2007co | SN Ia | 2.80 | 49.56 | Hicken et al. (2009) |
| SN 2007cp | SN Ia | 14.98 | 37.09 | Hicken et al. (2009) |
| SN 2007cq | SN Ia | 1.62 | 24.66 | Hicken et al. (2009) |
| SN 2007cv | SN Ia | 0.73 | 8.08 | Brown et al. (2009) |
| SN 2007F | SN Ia | 1.90 | 55.47 | Hicken et al. (2009) |
| SN 2007fr | SN Ia | 3.74 | 4.32 | Ganeshalingam et al. (2010) |
| SN 2007gi | SN Ia | 3.58 | 10.71 | Zhang et al. (2010) |
| SN 2007hj | SN Ia | 7.73 | 8.24 | Ganeshalingam et al. (2010); Hicken et al. (2012) |
| SN 2007jg | SN Ia | 1.59 | 12.72 | Stritzinger et al. (2011); Hicken et al. (2012) |
| SN 2007jh | SN Ia | 24.92 | 14.55 | Stritzinger et al. (2011) |
| SN 2007kd | SN Ia | 56.18 | 8.38 | Hicken et al. (2012) |
| SN 2007ke | SN Ia-Ca | 1.12 | 1.12 | Kasliwal et al. (2012) |
| SN 2007kk | SN Ia | 1.75 | 7.01 | Hicken et al. (2012) |
| SN 2007le | SN Ia | 5.57 | 70.85 | Stritzinger et al. (2011); Hicken et al. (2012) |
| SN 2007mm | SN Ia | 15.99 | 3.92 | Stritzinger et al. (2011) |
| SN 2007N | SN Ia | 82.36 | 7.29 | Stritzinger et al. (2011); Hicken et al. (2009) |
| SN 2007nq | SN Ia | 1.89 | 31.24 | Stritzinger et al. (2011); Hicken et al. (2012) |
| SN 2007on | SN Ia | 25.54 | 25.37 | Stritzinger et al. (2011) |
| SN 2007qd | SN Iax | 5.76 | 2.83 | McClelland et al. (2010) |
| SN 2007qe | SN Ia | 5.06 | 47.56 | Hicken et al. (2009) |
| SN 2007R | SN Ia | 4.19 | 23.67 | Hicken et al. (2009) |
| SN 2007S | SN Ia | 1.87 | 48.23 | Stritzinger et al. (2011); Hicken et al. (2009) |
| SN 2007sw | SN Ia | 3.21 | 16.14 | Hicken et al. (2012) |
| SN 2007ux | SN Ia | 3.92 | 4.94 | Ganeshalingam et al. (2010); Hicken et al. (2012) |
| SN 2008A | SN Iax | 33.73 | 18.87 | Ganeshalingam et al. (2010); Hicken et al. (2012) |
| SN 2008ae | SN Iax | 97.41 | 21.83 | Foley et al. (2013); Hicken et al. (2012) |
| SN 2008ar | SN Ia | 1.07 | 10.38 | Ganeshalingam et al. (2010); Hicken et al. (2012) |
| SN 2008bc | SN Ia | 6.63 | 134.01 | Stritzinger et al. (2011) |
| SN 2008bf | SN Ia | 2.62 | 37.87 | Hicken et al. (2009) |
| SN 2008cm | SN Ia | 1.57 | 28.12 | Hicken et al. (2012) |
| SN 2008dr | SN Ia | 3.45 | 18.23 | Ganeshalingam et al. (2010); Hicken et al. (2012) |
| SN 2008ec | SN Ia | 2.71 | 39.71 | Ganeshalingam et al. (2010) |
| SN 2008fp | SN Ia | 1.81 | 68.68 | Stritzinger et al. (2011) |
| SN 2008fv | SN Ia | 13.91 | 34.08 | Biscardi et al. (2012); Tsvetkov & Elenin (2010) |
| SN 2008ge | SN Iax | 8.84 | 3.83 | Foley et al. (2010a) |
| SN 2008gl | SN Ia | 1.03 | 16.41 | Hicken et al. (2012) |
| SN 2008gp | SN Ia | 2.55 | 107.52 | Stritzinger et al. (2011) |
| SN 2008gy | SN Ia | 2.41 | 12.75 | Tsvetkov et al. (2010) |
| SN 2008ha | SN Iax | 14.36 | 4.29 | Stritzinger et al. (2014); Valenti et al. (2009) |
| SN 2008hm | SN Ia | 2.44 | 13.57 | Hicken et al. (2012) |
| SN 2008hs | SN Ia | 5.93 | 26.03 | Hicken et al. (2012) |
| SN 2008hv | SN Ia | 2.47 | 51.50 | Stritzinger et al. (2011); Hicken et al. (2012) |
| SN 2008ia | SN Ia | 5.04 | 66.72 | Stritzinger et al. (2011) |
| SN 2008J | SN Ia | 81.20 | 35.50 | Taddia et al. (2012a) |
| SN 2008L | SN Ia | 2.55 | 42.55 | Ganeshalingam et al. (2010); Hicken et al. (2009) |
| SN 2008R | SN Ia | 12.02 | 32.41 | Stritzinger et al. (2011) |
| SN 2008Z | SN Ia | 5.80 | 46.70 | Ganeshalingam et al. (2010); Hicken et al. (2012) |
| SN 2009ad | SN Ia | 0.88 | 12.53 | Hicken et al. (2012) |
| SN 2009al | SN Ia | 10.63 | 17.28 | Hicken et al. (2012) |
| SN 2009an | SN Ia | 2.42 | 46.74 | Hicken et al. (2012) |
| SN 2009bv | SN Ia | 2.77 | 20.21 | Hicken et al. (2012) |
| SN 2009dc | SN Ia-supCh | 30.09 | 13.00 | Hicken et al. (2012); Stritzinger et al. (2011); Taubenberger et al. (2011) |
| SN 2009ds | SN Ia | 6.15 | 56.25 | Hicken et al. (2012) |
| SN 2009F | SN Ia | 65.52 | 4.34 | Stritzinger et al. (2011) |
| SN 2009gf | SN Ia | 3.56 | 16.64 | Hicken et al. (2012) |
| SN 2009ig | SN Ia | 2.50 | 25.13 | Foley et al. (2012); Hicken et al. (2012) |
| SN 2009kq | SN Ia | 1.45 | 21.28 | Hicken et al. (2012) |
| SN 2009le | SN Ia | 1.49 | 95.55 | Hicken et al. (2012) |
| SN 2009li | SN Ia | 5.43 | 1.60 | Hicken et al. (2012) |
| SN 2009na | SN Ia | 1.40 | 22.70 | Hicken et al. (2012) |
| SN 2009nr | SN Ia | 3.88 | 5.44 | Khan et al. (2011); Tsvetkov et al. (2011) |
| SN 2009Y | SN Ia | 2.49 | 32.96 | Hicken et al. (2012) |
| SN 2010A | SN Ia | 0.75 | 17.12 | Hicken et al. (2012) |
| SN 2010ae | SN Iax | 61.63 | 11.32 | Stritzinger et al. (2014) |
| SN 2010ai | SN Ia | 2.07 | 42.80 | Hicken et al. (2012) |
| SN 2010dt | SN Ia | 1.13 | 6.77 | Hicken et al. (2012) |
| SN 2010ev | SN Ia | 4.86 | 38.75 | Gutierrez et al. (2014) |
| SN 2010Y | SN Ia | 8.00 | 34.57 | Hicken et al. (2012) |
| SN 2011aa | SN Ia | 3.45 | 4.74 | Brown et al. (2012) |
| SN 2011ay | SN Iax | 2.14 | 0.76 | Foley et al. (2013) |
| SN 2011fe | SN Ia | 1.81 | 36.47 | Richmond & Smith (2012) |
| SN 2012cg | SN Ia | 10.27 | 98.30 | Munari et al. (2013) |
| SN 2012dn | SN Ia | 20.37 | 18.73 | Brown et al. (2012); Chakradhari et al. (2014) |
| SN 2012Z | SN Iax | 220.14 | 33.64 | Foley et al. (2013) |
| SN 2013bh | SN Ia | 5.24 | 3.94 | Silverman et al. (2013a) |
| SN 2014J | SN Ia | 7.74 | 66.38 | Foley et al. (2014); Marion et al. (2014); Tsvetkov et al. (2014) |
| LSQ12gdj | SN Ia-91T | 5.86 | 94.77 | Scalzo et al. (2014) |
| SNF20080514002 | SN Ia | 0.45 | 6.79 | Brown et al. (2012) |
| SNF200705280 | SN Ia-supCh | 3.56 | 11.45 | Scalzo et al. (2012) |
| SNF200708030 | SN Ia-supCh | 2.38 | 17.99 | Scalzo et al. (2012) |
| SNF200709120 | SN Ia-supCh | 8.28 | 18.26 | Scalzo et al. (2012) |
| SNF200805220 | SN Ia-supCh | 1.63 | 15.90 | Hicken et al. (2012); Scalzo et al. (2012) |
| SNF200807230 | SN Ia-supCh | 6.24 | 12.03 | Scalzo et al. (2012) |
| Name | Type | (Ia) | (91bg) | Source |
|---|---|---|---|---|
| SN 1986I | SN II | 14.70 | 12.72 | Pennypacker et al. (1989) |
| SN 1987A | SN II | 252.44 | 282.08 | Hamuy et al. (1990); Bouchet et al. (1989) |
| SN 1988A | SN II | 3.35 | 2.40 | Benetti et al. (1991); Turatto et al. (1993) |
| SN 1988H | SN II | 0.15 | 0.15 | Turatto et al. (1993) |
| SN 1990E | SN II | 41.89 | 20.40 | Benetti et al. (1994); Schmidt et al. (1993) |
| SN 1990K | SN II | 23.81 | 23.31 | Cappellaro et al. (1995) |
| SN 1991G | SN II | 100.56 | 126.02 | Blanton et al. (1995) |
| SN 1992am | SN II | 145.46 | 126.15 | Schmidt et al. (1994) |
| SN 1994N | SN II | 77.52 | 50.25 | Pastorello et al. (2004) |
| SN 1994W | SN II | 0.31 | 0.52 | Sollerman et al. (1998) |
| SN 1995ad | SN II | 34.30 | 26.92 | Inserra et al. (2013a) |
| SN 1996W | SN II | 48.16 | 10.06 | Inserra et al. (2013a) |
| SN 1997D | SN II | 44.03 | 55.90 | Benetti et al. (2001) |
| SN 1999br | SN II | 600.13 | 554.44 | Pastorello et al. (2004) |
| SN 1999em | SN II | 391.08 | 298.72 | Hamuy et al. (2001); Leonard et al. (2002b) |
| SN 1999eu | SN II | 25.75 | 45.89 | Pastorello et al. (2004) |
| SN 1999gi | SN II | 226.68 | 175.88 | Leonard et al. (2002a) |
| SN 2000cb | SN II-pec | 472.57 | 390.51 | Kleiser et al. (2011) |
| SN 2001dc | SN II | 38.82 | 35.56 | Pastorello et al. (2004) |
| SN 2001X | SN II | 48.41 | 41.99 | Tsvetkov (2006a) |
| SN 2002bj | Peculiar SN | 118.47 | 78.62 | Poznanski et al. (2010) |
| SN 2002hh | SN II | 38.96 | 33.61 | Pozzo et al. (2006); Tsvetkov et al. (2007) |
| SN 2003hn | SN II | 125.57 | 117.94 | Krisciunas et al. (2009) |
| SN 2004A | SN II | 315.26 | 198.97 | Hendry et al. (2006); Tsvetkov (2008) |
| SN 2004dj | SN II | 56.11 | 44.76 | Chugai et al. (2005); Tsvetkov et al. (2008) |
| SN 2004ek | SN II | 235.97 | 217.80 | Tsvetkov (2008) |
| SN 2004et | SN II | 362.17 | 362.66 | Misra et al. (2007) |
| SN 2005ay | SN II | 40.75 | 27.03 | Tsvetkov et al. (2006) |
| SN 2005cs | SN II | 418.69 | 341.36 | Brown et al. (2007); Dessart et al. (2008); Pastorello et al. (2009) |
| SN 2006au | SN II | 311.52 | 377.20 | Taddia et al. (2012b) |
| SN 2006bc | SN II | 598.27 | 517.52 | Pritchard et al. (2013) |
| SN 2006bp | SN II | 7.71 | 6.94 | Dessart et al. (2008); Pritchard et al. (2013) |
| SN 2006V | SN II | 585.76 | 688.07 | Taddia et al. (2012b) |
| SN 2007aa | SN II | 622.20 | 443.87 | Pritchard et al. (2013) |
| SN 2007ck | SN II | 1.45 | 1.94 | Pritchard et al. (2013) |
| SN 2008aw | SN II | 38.31 | 40.06 | Pritchard et al. (2013) |
| SN 2008gz | SN II | 64.48 | 26.55 | Roy et al. (2011a) |
| SN 2008ij | SN II | 12.01 | 7.88 | Pritchard et al. (2013) |
| SN 2008in | SN II | 295.20 | 296.59 | Pritchard et al. (2013); Roy et al. (2011b) |
| SN 2008jb | SN II | 4.95 | 5.06 | Prieto et al. (2012) |
| SN 2008M | SN II | 201.38 | 200.07 | Pritchard et al. (2013) |
| SN 2009bw | SN II | 114.11 | 88.44 | Inserra et al. (2012) |
| SN 2009js | SN II | 53.17 | 43.42 | Gandhi et al. (2013) |
| SN 2009md | SN II | 52.55 | 48.79 | Fraser et al. (2010) |
| SN 2009N | SN II | 541.98 | 481.67 | Takáts et al. (2013) |
| SN 2010aq | SN II | 70.17 | 71.52 | Gezari et al. (2010) |
| SN 2010F | SN II | 19.13 | 13.64 | Pritchard et al. (2013) |
| SN 2010gs | SN II | 2.87 | 2.98 | Pritchard et al. (2013) |
| SN 2010id | SN II | 57.11 | 44.72 | Gal-Yam et al. (2011) |
| SN 2010kd | SN II | 6.45 | 9.82 | Pritchard et al. (2013) |
| SN 2011cj | SN II | 3.94 | 4.39 | Pritchard et al. (2013) |
| SN 2012A | SN II | 115.75 | 93.09 | Pritchard et al. (2013); Tomasella et al. (2013) |
| SN 2012ak | SN II | 6.59 | 6.98 | Pritchard et al. (2013) |
| SN 2012aw | SN II | 381.27 | 265.25 | Bose et al. (2013); Pritchard et al. (2013) |
| SN 2013ej | SN II | 64.70 | 22.33 | Valenti et al. (2013b) |
| CSS121015 | SLSN | 38.23 | 46.42 | Benetti et al. (2013) |
| iPTF13bvn | SN Ib | 50.12 | 15.48 | Cao et al. (2013) |
| PS1-10bzj | SLSN-I | 2.67 | 9.74 | Lunnan et al. (2013) |
| PS1-11af | TDE? | 15.56 | 10.33 | Chornock et al. (2014) |
| PTF12dam | SLSN-Ic | 383.86 | 240.18 | Nicholl et al. (2013) |
| SN 1994I | SN Ic | 62.15 | 6.81 | Richmond et al. (1995) |
| SN 1994Y | SN IIn | 196.97 | 109.15 | Ho et al. (2001) |
| SN 1998bw | SN Ic | 15.84 | 6.46 | Clocchiatti et al. (2011); Galama et al. (1998); McKenzie & Schaefer (1999) |
| SN 1999el | SN IIn | 27.52 | 22.72 | Di Carlo et al. (2002) |
| SN 2002ap | SN Ic | 44.87 | 16.76 | Foley et al. (2003); Gal-Yam et al. (2002); Yoshii et al. (2003) |
| SN 2003jd | SN Ic | 14.36 | 2.04 | Valenti et al. (2008) |
| SN 2003lw | SN Ic | 694.10 | 785.27 | Malesani et al. (2004) |
| SN 2004aw | SN Ic | 13.60 | 3.27 | Taubenberger et al. (2006) |
| SN 2005bf | SN Ib | 190.57 | 138.43 | Folatelli et al. (2006) |
| SN 2005fk | SN Ic | 1.09 | 1.08 | Sako et al. (2014) |
| SN 2005hl | SN Ib | 51.00 | 12.81 | Sako et al. (2014) |
| SN 2005hm | SN Ib | 20.24 | 9.58 | Sako et al. (2014) |
| SN 2005kd | SN IIn | 48.95 | 68.66 | Pritchard et al. (2013) |
| SN 2005kj | IIn | 370.95 | 296.60 | Taddia et al. (2013) |
| SN 2005kr | SN Ic | 4.22 | 1.70 | Sako et al. (2014) |
| SN 2005ks | SN Ic | 3.53 | 1.91 | Sako et al. (2014) |
| SN 2005la | SN Ib/IIn | 7.79 | 14.65 | Pastorello et al. (2008) |
| SN 2005mn | SN IIP | 123.07 | 70.69 | D’Andrea et al. (2010) |
| SN 2006aa | IIn | 924.91 | 731.05 | Taddia et al. (2013) |
| SN 2006aj | SN Ic | 10.09 | 3.60 | Pian et al. (2006); Pritchard et al. (2013) |
| SN 2006bo | IIn | 141.12 | 131.55 | Taddia et al. (2013) |
| SN 2006fe | SN Ic | 6.55 | 5.44 | Sako et al. (2014) |
| SN 2006fo | SN Ib | 67.96 | 23.99 | Sako et al. (2014) |
| SN 2006gy | SN IIn | 26.04 | 48.19 | Agnoletto et al. (2009); Kawabata et al. (2009) |
| SN 2006jd | SN IIn | 816.49 | 641.89 | Pritchard et al. (2013); Stritzinger et al. (2012) |
| SN 2006jo | SN Ib | 5.18 | 1.36 | Sako et al. (2014) |
| SN 2006lc | SN Ic | 63.56 | 14.35 | Sako et al. (2014) |
| SN 2006nx | SN Ic | 3.90 | 1.65 | Sako et al. (2014) |
| SN 2006qk | SN Ib | 1.05 | 1.06 | Sako et al. (2014) |
| SN 2006qq | IIn | 318.98 | 278.03 | Taddia et al. (2013) |
| SN 2007bi | SN Ic-PI? | 24.83 | 23.53 | Gal-Yam et al. (2009); Young et al. (2010) |
| SN 2007gl | SN Ib | 10.54 | 10.52 | Sako et al. (2014) |
| SN 2007gr | SN Ic | 33.34 | 16.20 | Hunter et al. (2009) |
| SN 2007ms | SN Ic | 12.55 | 3.12 | Sako et al. (2014) |
| SN 2007nc | SN Ib | 1.88 | 1.31 | Sako et al. (2014) |
| SN 2007pk | SN IIn-P | 31.96 | 11.45 | Inserra et al. (2013a); Pritchard et al. (2013) |
| SN 2007qv | SN Ic | 12.63 | 13.89 | Sako et al. (2014) |
| SN 2007qw | SN Ib | 4.98 | 2.10 | Sako et al. (2014) |
| SN 2007qx | SN Ic | 13.34 | 11.64 | Sako et al. (2014) |
| SN 2007rt | SN IIn | 350.31 | 320.86 | Trundle et al. (2009) |
| SN 2007uy | SN Ib | 23.01 | 4.77 | Pritchard et al. (2013); Roy et al. (2013) |
| SN 2007Y | SN Ib | 105.53 | 31.99 | Pritchard et al. (2013); Stritzinger et al. (2009) |
| SN 2008aq | SN IIb | 1.24 | 1.69 | Pritchard et al. (2013) |
| SN 2008bo | SN Ib | 41.23 | 30.58 | Pritchard et al. (2013) |
| SN 2008D | SN Ib | 53.29 | 18.94 | Modjaz et al. (2009); Tanaka et al. (2009) |
| SN 2008fq | SN IIn | 66.41 | 45.04 | Taddia et al. (2013) |
| SN 2008iy | SN IIn | 205.13 | 220.09 | Miller et al. (2010) |
| SN 2008S | SN IIn-impost | 20.47 | 18.55 | Botticella et al. (2009); Smith et al. (2009) |
| SN 2009bb | SN Ic-BL | 16.00 | 2.12 | Pignata et al. (2011) |
| SN 2009ip | IIn-pec? | 28.98 | 30.30 | Fraser et al. (2013) |
| SN 2009jf | SN Ib | 45.32 | 14.88 | Pritchard et al. (2013); Sahu et al. (2011); Valenti et al. (2011) |
| SN 2009kn | SN IIn-P | 62.39 | 60.30 | Kankare et al. (2012) |
| SN 2009mg | SN IIb | 3.73 | 3.40 | Pritchard et al. (2013) |
| SN 2010ah | SN Ic | 5.07 | 2.78 | Corsi et al. (2011); Pritchard et al. (2013) |
| SN 2010bh | SN Ic | 2.83 | 1.79 | Bufano et al. (2012) |
| SN 2010bt | SN IIn | 3.55 | 5.94 | Pritchard et al. (2013) |
| SN 2010gx | SN Ic?ultra-b | 15.53 | 43.39 | Pastorello et al. (2010) |
| SN 2010jl | SN IIn | 418.33 | 394.05 | Pritchard et al. (2013); Stoll et al. (2011); Zhang et al. (2012) |
| SN 2010mc | SN IIn | 14.70 | 7.93 | Ofek et al. (2013) |
| SN 2010md | SLSN-Ic | 15.52 | 4.57 | Inserra et al. (2013b) |
| SN 2010O | Ib | 42.83 | 5.48 | Kankare et al. (2013) |
| SN 2010P | Ib | 6.54 | 0.47 | Kankare et al. (2013) |
| SN 2011am | SN Ib | 8.04 | 5.49 | Pritchard et al. (2013) |
| SN 2011bm | SN Ic | 22.62 | 12.30 | Valenti et al. (2012) |
| SN 2011dh | SN IIb | 23.12 | 11.12 | Marion et al. (2013); Pritchard et al. (2013); Sahu et al. (2013) |
| SN 2011fu | SN IIb | 62.50 | 30.23 | Kumar et al. (2013) |
| SN 2011ht | SN IIn-P | 32.98 | 30.63 | Mauerhan et al. (2013); Pritchard et al. (2013) |
| SN 2011hw | SN IIn/Ibn | 5.47 | 3.19 | Pritchard et al. (2013); Smith et al. (2012) |
| SDSS4012 | SN Ic | 27.48 | 11.55 | Sako et al. (2014) |
| SDSS14475 | SN Ic | 3.01 | 2.46 | Sako et al. (2014) |