Optimal signals for spectral measurements at EKB SuperDARN radar: Theory and Experiment
Abstract
The requirements for an optimal sequence for SuperDARN radar are stated. Obtained quasioptimal signals up to 26-pulse sequence are based on optimal and nearly optimal Golomb rulers. It is shown that standard 7-pulse SuperDARN sequence is one of the quasioptimal sounding signals, but 8-pulse kascan SuperDARN signal is not. The characteristics are calculated for quasioptimal sounding sequences up to 26-pulse one. It is shown that the most effective signals for the spectral measurements are 10, 12, 14, 18, 20, 24 and 26 pulse sequences.
We present the results of the first spectral measurements at the EKB SuperDARN radar with quasioptimal 8- and 9-pulse sequences, as well as with the optimal 10-and 12-pulse sequences. A comparison with the results obtained with standard 7-pulse SuperDARN sequence were made. The continuity of results in amplitude and velocity is shown, the expected improvement in the spectral width are also demonstrated.
1 Introduction
The main objective of SuperDARN radars is to study the spectral characteristics of ionospheric irregularities elongated with the Earth magnetic field, that allows one to study the dynamics of ionospheric electric fields at high latitudes. It should be noted that the signal scattered by elongated irregularities can be divided into 4 main types [Haldoupis(1989)], wherein the separation is carried out on the details of their spectral characteristics. However, the study of the dynamics of these irregularities is practically impossible without a detailed analysis of the spectral structure of the scattered signal [Hanuise et al.(1993), Schiffler et al.(1997), Danskin et al.(2004)].
The main difficulty of using SuperDARN radars for studying the spectral properties of the scattering irregularities is the shape of the sounding signal. Currently for SuperDARN the two types are used: standard 7-pulse [Greenwald et al.(1983)] and 8-pulse katscan sequences [Ribeiro et al.(2013)]. The use of these sequences for the detailed study of the spectral characteristics is almost impossible, since the spectral resolution provided by these sequences is too poor. It is equivalent to the 100-200 m/s for the speed.
At the moment, the problem of low spectral resolution on SuperDARN radars is solved by complex techniques that allow one to estimate the Doppler drift and the average spectral width of the signal without obtaining the spectrum, but based on the analysis of the correlation function and its phase structure, as well as on the basis of model assumptions [Hanuise et al.(1993), Schiffler et al.(1997), Barthes et al.(1998), Chisham et al.(2007), Ribeiro et al.(2013)]. The fine structure of the spectra is frequently finer than 200m/s [Huber and Sofko(2000), Danskin et al.(2004)], so for stable recognition and investigation of these structures the standard measurments require improving spectral resolution at least 2-3 times or use model-based inversion techniques [Schiffler et al.(1997), Barthes et al.(1998)].
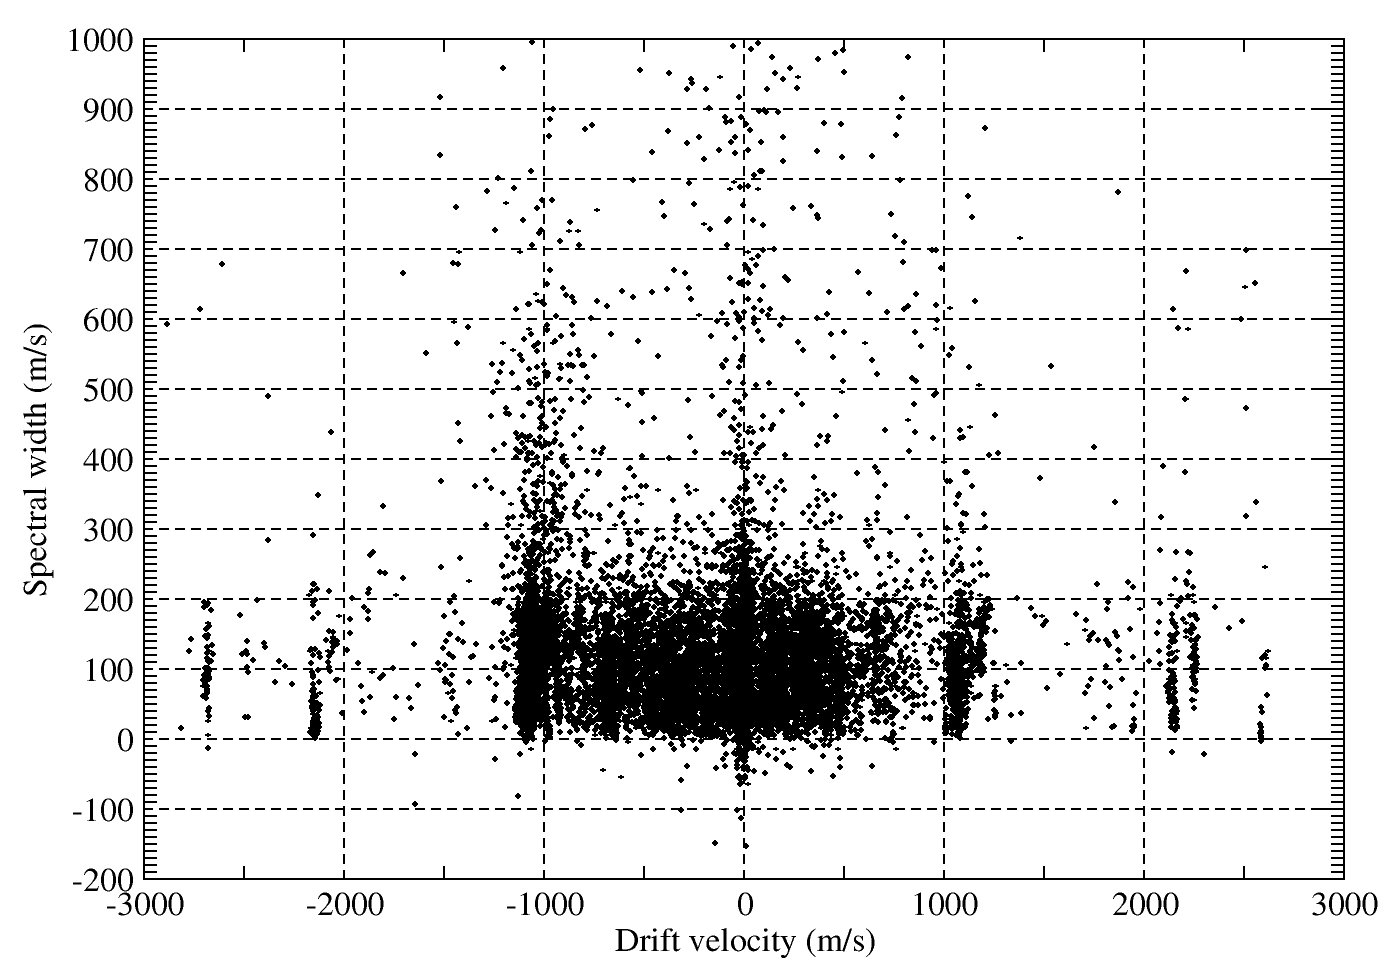
It is clear that in some cases the model representations of the scattered signal are not in agreement with experiment, and in this case event leads to significant errors in the estimation of parameters. These errors may lead for example to the appearance of paradoxical negative spectral widths. An example of the signal distribution over the velocities and the spectral width at EKB radar is shown at Fig.1.
Impossibility of calculating the spectra of SuperDARN radar signals leads to complications in recovery methods for spectral parameters of the irregularities. At Fig.1 one can see one consequence of these errors - the negative spectral widths calculated by FitACF program. These errors are associated with the processing algorithms for correlation functions [Ribeiro et al.(2013)] and caused by the inability to restore the spectrum of the scattered signal from sounding results with standard sounding signals.
Thus, the problem of using optimal sounding signals in the SuperDARN technique has the one of the important values [Greenwald et al.(1983), Schiffler(1996), Greenwald et al.(2008)]. Feature of SuperDARN radars functioning is the requirement that the product of the spectral resolution and spatial resolution to be significantly less than the speed of light in vacuum. This means that the use of simple pulse signals (for which this product is equal to the half of velocity of light) in this problem is impossible and one needs the use of special signals in conjunction with additional approximations depending on the nature of the scattering.
Sequences and processing methods that implement these special signals, have been well studied in the incoherent scattering technique: these are multipulse sequences [Farley(1972)], random phase codes [Sulzer(1986)], alternating codes [Lehtinen and Häggström(1987)] (including the polyphase ones [Markkanen et al.(2008)]) and the technique of effective subtraction [Berngardt and Kushnarev(2013)]. However, in the SuperDARN technique the product of necessary spectral resolution and range resolution is so small that one can effectively use only multipulse sequences. In this case, the signal reception is carried out by means of the transmission of the short pulses, which form the sounding sequence. Therefore, SuperDARN radars currently used only multipulse sounding sequences that have necessary characteristics - 7-pulse standard sequence [Greenwald et al.(1983)] and 8-pulse katscan sequence [Ribeiro et al.(2013)], implementing the principle described in [Farley(1972)], as well as 13-pulse sequence based on mixing forward and reverse optimal Golomb sequences[Greenwald et al.(2008)].
2 Quasioptimal and optimal SuperDARN sounding sequences
The convenient basis for the understanding of backscattering techniques is the concept of the weight volume [Potekhin and Berngardt(2000), Berngardt and Potekhin(2002), Berngardt and Kushnarev(2013)]. Weight volume shows how much of the correlation function of the received signal is related to the correlation function of inhomogeneities, and corresponding set of ranges. The relationship between the scattering cross section of irregularities and the average correlation function of the received signal measured in the moment after transmitting sounding signal in a first approximation is given by the expression [Berngardt and Kushnarev(2013)]:
where c - speed of light.
The shape of the weight volume with standard correlation processing technique is determined by the shape of the sounding signal envelope :
The spatial resolution varies for each of the delay of the correlation function, and is determined as the width of the weight volume at the fixed delay . From the structure of the weight volume it is obvious that the spatial resolution at zero delay (’lag’) is determined by the total duration of the signal and can not be improved (except in special subtraction techniques like [Berngardt and Kushnarev(2013)]). However, the spatial resolution at the other lags depends of the signal shape. Resolution over the lags is inversely proportional to the spectral resolution and is equal to the total duration of the signal.
For SuperDARN sounding signal [Greenwald et al.(1983), Ribeiro et al.(2013)], that is a sequence of elementary almost rectangular pulses (300us), spaced by multiples of (n * 2.4ms) and having total duration (64.8ms), we can define a spatial resolution of as width of weight volume for a given delay:
Property of the function is that it reaches the value 1 at the ’good’ lags, and 0 - at ’bad’ lags.
If then this lag is with poor spatial resolution larger than the duration of a short elementary pulse , we will not take such sounding signals into consideration.
Therefore, the for synthesis of optimal signal, the requirements are easy to formulate as the requirements to (and through it - to the weight volume and to the sounding signal), which is formed by the shape of the sounding signal.
In the case of the SuperDARN technique the requirements for optimal signal are following:
1. The weight volume is such that at all the lags, except zero one, the spatial resolution for all the lags that are multiples of the elementary interpulse period is ’excellent’ - not less than that of a single pulse:
The requirement of the excellent spatial resolution for each point is based on the following qualitative consideration. In case some of the points are made with worse spatial resolution, the energy of the weight volume for this lag is lost for analysis, so in this case this part of the energy of transmitted signal is used not for obtaining correlation function. As a result using signals, having points with spatial resolution worser than single pulse will decrease actual signal-to-noise ratio and require additional accumulation. Examples of pulses having points with worse spatial resolution can be found, for example, in [Schiffler(1996), Greenwald et al.(2008)].
2. Lags at which the spatial resolution is equal to the elementary pulse one (), are considered to be good (’good’ lags), and at which the correlation function of the scattered signal does not correspond to the scattering from the medium () - are considered to be bad (’bad’ lags).
3 The ratio of good lags number in the correlation function
to the total number of lags in the correlation function
must be maximized for a given number of pulses in the sequence.
Requirements and definitions 1-2 are known and used long time, requirement 3 (optimality criterion for sounding sequence) introduced for reasons of most efficient use of the received data - the highest possible number of lags in correlation functions of received signal should be used for processing, the same considerations were used in [Farley(1972)].
To find the optimal sounding signals, we used a parallel algorithm for search of optimal sequences with maximal within the class of sequences with a fixed number of pulses. The search was made by using computing clusters ISC SB RAS ’Blackford’ and ’Academician V.M.Matrosov’ (http://hpc.icc.ru/) by Monte Carlo technique, modified for taking into account the peculiarities of the desired sequences.
As a result of the calculations we obtained 8,9,10,11,12 and 13 pulse sequences. The sequences obtained and their characteristics are summarized in Table 1. Table 1 also shows the characteristics of the optimal 7-pulse sequence obtained in [Farley(1972)], as well as 7- and 8-pulse sequences used in the SuperDARN method[Greenwald et al.(1983), Ribeiro et al.(2013)]. SuperDARN 13-pulse sequence [Greenwald et al.(2008)] was not considered in the comparison because it has a number of lags with a spatial resolution worse than the elementary pulse duration.
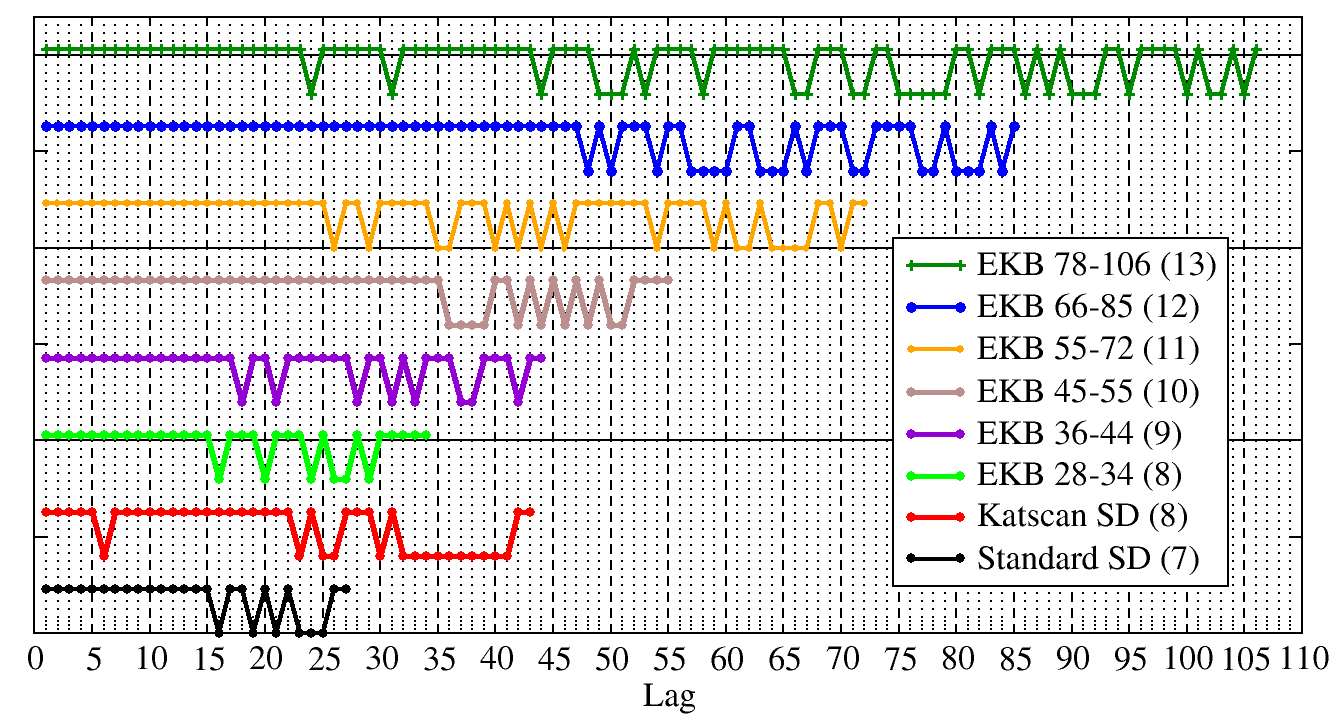
Table 1 shows that the standard SuperDARN 7-pulse sequence is close to the optimum [Farley(1972)], while the katscan SuperDARN 8-pulse sequence is much less effective than 8 and 9 and the pulse sequence calculated by us. For a more detailed comparison of these sequences at Figure 2 we show plots of for these sequences. From these graphs it is clear that the sequences obtained by us have more ’good’ lags than 7- and 8-pulse sequences used previously.
Figure 2 shows that the found 9-pulse sequence (EKB 36-44) has almost the same total duration as used now by 8-pulse katscan sequence [Ribeiro et al.(2013)], but the average power emitted by the radar in this case is 1.125 times more, which means it also more efficient in terms of energy. From the point of view of significant lags, the found 9-pulse sequence has 28% more significant ’good’ lags than 8-pulse katscan, and its first ’bad’ lag is 36 instead of 6 for katscan. This makes 9-pulse EKB 36-44 more efficient for measurements than the standard 8-pulse katscan.
As can be seen from Table 1 and Fig.2, efficiency for the found 10-13-pulse sequences also close to the standard 7-pulse sequence efficiency, but allow to analyze more lags in the correlation function, and the first bad lag is always bigger than the first bad lag of standard 7-pulse sequence.
Analysis of the shape of the weight volume shows that the requirement of a minimum spatial resolution at all points is consistent with the requirement of uniqueness interpulse intervals in the sounding sequence. This requirement corresponds to the well-studied object in mathematics - Golomb rulers [Golomb(1972), Greenwald et al.(2008)].
Analysis has shown that optimality criterion for SuperDARN sounding signal we have formulated (the maximum number of good lags in the weight volume) meets the criterion of optimality of Golomb rulers (the maximum number of measurable numbers), and the task of finding the optimal sequence thus reduces to the well-known and developed problem of finding the optimal Golomb rulers.
For Golomb rulers to date optimal sequences up to 27 are numerically found, and the proof is kept now for the optimal power 28 sequences by the network computing project OGR-28 [Distributed.net Project webpage]. Optimal Golomb rulers are widely used in various practical problems.
Table 2 shows the sounding signals corresponding to optimal Golomb rulers with , as well as their characteristics - number of all lags L and good lags M in correlation function, the efficiency and the average signal power P.
At table 2 we show the first bad lag for each of the sequences. The table shows that the maximum length of part without bad lag that increases monotonically with increasing number of pulses is provided by 8,9,10,12,14,18,20,24 and 26 pulse sequences. The rest of the sequences is much more worse.
Nearly optimal Golomb sequences differ from the optimal sequences by slightly larger length and may also be used as a basis for sounding signals.
We will refer the sounding sequences constructed from the condition of maximal first bad lag in the class of optimal and nearly optimal [Feiri webpage()] Golomb sequences () as quasioptimal ones. We will refer the part of these sequences that correspond to the optimal Golomb sequences as optimal ones. Quasioptimal sequences provide a maximum of the first bad lag, but do not always have the minimal possible length. Optimal sequence realize the maximal first bad lag and minimal length at the same time.
Table 3 shows the quasioptimal sequences for . An asterisk denotes optimal sequences. For the values of 21-23 and 25,27 quasioptimal sequences are not listed due to lack of available data.
Table 3 shows that the standard 7-pulse SuperDARN signal is quasioptimal 7-pulse sequence in the framework of this approach, but 8-pulse katscan SuperDARN signal, as expected from Table 1, is not quasioptimal signal.
If not to pay much attention to the relative amount of good lags in the correlation function, but only to the distance to the first bad lag, any of the quasioptimal sequences (Table 3) can be used for spectral measurements.
As one can see from (Table 3) the sequence providing maximal relative efficiency over all the parameters (maximal relative number of good lags and maximal relative position of first bad lag) is 10-pulse optimal Golomb ruler (Table 3).
Briefly, two problems of using new sounding signals must be taken into account.
The first problem is reducing the signal/noise ratio which decreases as the ratio of the number of pulses in a sequence to its full length due to signals scattered from the uncorrelated ranges.
The second problem is more significant for SuperDARN radars, is consists in the statistical nature of the sounding, and so in order to determine the parameters of scattered signal one need statistical averaging. The accumulation time of the averaged signal for a fixed number of soundings is proportional to the total sequence length, which actually leads to increase in the required accumulation time as a square of the number of pulses in the sequence.
Therefore, when choosing of the sounding sequence (increasing the number of pulses in the sounding sequence) researcher is limited by required time resolution and radar energy. Since the scattering cross-section of the irregularities investigated by SuperDARN radars is much higher than the cross section of incoherent scattering, we should expect that the optimal number of pulses in the sounding sequence may be greater than 7 suggested in [Farley(1972)], and we can use for the sounding more complex signals obtained in this work.
As can be seen from the above that from the optimal and nearly optimal Golomb rulers the quasioptimal sounding SuperDARN signals can be chosen. From these quasioptimal signals one can select the signal optimal for researcher based on the necessary temporal resolution and the energetic potential of the radar. For comparison, when using 12-pulse quasioptimal sequence it is necessary to accumulate 3 times longer than for the standard 7-pulse SuperDARN signal, by taking into account the increased signal length. For a 10-pulse sequence accumulation time increases only twice.
3 Experimental results with quasioptimal sounding sequences
On the basis of optimal and nearly optimal Golomb rulers, we have constructed quasioptimal SuperDARN sounding signals for the number of pulses from 7 to 26 (Table 3), which simultaneously provide a relatively high efficiency (differing from the optimal by not more than 10%) and maximal first bad lag.
To verify the assumption of the effectiveness of obtained long sounding sequences for SuperDARN radars and to obtain the first spectra of scattered signals with high spectral resolution, we conducted experiments at the EKB radar of the Russian segment of SuperDARN radars.
As showed the preliminary analysis, from the spectral measurements point of view the optimal sounding sequences for SuperDARN (providing at the same time the maximal relative amount of good lags and maximal first bad lag) seems to be 10,12,14,18,20,24 and 26-element Golomb rulers (Table 3) . However, with increasing of the pulses number in the sequence significantly increases the required averaging time, so experimental verification was carried out only for relatively short 8, 9, 10 and 12-pulse sounding sequences. The first two of them - are quasioptimal, the last two - optimal ones.
Standard formulation of the experiment was to switch every 12 minutes between the 7,8,9,10 and 12 quasioptimal sounding sequences (Table 3). In this case, the used 7-pulse sequence at the same time is a standard SuperDARN signal.
Compared to the standard mode of EKB radar, the accumulation time was increased twice (from 4 up to 8 seconds) to compensate for the increased duration of the sounding signal. To calculate the spectra we used the Wiener-Khinchin theorem, the discrete Fourier transform with a window of 1000 samples and step interpolation of the correlation function at bad lags. Further, all the spectral data will be given in doppler velocity units (m/s), which is quite a standard representation for SuperDARN radar data.
The experimental results are shown below.
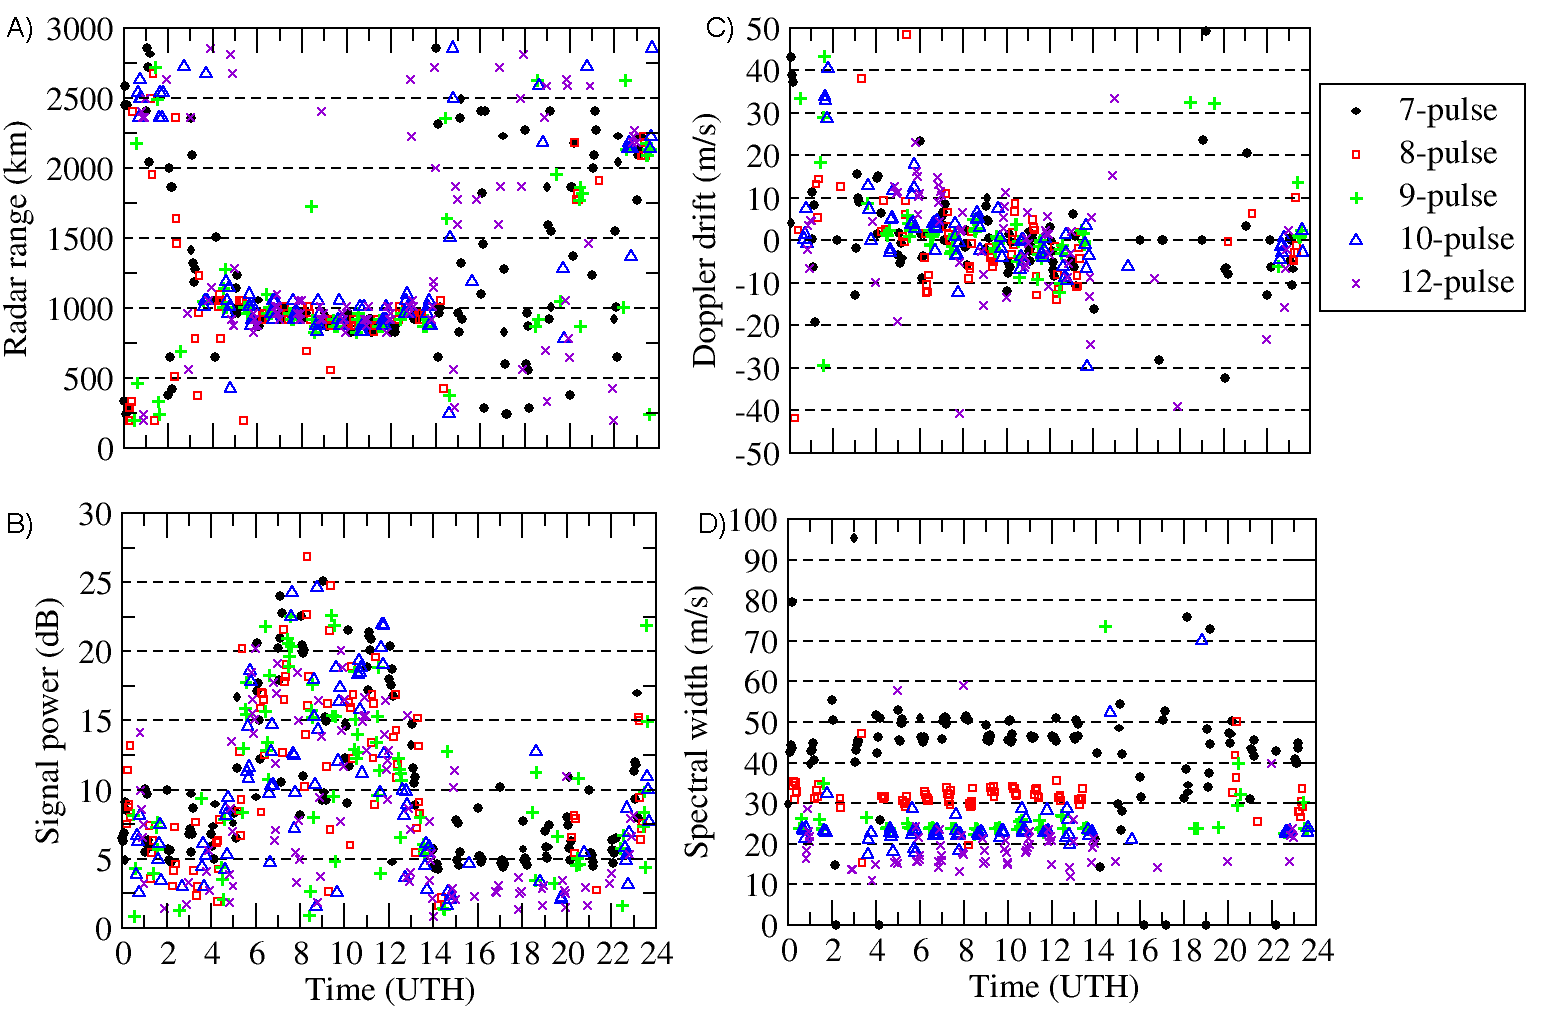
To compare parameters obtained by spectral and correlation processing, the spectra were processed by the following simple algorithm: to reduce the influence of concentrated interference the average spectral power averaged over all radar gates (distances) is subtracted from spectral power at each range gate; as the signal power the maximal spectral amplitude were used; as the average Doppler drift the first moment of the spectrum was used; as the average spectral width the second central moment of the spectrum was used; calculations of spectral parameters were carried out in a range of speeds +/- 900m/s to reduce the impact of concentrated interference at the 1000 m/s (see Fig.1).
Comparison of dynamics of these parameters is shown at Fig.3. The comparison shows that the distributions of ranges with maximal signal amplitude, the maximal power and Doppler drift for this range measured in the experiments are quite similar, and weakly dependent on the type of signal, which indicates validity of the results obtained from the scattered signal spectrum. Spectral width is reduced with increasing number of pulses in the sequence.
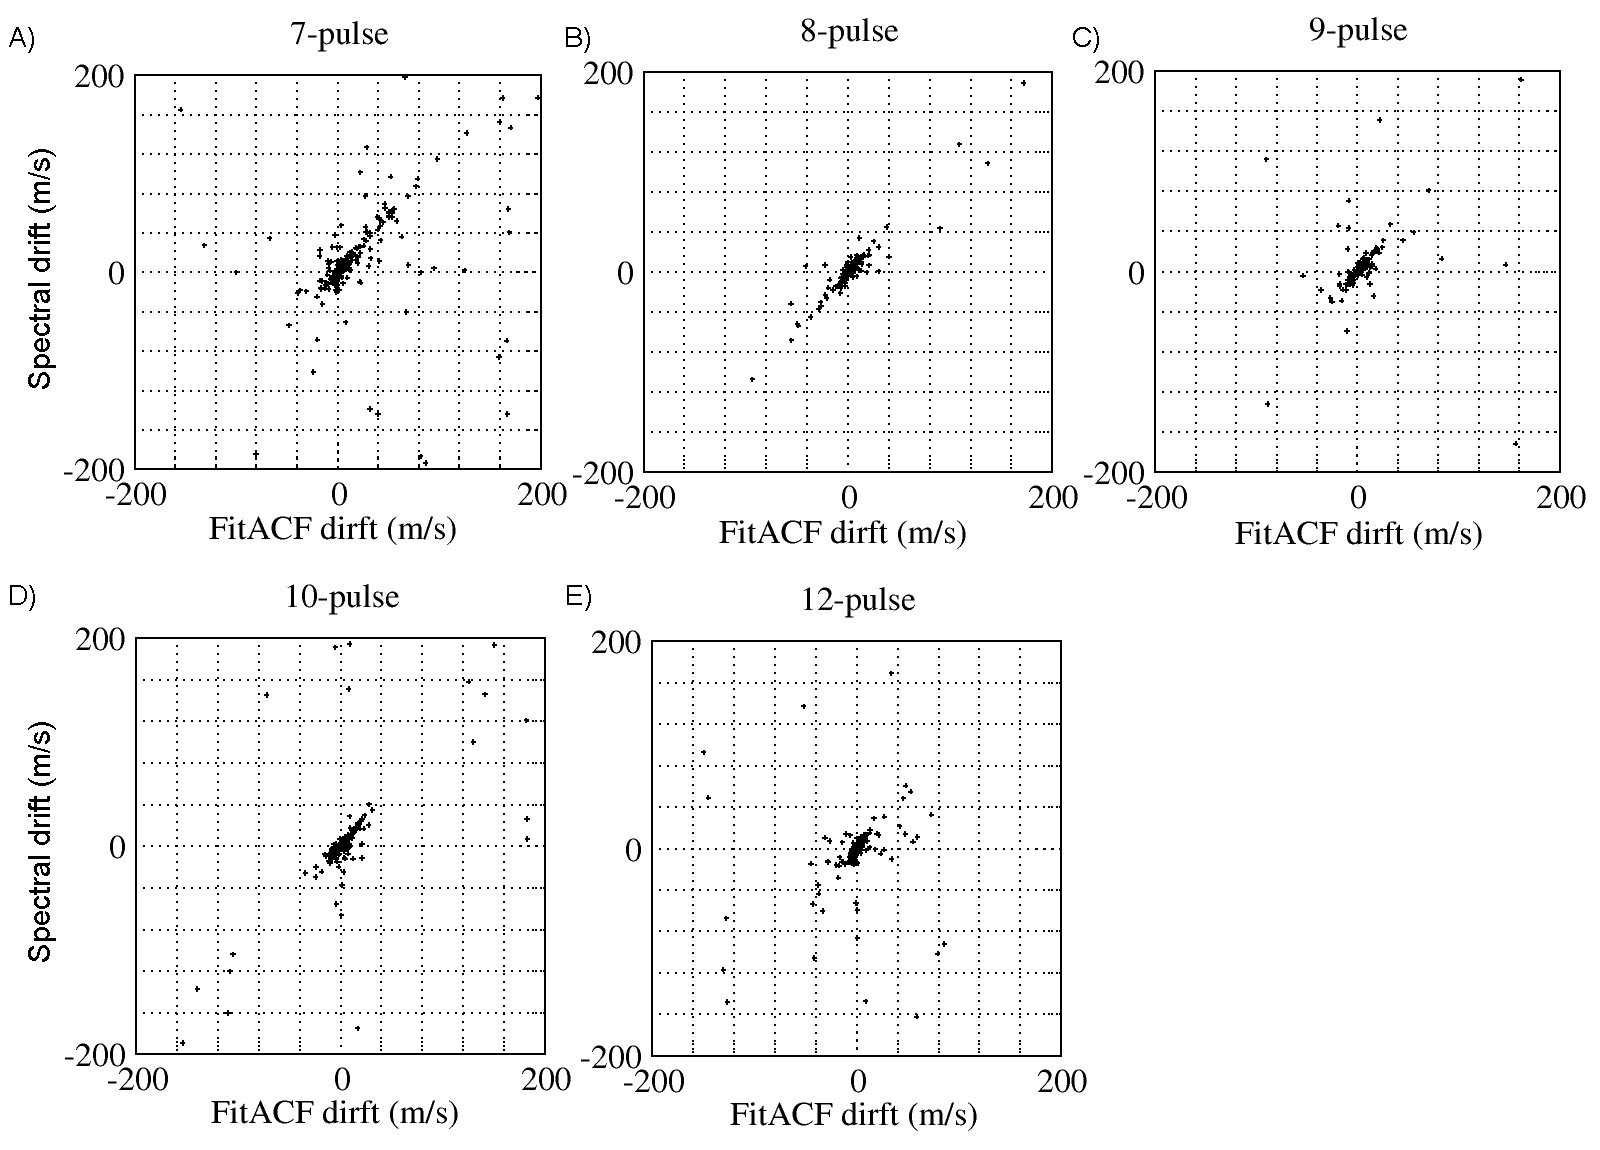
At Fig.4 we show the velocities obtained by FitACF technique and spectral method. When comparing the velocity the comparison was made over the points, at which the FitACF technique prodices the correct result with signal-to-noise ratio . One can see the average linear proportionality of data obtained in the case of 7, 8,9,10 pulse sequences, indicating the qualitative applicability of FitACF to interpret the data obtained by new signals, and the correctness of the signals themselves. Similar results were obtained when we use the LMFIT technique.
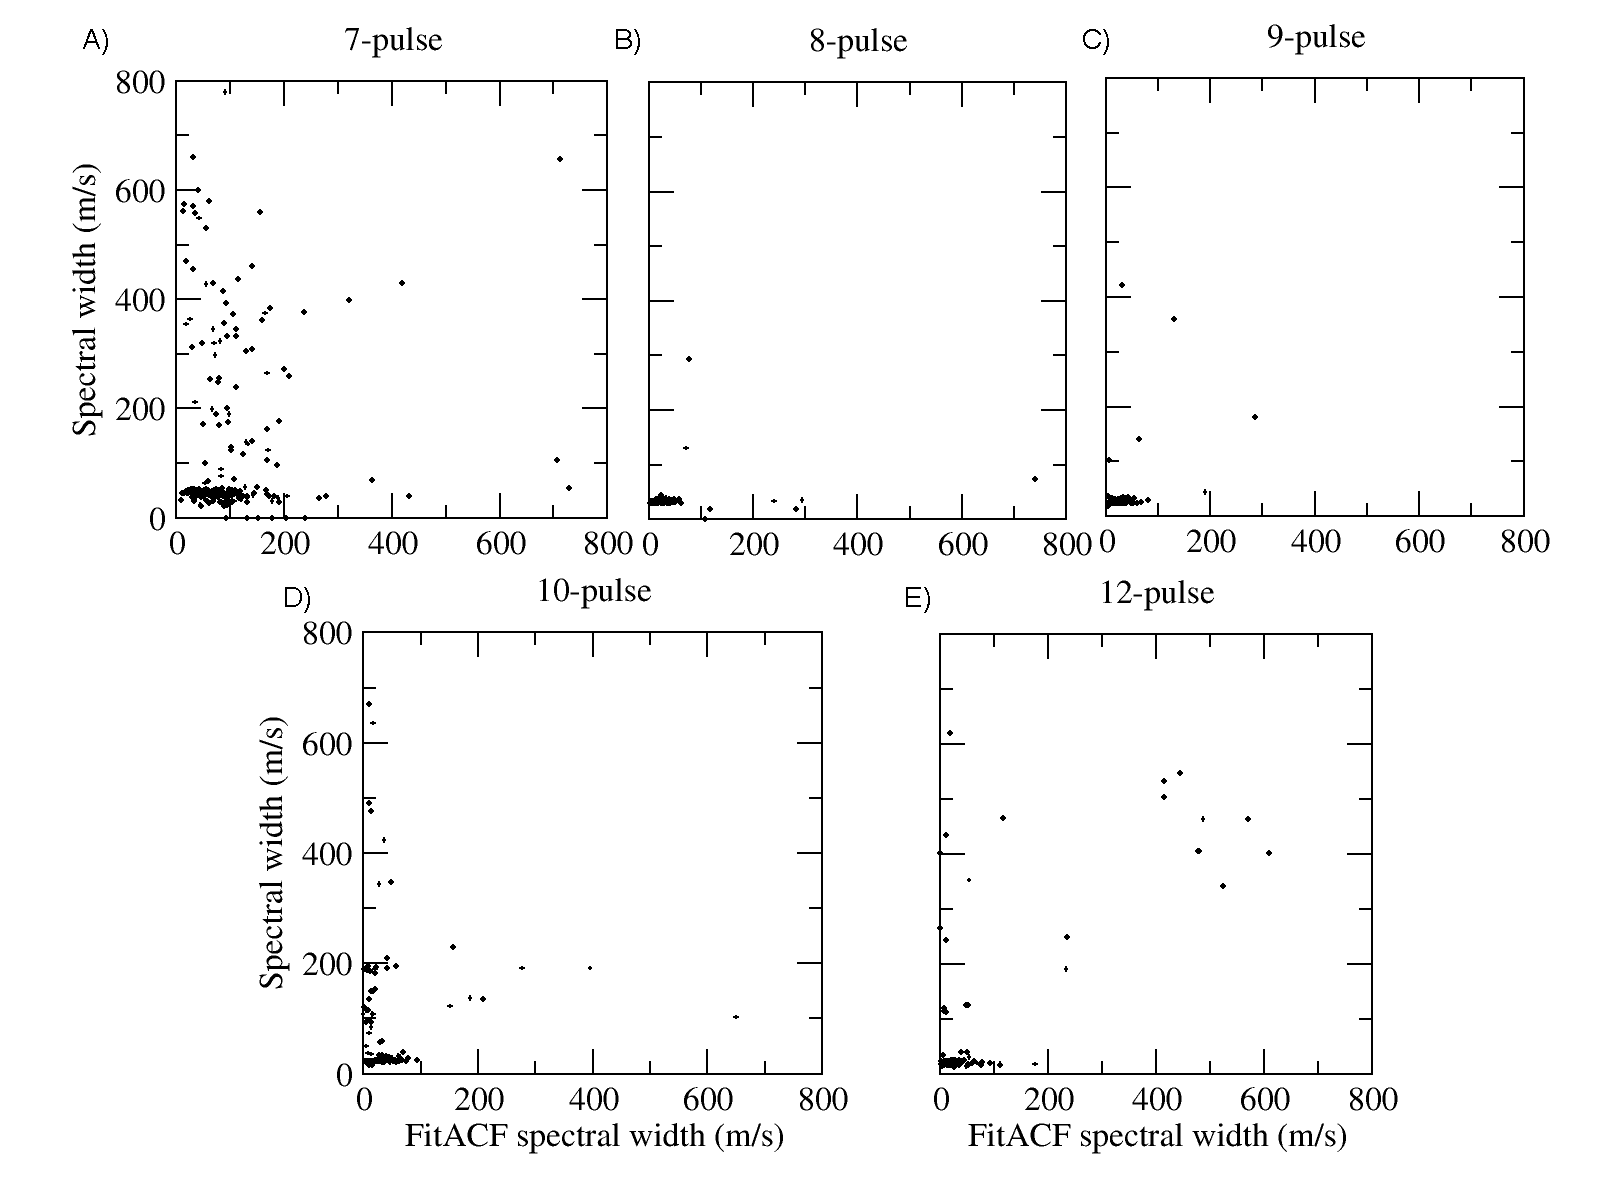
At Fig.5 we show a similar comparison between the spectral widths, calculated by the standard FitACF technique and spectral methods.
At the fig.5 one can see the area of greatest concentration of values that are related to the constant spectral width of the spectrum at a level correspondent to the theoretical spectral broadening for a given sequence. At the same the spectral width of these signals, calculated by the standard FitACF technique, differs significantly from the calculated from the spectrum. It should be noted that in some cases, especially for 7, 10 and 12-pulse sequences the high spectral widths calculated by FitACF technique, are close to the spectral widths calculated from the shape of the spectrum. This proves that high spectral widths are calculated well by FitACF technique for new pulses too.
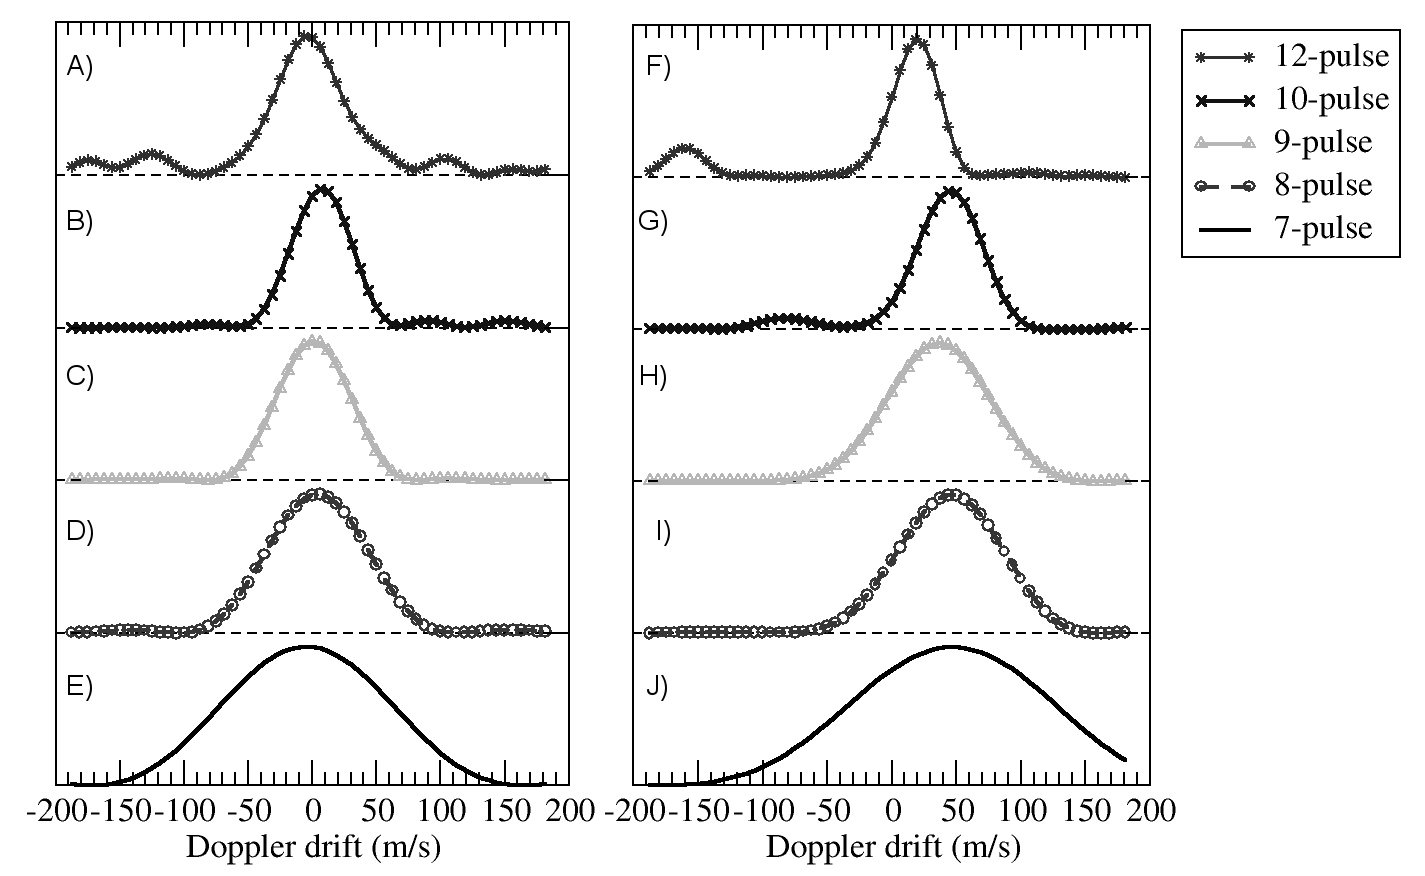
At Fig.6 we show the comparison of the scattered signal spectra in the case of the ground backscatter signal (Fig.6A) and ionospheric scatter (Fig.6B) for the case of the standard 7-pulse sequence and the new quasioptimal 8,9,10 and 12-pulse sequences. Ranges are identical, measurement time is approximately the same (with 1 hour accuracy). Accumulation time 8 seconds. From Fig.6A one can see that there is an effective narrowing of the scattered signal spectrum, as it is expected for using of a longer sounding sequence and is characteristically for the ground backscatter signal, that is narrowband enough. Doppler shift of the signal at the same time is less than 20m/s, which is also quite typical for ground backscatter signal. Sometimes, for example in the case of a 12-pulse sequence (Fig.6A) the spectrum has asymmetrical form, indicating the possible presence of multiple modes in the received signal. Thus, the ground backscatter signal showed that the parameters obtained by new sounding signals are in qualitative agreement (low spectral width, small Doppler drifts) with the expected characteristics.
From Fig.6B one can see that sometimes the signal scattered by ionospheric irregularities has an asymmetric spectra, sometimes with weak additional peaks (as well seen for 12- and 10-pulse sequences at Fig.6B)). Standard 7-pulse sequence in spectral technique is less sensitive to these effects [Danskin et al.(2004)], and therefore it is necessary to use more sophisticated inversion techniques [Barthes et al.(1998), Danskin et al.(2004), Ribeiro et al.(2013)] for the analysis of cases with complex or asymmetric spectra of the scattered signal.
4 Conclusion
In this paper we formulate a criterion of quasioptimal SuperDARN sounding signals for spectral measurements, which consists from simultaneous requirements: to maximize the first bad lag number in the correlation functions of the received signal; to decrease the density of bad lags, close to the absolute minimum; to provide spatial resolution that not worser than elementary pulse duration at all delays except zero. Solution of the problem corresponds to finding Golomb rulers [Golomb(1972)], satisfying the specified conditions.
On the basis of optimal and nearly optimal Golomb rulers we constructed quasioptimal sounding sequences satisfying the formulated principles, for the number of elementary pulses 7-20,24,26 (Table 3). It is shown that according to this approach the standard SuperDARN 7-pulse sounding signal [Greenwald et al.(1983)] is quasioptimal one, and 8-pulse katscan SuperDARN sounding signal [Ribeiro et al.(2013)] is not quasioptimal one.
It is shown that the optimal (for which all the required conditions are met, and the length of sequence becomes the minimal possible) from this point of view are 10, 12, 14, 18, 20 and possibly 24 and 26-pulse optimal Golomb rulers (Table 3).
It is shown that the sequence providing maximal relative efficiency over all the parameters (maximal relative number of good lags and maximal relative position of first bad lag) is 10-pulse optimal Golomb ruler (Table 3).
Experiments were made for sounding by the quasioptimal 8, 9, 10 and 12-pulse sequences at EKB radar and it is shown the continuity of the obtained data with data obtained by the standard 7-pulse sequence. We also obtained the expected improvement in spectral resolution.
Acknowledgments
The authors are grateful to ISDCT SB RAS for providing computing clusters ISC SB RAS - ’Blackford’ and ’Academician V.M.Matrosov’ (http://hpc.icc.ru) for numerical calculations. The authors thank Michael Feiri (University of Twente, Enschede, Netherlands) for the results of the calculation of nearly optimal Golomb sequences for (http://www.feiri.de/ogr/nearopt.html) and Pavlo Ponomarenko (University of Saskatchevan, Saskatoon, Canada) for useful discussions.
References
- [Barthes et al.(1998)] Barthes, L., R. André, J.-C. Cerisier, and J.-P. Villain (1998), Separation of multiple echoes using a high-resolution spectral analysis for SuperDARN HF radars// Radio Sci., 33(4), 1005–1017, DOI:10.1029/98RS00714.
- [Berngardt and Potekhin(2002)] Berngardt O.I. and A. P. Potekhin, Radar equations in the problem of radio wave backscattering during bistatic soundings//Radio Sci., 37(1), 8-1–8-8, DOI:10.1029/2000RS002315, 2002
- [Berngardt and Kushnarev(2013)] Berngardt O.I. and D.S. Kushnarev, Effective subtraction technique at the Irkutsk Incoherent Scatter Radar: Theory and experiment// Journal of Atmospheric and Solar-Terrestrial Physics, 105-106, 293–298, 2013, DOI: 10.1016/j.jastp.2013.03.023
- [Chisham et al.(2007)] Chisham G., M. Lester, S. E. Milan, M. P. Freeman, W. A. Bristow, A. Grocott, K. A. McWilliams, J. M. Ruohoniemi, T. K. Yeoman, P. L. Dyson, R. A. Greenwald, T. Kikuchi, M. Pinnock, J. P. S. Rash, N. Sato, G. J. Sofko, J.-P. Villain, A. D. M. Walker, A decade of the Super Dual Auroral Radar Network (SuperDARN): scientific achievements, new techniques and future directions//Surveys in Geophysics, 28(1), 33–109, 2007, DOI: 10.1007/s10712-007-9017-8
- [Danskin et al.(2004)] Danskin, D. W., A. V. Koustov, R. A. Makarevitch, and M. Lester, Observations of double-peaked E region coherent spectra with the CUTLASS Finland HF radar// Radio Sci., 39(2), RS2006, 2004, DOI:10.1029/2003RS002932.
- [Distributed.net Project webpage] distributed.net project - the Internet’s first general-purpose distributed computing project webpage, http://www.distributed.net/OGR
- [Farley(1972)] Farley, D. T., Multiple-Pulse Incoherent-Scatter Correlation Function Measurements// Radio Sci., 7(6), 661–666, 1972, DOI:10.1029/RS007i006p00661
- [Feiri webpage()] Feiri M., Near optimal Golomb rulers (Web page, http://www.feiri.de/ogr/nearopt.html)
- [Greenwald et al.(1983)] Greenwald R. A., K. B. Baker, J. P. Villain, Initial studies of small-scale F region irregularities at very high latitudes//Radio Sci., 18(6), 1122–1132, 1983
- [Greenwald et al.(2008)] Greenwald R.A., K.Oksavik, R.Barnes, J. M.Ruohoniemi, J.Baker and E.R. Talaat, First radar measurements of ionospheric electric fields at sub-second temporal resolution//Geophys.Res.Lett., 35(3), L03111, 2008
- [Golomb(1972)] Golomb, S. W. How to Number a Graph In Graph Theory and Computing (Ed. R. C. Read). New York: Academic Press, 23–37, 1972.
- [Haldoupis(1989)] Haldoupis C. A review on radio studies of auroral E-region ionospheric irregularities // Ann. Geophys. 7(3), 239–258, 1989.
- [Hanuise et al.(1993)] Hanuise C., Villain J.P., Gresillon D., Cabrit B., Greenwald R.A., Baker, K.B., Interpretation Of HF Radar Ionospheric Doppler Spectra By Collective Wave Scattering-Theory//Annales Geophysicae, 11(1), 29–39, 1993
- [Huber and Sofko(2000)] Huber M. and G.J. Sofko, Small-scale vortices in the high-latitude F region//Journal of Geophysical Research, 105 (9), 20885–20897, 2000, DOI:10.1029/1999ja000417
- [Lehtinen and Häggström(1987)] Lehtinen, M. S. and Häggström, I., A new modulation principle for incoherent scatter measurements// Radio Sci., 22(4), 625–634, 1987, DOI: 10.1029/RS022i004p00625
- [Markkanen et al.(2008)] Markkanen, M., Vierinen, J., and Markkanen, J.: Polyphase alternating codes// Ann. Geophys., 26, 2237–2243, 2008, doi:10.5194/angeo-26-2237-2008.
- [Potekhin and Berngardt(2000)] Potekhin A.P. and O.I.Berngardt, Radar equations in the radio wave backscattering problem//Radiophysics and Quantum electronics, 43(6), 484–492, 2000
- [Ribeiro et al.(2013)] Ribeiro A. J., J. M. Ruohoniemi, P. V. Ponomarenko, L. B. N. Clausen, J. B. H. Baker, R. A. Greenwald, K. Oksavik, S. de Larquier, A comparison of SuperDARN ACF fitting methods//Radio Sci., 48(3), 274–282, 2013, DOI: 10.1002/rds.20031
- [Schiffler(1996)] Schiffler A., SuperDARN measurements of duble-peaked velocity spectra, M.Sc. Thesis, University of Saskatchewan, Saskatoon, 1996
- [Schiffler et al.(1997)] Schiffler A., G.Sofko, P.T. Newell and R.Greenwald, Mapping the outer LLBL with SuperDARN double-peaked spectra//Geophysical Research Letters, 24(24), 3149–3152, 1997, DOI: 10.1029/97GL53304
- [Sulzer(1986)] Sulzer, M. P., A radar technique for high range resolution incoherent scatter autocorrelation function measurements utilizing the full average power of klystron radars// Radio Sci., 21(6), 1033–1040, 1986, doi:10.1029/RS021i006p01033.
| Type | N | Pulse positions | First bad lag | |
|---|---|---|---|---|
| 21-25 ([Farley(1972)]) | 7 | 0 1 11 16 19 23 25 | 0.84 | 13 |
| 21-27 (Standard SD, [Chisham et al.(2007)]) | 7 | 0 9 12 20 22 26 27 | 0.77 | 16 |
| 28-43 (Katscan SD, [Ribeiro et al.(2013)]) | 8 | 0 1 12 16 19 21 29 43 | 0.64 | 6 |
| EKB 28-34 (this paper) | 8 | 0 1 4 9 15 22 32 34 | 0.82 | 16 |
| EKB 36-44 (this paper) | 9 | 0 1 5 12 25 27 35 41 44 | 0.82 | 18 |
| EKB 45-55 (this paper) | 10 | 0 1 6 10 23 26 34 41 53 55 | 0.82 | 36 |
| EKB 55-72 (this paper) | 11 | 0 1 9 19 24 31 52 56 58 69 72 | 0.76 | 26 |
| EKB 66-85 (this paper) | 12 | 0 2 6 24 29 40 43 55 68 75 76 85 | 0.76 | 48 |
| EKB 78-106 (this paper) | 13 | 0 2 5 25 37 43 59 70 85 89 98 99 106 | 0.73 | 24 |
| N | M | L | Pulse positions | First bad lag | P | |
|---|---|---|---|---|---|---|
| 7 | 21 | 25 | 0 2 3 10 16 21 25 | 0.84 | 13 | 0.28 |
| 8 | 28 | 34 | 0 1 4 9 15 22 32 34 | 0.82 | 16 | 0.23 |
| 9 | 36 | 44 | 0 1 5 12 25 27 35 41 44 | 0.82 | 18 | 0.2 |
| 10+* | 45 | 55 | 0 1 6 10 23 26 34 41 53 55 | 0.82 | 36 | 0.18 |
| 11 | 55 | 72 | 0 1 9 19 24 31 52 56 58 69 72 | 0.76 | 26 | 0.15 |
| 12+* | 66 | 85 | 0 2 6 24 29 40 43 55 68 75 76 85 | 0.78 | 48 | 0.14 |
| 13 | 78 | 106 | 0 2 5 25 37 43 59 70 85 89 98 99 106 | 0.73 | 24 | 0.12 |
| 14* | 91 | 127 | 0 4 6 20 35 52 59 77 78 86 89 99 122 127 | 0.72 | 56 | 0.11 |
| 15 | 105 | 151 | 0 4 20 30 57 59 62 76 100 111 123 136 144 145 151 | 0.69 | 18 | 0.10 |
| 16* | 120 | 177 | 0 1 4 11 26 32 56 68 76 115 117 134 150 163 168 177 | 0.68 | 23 | 0.09 |
| 17 | 136 | 199 | 0 5 7 17 52 56 67 80 81 100 122 138 159 165 168 191 199 | 0.68 | 18 | 0.08 |
| 18+* | 153 | 216 | 0 2 10 22 53 56 82 83 89 98 130 148 153 167 188 192 205 216 | 0.70 | 91 | 0.08 |
| 19 | 171 | 246 | 0 1 6 25 32 72 100 108 120 130 153 169 187 190 204 231 233 242 246 | 0.69 | 50 | 0.08 |
| 20* | 190 | 283 | 0 1 8 11 68 77 94 116 121 156 158 179 194 208 212 228 240 253 259 283 | 0.67 | 98 | 0.07 |
| 21 | 210 | 333 | 0 2 24 56 77 82 83 95 129 144 179 186 195 255 265 285 293 296 310 329 333 | 0.63 | 29 | 0.06 |
| 22 | 231 | 356 | 0 1 9 14 43 70 106 122 124 128 159 179 204 223 253 263 270 291 330 341 353 356 | 0.65 | 24 | 0.06 |
| 23+ | 253 | 372 | 0 3 7 17 61 66 91 99 114 159 171 199 200 226 235 246 277 316 329 348 350 366 372 | 0.68 | 62 | 0.06 |
| 24* | 276 | 425 | 0 9 33 37 38 97 122 129 140 142 152 191 205 208 252 278 286 326 332 353 368 384 403 425 | 0.65 | 128 | 0.06 |
| 25 | 300 | 480 | 0 12 29 39 72 91 146 157 160 161 166 191 207 214 258 290 316 354 372 394 396 431 459 467 480 | 0.62 | 81 | 0.05 |
| 26+* | 325 | 492 | 0 1 33 83 104 110 124 163 185 200 203 249 251 258 314 318 343 356 386 430 440 456 464 475 487 492 | 0.66 | 159 | 0.05 |
| 27 | 351 | 553 | 0 3 15 41 66 95 97 106 142 152 220 221 225 242 295 330 338 354 382 388 402 415 486 504 523 546 553 | 0.63 | 32 | 0.05 |
| N | M | L | Pulse positions | First bad lag | FBL/L | |
|---|---|---|---|---|---|---|
| 7 | 21 | 27 | 0 9 12 20 22 26 27 | 0.77 | 16 | 0.59 |
| 8 | 28 | 35 | 0 4 5 17 19 25 28 35 | 0.80 | 22 | 0.62 |
| 9 | 36 | 45 | 0 2 10 24 25 29 36 42 45 | 0.80 | 28 | 0.62 |
| 10* | 45 | 55 | 0 1 6 10 23 26 34 41 53 55 | 0.82 | 36* | 0.65 |
| 11 | 55 | 83 | 0 4 5 16 22 24 31 45 70 73 83 | 0.66 | 30 | 0.36 |
| 12* | 66 | 85 | 0 2 6 24 29 40 43 55 68 75 76 85 | 0.78 | 48* | 0.56 |
| 13 | 78 | 113 | 0 3 13 25 33 39 54 85 86 102 104 109 113 | 0.69 | 34 | 0.30 |
| 14* | 91 | 127 | 0 4 6 20 35 52 59 77 78 86 89 99 122 127 | 0.72 | 56* | 0.44 |
| 15 | 105 | 156 | 0 2 15 33 49 56 68 104 118 126 129 146 150 155 156 | 0.67 | 39 | 0.25 |
| 16 | 120 | 184 | 0 11 32 33 60 68 75 77 80 106 131 147 161 165 171 184 | 0.65 | 39 | 0.21 |
| 17 | 136 | 201 | 0 5 15 34 35 42 73 75 86 89 98 134 151 155 177 183 201 | 0.67 | 72 | 0.35 |
| 18* | 153 | 216 | 0 2 10 22 53 56 82 83 89 98 130 148 153 167 188 192 205 216 | 0.70 | 91* | 0.42 |
| 19 | 171 | 294 | 0 3 7 13 28 39 47 48 98 121 167 184 198 200 222 227 264 276 294 | 0.58 | 52 | 0.17 |
| 20* | 190 | 283 | 0 1 8 11 68 77 94 116 121 156 158 179 194 208 212 228 240 253 259 283 | 0.67 | 98* | 0.34 |
| 24* | 276 | 425 | 0 9 33 37 38 97 122 129 140 142 152 191 205 208 252 278 286 326 332 353 368 384 403 425 | 0.65 | 128* | 0.30 |
| 26* | 325 | 492 | 0 1 33 83 104 110 124 163 185 200 203 249 251 258 314 318 343 356 386 430 440 456 464 475 487 492 | 0.66 | 159* | 0.32 |