dreyling-eschweiler_jan
First sensitivity limits of the ALPS TES detector
Abstract
The Any Light Particle Search II (ALPS II) requires a sensitive detection of 1064 nm photons. Thus, a low dark count rate () and a high detection efficiency () is needed. ALPS has set up a transition-edge sensor (TES) detector system, namely the ALPS TES detector. It is found that thermal photons from room temperature surfaces are the main contribution of dark counts for 1064 nm photon signals. Furthermore, the current setup of the ALPS TES detector shows an improvement compared to using the ALPS I detector.
1 Introduction
ALPS II is a light-shining-through-a-wall experiment based on an optical laser [1]. Compared to ALPS I, the overall experimental sensitivity will be increased by extending the magnetic length, improving the optical system and setting up a more sensitive photon detector.111These improvements can be illustrated by the board game “Axionator”, see the corresponding slides or contact the author. According to the latter, a detection of low-flux single 1064 nm photons is required [2]. Therefore, we have set to work on developing a TES detector system [3]. In the last year, the completed setup has been characterized concerning its experimental sensitivity for the first time [4].
2 ALPS detector sensitivity
The ALPS II experiment asks for a detection of low rates of single 1064 nm photons. The sensitivity of the axion-like particle-photon coupling, , concerning only the ALPS detector is defined as [5]:
| (1) |
where is the dark count222A dark count is defined as an event which cannot be distinguished from signals. rate and is the (overall) detection efficiency of the detector. The smaller this figure of merit the higher the gain for the ALPS experiment.
The ALPS I detector was a commercial state-of-the-art silicon-based charged-coupled device (CCD) [6]. Using this CCD camera to detect 1064 nm light, the sensitivity is limited due to % [7]. With s-1 [7] it results:
| (2) |
The goal of a new detector is to reach a higher sensitivity or lower figure of merit, .
3 The ALPS TES detector
Detectors based on transition-edge sensors (TESs) can reach a high sensitivity [8]. TESs are operated within the superconducting transition of the sensor’s material. Thus, small temperature changes like by a photon cause measurable changes of the electrical resistance.
For the ALPS TES detector, we are using a tungsten-based TES from NIST [9]. These kind of sensors are optimized for detecting single photons around 1064 nm. Single mode fibers are attached to NIST TES chips [10]. For 1064 nm signals, a detection efficiency of 97 % 2 % syst. 1 % stat. was measured [11]. Exact measurements of ALPS TES detector’s are underway within the collaboration. For the considered dark count rate in this paper (Sec. 5), we conservatively estimate [4]
| (3) |
which includes a low analysis efficiency due to necessary cuts on the signal region (Sec. 5).
We are operating the NIST TES at a bath temperature of mK K due to the superconducting transition mK of the TES [4]. The bath is provided by an adiabatic demagnetization refrigerator (ADR) system. The 2.5 K-precooling is provided by a pulse tube cooler. The subsequent mK-cooling is provided by a 6 T magnet and a salt pills unit, which allows to establish a continuous 80 mK-operation for h. The low-noise current read-out of the TES circuit is provided by an dc 2-stage SQUID from PTB [12]. For signal calibration as well as for long-background measurements, we have used an oscilloscope DPO7104C from Tektronix as data acquisition system (DAQ).
4 Signals and thermal photonic background
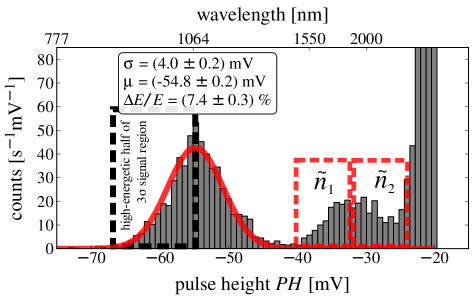
Applying an attenuated laser for single photon source, we consider the distribution of the pulse heights (Fig. 1). We observe three event classes [4]:
-
•
Signal photons: 1064 nm photons normally distribute around mV. Fitting a Gaussian distribution allows to define a signal region and to determine an energy resolution of a 1064 nm photon signal. We observe .
-
•
Sensor noise: The signal peak is clearly separated from the noise peak around mV. The noise is mainly caused by the fundamental TES noise.
-
•
Thermal photons: Thermal photon events are observed due to the warm fiber end at room temperature. The optical transmittance of the single mode fiber and the TES absorptivity cause an effective peak between 1550 and 2000 nm. Thermal photons through the fiber are confirmed by operating the TES in a K-environment without optical fiber link. Thermal photons are also observed by other groups as a reasonable background source [13].
While the intrinsic noise is no possible source for dark counts of 1064 nm signals, the spectrum of thermal photons can reach the 1064 nm signal region and result in a dark count. Further background events, like intrinsic, are well discriminated by a proper pulse shape analysis [4]. To estimate an expected dark count rate, we consider a conservative model: 300 K black body spectrum, no optical losses and an overall energy resolution of . Furthermore, we only consider the high-energetic 3-region of 1064 nm signals which corresponds to photon wavelength between 818 and 1064 nm (Sec. 5). This results in a photon rate of s-1 due to a room-temperature black body spectrum. This number is compared to long-term measurements in the next section.
5 Dark count rate
To determine the dark count rate of a fiber-coupled TES, the warm fiber end outside the cryostat was adequately covered, so that no ambient light can couple into the open fiber end. We have analyzed each trigger event of two long-term measurements ( h) offline. Only events showing a single photon pulse shape were taken into account [4].
Furthermore, as mentioned above, we only consider the high-energetic half 3-region of 1064 nm signals due to the used trigger level. This is necessary because of the used DAQ: A corresponding low trigger level around a of 1550 nm photons results in a too high trigger rate due to the thermal spectrum, which would cause dead time effects. For this setup, we determine a dark count rate of
| (4) |
Comparing this rate to the estimate rate due to a black body spectrum (Sec. 4) the measured rate is 1.5 orders of magnitude higher than the expected rate. It is found that a plausible explanation are pile-up events of thermal photons [4]. A first-order pile-up rate can be estimated by a formula describing accidental coincidences [14]: where is the resolving time and and uncorrelated rates. The time resolution of the current setup is constrained by the analysis method and is conservatively estimated by s. The rates and are estimated from Fig. 1: We split the thermal peak in two parts and assume that two photons from each part can effectively combine to a 1064 nm signal event. It is . Thus, the rate for first-order pile-ups imitating 1064 nm events is . is in the same order of magnitude as the measured rate (Eq. 4).
6 Conclusion
Using the ALPS TES detector, the experimental sensitivity (Eq. 1) results in
| (5) |
where we used the estimated (Eq. 3) and the measured (Eq. 4). Compared to the CCD (Eq. 2), this results in a sensitivity gain of for the ALPS experiment. This proves the gain of using a TES-based detector instead of the CCD camera system to detect single 1064 nm photons. Furthermore, we are motivated to improve the ALPS TES detector. Most promising is to reduce the thermal background by using an optical bandpass filter and an improved analysis for pile-up rejection.
Acknowledgments
The ALPS collaboration wants to thank the PTB and NIST for the support of their superconducting devices.
References
- [1] F. Januschek for the ALPS-II collaboration, “Review on LSW with lasers”, these proceedings.
- [2] R. Bähre et al., “Any Light Particle Search II – Technical Design Report”, JINST 1309, T09001 (2013) [arXiv:1302.5647].
- [3] J. Dreyling-Eschweiler et. al., “Detecting an infrared Photon within an Hour – Transition-Edge Detector at ALPS-II”, Proceedings of 9th Patras Workshop 2013 [arXiv:1309.5024]
- [4] J. Dreyling-Eschweiler, “A superconducting microcalorimeter for low-flux detection of near-infrared single photons”, DESY-THESIS-2014-016, ISSN 1435-8085.
- [5] J. E. von Seggern, “Overview on Low-flux Detectors”, Proceedings of 9th Patras Workshop 2013 [arXiv:1310.0660]
- [6] K. Ehret et al., “New ALPS Results on Hidden-Sector Lightweights”, Phys. Lett. B 689, 149 (2010) [arXiv:1004.1313].
- [7] J. E. von Seggern, “Constraining Weakly Interacting Slim Particles with a Massive Star and in the Laboratory”, DESY-THESIS-2014-001, ISSN 1435-8085.
- [8] K. D. Irwin and G. C. Hilton, “Transition-Edge Sensors”, In: C. Enss, “Cryogenic Particle Detectors”, Springer-Verlag Berlin Heidelberg (2005)
- [9] A. E. Lita et al., “Superconducting transition-edge sensors optimized for high-efficiency photon-number resolving detectors”, SPIE Conf. Ser. 7681 (2010)
- [10] A. J. Miller et al., “Compact cryogenic self-aligning fiber-to-detector coupling with losses below one percent”, Opt. Express 19(10) (2012)
- [11] A. E. Lita, Private communication (2013)
- [12] D. Drung et al., “Highly Sensitive and Easy-to-Use SQUID Sensors”, IEEE Transactions on Applied Superconductivity 17:699–704 (2007)
- [13] A. J. Miller et al., “Superconducting photon number resolving detectors: Performance and promise”, Proceedings of the 8th international conference on quantum communication, measurement and computing (NICT Press, 2007)
- [14] C. Eckart and F. R. Shonka, “Accidental Coincidences in Counter Circuits”, Phys. Rev., 53:752–756 (1938)