Constraints on photoevaporation models from (lack of) radio emission in the Corona Australis protoplanetary disks.
Photoevaporation due to high-energy stellar photons is thought to be one of the main drivers of protoplanetary disk dispersal. The fully or partially ionized disk surface is expected to produce free-free continuum emission at centimeter (cm) wavelengths that can be routinely detected with interferometers such as the upgraded Very Large Array (VLA). We use deep (rms noise down to 8 Jy beam-1 in the field of view center) 3.5 cm maps of the nearby (130 pc) Corona Australis (CrA) star formation (SF) region to constrain disk photoevaporation models. We find that the radio emission from disk sources in CrA is surprisingly faint. Only 3 out of 10 sources within the field of view are detected, with flux densities of order Jy. However, a significant fraction of their emission is non-thermal. Typical upper limits for non-detections are Jy beam-1. Assuming analytic expressions for the free-free emission from extreme-UV (EUV) irradiation, we derive stringent upper limits to the ionizing photon luminosity impinging on the disk surface s-1. These limits constrain to the low end of the values needed by EUV-driven photoevaporation models to clear protoplanetary disks in the observed few Myr timescale. Therefore, at least in CrA, EUV-driven photoevaporation is not likely to be the main agent of disk dispersal. We also compare the observed X-ray luminosities of disk sources with models in which photoevaporation is driven by such photons. Although predictions are less specific than for the EUV case, most of the observed fluxes (upper limits) are roughly consistent with the (scaled) predictions. Deeper observations, as well as predictions spanning a wider parameter space, are needed to properly test X-ray driven photoevaporation.
Key Words.:
protoplanetary disks – stars: pre-main sequence – stars: formation1 Introduction
The mechanisms that drive the dispersal of disks around young stars are not well understood. Photoevaporation of the disk driven by high-energy radiation from the central star is thought to act in concert with viscous accretion and the formation of planets. A recent review of the topic is presented by Alexander et al. (2013). Several models have been put forward to describe disk photoevaporation, including analytical flow solutions (e.g., Hollenbach et al. 1994; Gorti & Hollenbach 2009) and hydrodynamical simulations (e.g., Alexander et al. 2006; Owen et al. 2010). Mid-infrared forbidden lines such as the [Ne II] have been used to infer the presence of photoevaporative flows (e.g., Pascucci & Sterzik 2009) from disks around low-mass young stellar objects (YSOs).
Pascucci et al. (2012) and Owen et al. (2013) (hereafter Pascucci12 and Owen13, respectively) published predictions for the radio-continuum emission from (partially) ionized disk surfaces around low-mass YSOs that may be photoevaporating. Pascucci12 showed that free-free emission from the disk surface is directly proportional to the ionizing stellar radiation111The extreme-UV (EUV) radiation, with eV. reaching the disk. If the photoevaporation is driven by X-rays ( keV), the interaction of photons with matter is more complex and the resulting gas temperatures and ionization fraction can depart considerably from the K and characteristic of the EUV case. The effects of far-UV radiation ( eV) add further chemical complexity (Gorti & Hollenbach 2009), but this type of radiation is relevant even in photoevaporation models dominated by X-ray heating since it regulates the destruction of molecular coolants. Deep radio observations of many protoplanetary disks are needed to better constrain photoevaporation models. Recently, Pascucci et al. (2014) analyzed the cm emission from 14 circumstellar disks and found EUV photon luminosities () lower than s-1 for sources with no jets and lower than s-1 for three older systems in their sample, thus placing a tight constraint on photoevaporation models.
In this Letter we analyze the 8.5 GHz (3.5 cm) continuum emission of the 10 protoplanetary disks within our VLA field of view towards the central part of the Corona Australis (hereafter CrA) star formation region. This nearby region has been studied in the past at all wavelengths from the cm radio to the X-rays (e.g., Choi et al. 2008; Lindberg et al. 2014; Peterson et al. 2011; Forbrich et al. 2007, and references therein). The distance to CrA is pc (Neuhäuser & Forbrich 2008).
2 Data
The data analyzed here were presented in Liu et al. (2014) (hereafter Liu14) and are part of a larger VLA222The National Radio Astronomy Observatory is operated by Associated Universities, Inc. under cooperative agreement with the National Science Foundation. program to monitor the time variability of radio sources in nearby, low-mass star formation regions. One of the main products of the program are radio continuum images with sensitivity down to a few microjanskys.
The main continuum map used here concatenates 14 VLA epochs in 2012. It covers the continuous frequency range from 8 GHz (3.7 cm) to 9 GHz (3.3 cm) and reaches an rms noise of Jy beam-1 in the center of the field. The half-power beam width (HPBW) of the primary beam is 315″, and the beamwidth at 10% power is 530″. The synthesized HPBW is , PA. Further details of the observations are described in Liu14. Analysis of the data was performed in CASA (McMullin et al. 2007).
3 Results
3.1 Source list
| (1) | (2) | (3) | (4) | (5) | (6) | (7) | (8) | (9) | (10) |
|---|---|---|---|---|---|---|---|---|---|
| Name | RA | Dec | CSA11 | SA13 | PB-corrected noise | Spectral | Comments | ||
| [h:m:s] | [deg:arcmin:arcsec] | [Jy] | [Jy] | [erg s-1] | type | ||||
| G-95 | 19:01:28.72 | -36:59:31.7 | TD | … | 60 | M1 | … | ||
| G-87 | 19:01:32.32 | -36:58:03.0 | TD | TD | 20 | … | M1.5 | … | |
| G-85 | 19:01:33.85 | -36:57:44.8 | PD | pre-TD | 20 | M0.5 | … | ||
| V709 | 19:01:34.84 | -37:00:56.7 | TD/DD | … | 50 | K1 | a | ||
| HBC-677 | 19:01:41.62 | -36:59:53.1 | PD | PD | 15 | M2 | … | ||
| IRS8 | 19:01:51.11 | -36:54:12.5 | PD | … | 40 | … | M2 | … | |
| R CrA | 19:01:53.67 | -36:57:08.3 | PD | … | 10 | A5 | b | ||
| CrA-465 | 19:01:53.74 | -37:00:33.9 | PD | … | 20 | … | M5-M7.5 | … | |
| G-32 | 19:01:58.33 | -37:00:26.7 | PD | … | 20 | … | … | ||
| T CrA | 19:01:58.79 | -36:57:50.1 | PD | PD | 15 | … | F0 | c |
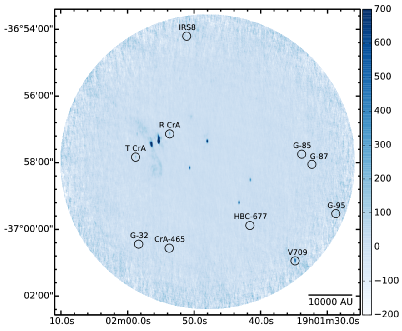
We compiled a list of the protoplanetary disks in CrA and searched for their radio continuum emission in our deep VLA images, restricting ourselves to sources within the 10% response level of the primary beam (the interferometric field of view). Protoplanetary disks were identified based on the catalogues of Currie & Sicilia-Aguilar (2011) (hereafter CSA11) and Sicilia-Aguilar et al. (2013) (hereafter SA13). CSA11 use Spitzer IRAC and MIPS photometry and IRS spectroscopy in their models, whereas SA13 complement with Herschel far-infrared PACS photometry.
Table 1 lists the basic properties of the disks in CrA, and figure 1 shows the deep radio map with the targets labeled. We only consider objects classified as primordial, pre-transitional, or transitional disks (roughly equivalent to class II YSOs). The age of the considered sources is 1 to 3 Myr (CSA11).
3.2 The radio-continuum of disks in CrA
The radio-continuum emission of YSOs associated with disks can in principle have contributions from several physical mechanisms. Disk-photoevaporation models emphasize the contribution from the free-free emission of the photoionized disk wind (Avalos & Lizano (2012), Pascucci12, Owen13). Free-free emission from magnetohydrodynamical jets dominates in class 0 and I YSOs (e.g., Anglada et al. 1998; Reipurth et al. 2004), but their contribution in class IIs should be smaller. The models of Shang et al. (2004) (aimed at class I YSOs) predict a 3.5 cm flux of 16 Jy at 140 pc for their lowest jet mass-loss rate calculation of yr-1. Typical mass-loss rates in class II YSOs are smaller. Therefore, we expect the jet free-free contamination to be below the noise. In contrast, gyrosynchrotron emission from active magnetospheres can contribute significantly and even dominate the radio-continuum emission in class II and III YSOs (e.g., Gibb 1999; Forbrich et al. 2007). Finally, it is also possible that large dust grains emit significantly at short cm wavelenths, for example in TW Hydrae (Wilner et al. (2005), Pascucci12). However, this may not be typical. Rodmann et al. (2006) investigated the dust and free-free contributions at 7 mm in protoplanetary disks and find that of the emission is from dust. Assuming a dust spectral index typical of disks to 2.5 (e.g., Ricci et al. 2010), this translates into only to dust emission at 3.5 cm.
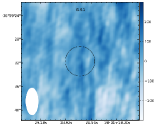
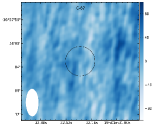
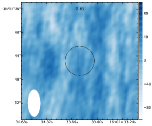
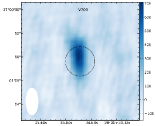
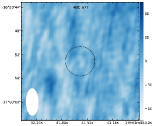
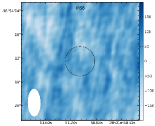
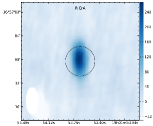
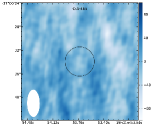
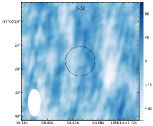
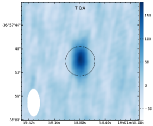
We searched for radio continuum emission in our deep map toward the disks listed in Table 1. The main result of our search is that 7 out of 10 targets are not detected. 5 out of the 7 non-detections have upper limits to the peak intensity Jy beam-1 (see Table 1). This sets a tight constraint on disk-photoevaporation models (Section 4). For the detections, the flux density was measured using the task imfit in CASA. Figure A.1 in the online appendix shows the field around each YSO individually.
Although it is difficult to quantify the relative contributions of thermal (free-free) and non-thermal (gyrosynchrotron) emission for the detections, the dominant mechanism can be identified from the spectral index and the variability properties. There is currently no information on the spectral index of the radio detections. However, the three detected disk sources (V709, R CrA, T CrA) were identified by Liu14 as highly variable. In maps of the 14 individual epochs that were coadded in the final deep image, these sources can sometimes be detected at a level of a few Jy (or up to mJy for V709) and then be non-detections even between observations separated by as little as day (Liu14). This large variability shows that most of the cm flux of the detected sources is not due to stable, free-free emission from a photoevaporative flow, but most likely due to non-thermal (gyro)synchrotron emission from magnetic activity closer to the stellar surface (e.g., Liu14, Forbrich et al. 2007). We estimate the free-free contribution at 3.5 cm in the detections by assuming that free-free is relatively stable in time compared to (gyro)synchrotron emission (Liu14). Then we make images that include the concatenated data from each of the individual epochs in which each of them is not detected, and measure the fluxes. We obtain free-free fluxes Jy ( of the total flux), Jy (), and Jy (). We note that these are still strict upper limits to the free-free emission. Also, if any of the extra processes mentioned above is significant, it would push down the upper limits to the ionizing fluxes derived in Section 4.
The X-ray properties of the radio-detected sources also hint that radio emission, when bright, is mainly due to magnetospheric activity. Forbrich & Preibisch (2007) presented a deep Chandra observation of CrA. From the spectral shape and time-domain properties of the sources in CrA, those authors conclude that the YSOs X-ray emission is dominated by coronal activity, consistent with our interpretation of the cm detections as having significant coronal (gyro)synchrotron emission. Table 1 also lists the X-ray luminosities in the 0.2 – 8 keV band of the disk sources in CrA. Note that V709 is the most luminous in X-rays (it also shows variations up to within days, Forbrich & Preibisch 2007). R CrA is the third most luminous X-ray source and shows variations of a factor of 5 within days. In contrast, T CrA is barely detected in X-rays, and there is no information on its variability (Forbrich & Preibisch 2007).
4 Implications for models of disk photoevaporation
We use our observations to constrain possible models of protoplanetary disk photoevaporation. First we compare quantitatively with predictions from EUV-driven photoevaporation models. Because the free-free emission is directly proportional to the EUV luminosity reaching the disk (), we can use equation 2 of Pascucci12 to derive upper limits to . The main assumptions here are that the surface of the disk is almost fully ionized at K and that the fraction of EUV photons absorbed by the disk is 0.7 (Hollenbach & Gorti 2009). We then compare with X-ray driven models, for which there are still important uncertainties on the assumptions (Alexander et al. 2013). Therefore, in this case the comparison is more qualitative.
Table 2 summarizes the comparison to the predictions of Pascucci12. The constraints to models of EUV-driven photoevaporation are strong. 9 out of 10 upper limits to the ionizing-photon luminosity are in the range s-1. The EUV photon luminosity emitted by young pre-main sequence stars is constrained only for a handful of sources but is always found to be and often s-1 (Alexander et al. 2005; Herczeg 2007). However, these results are dependent on reddening, and not all the emitted photons necessarily reach the disk. Theoretical models typically use s-1 or higher. On the lower end, Font et al. (2004) calculates models for to s-1. More recent models that put emphasis in satisfying the constraint of a disk lifetime of a few Myr (e.g., Hernández et al. 2007) use s-1 (e.g., Alexander et al. 2006). Alexander & Armitage (2009) present a grid of models with coupled photoevaporation, viscous transport, and Type II migration. Using s-1, those authors find a median disk lifetime of 4 Myr, consistent with observational constraints. Our observations show that, at least for most of the disks in CrA, is on the low side of the broad range of used in models.
Upper limits to from Pascucci12 are listed in Table 2. These limits are at least one order of magnitude higher than the observed (Table 1). Therefore, if , from these models we would expect to detect the sources at a level of to 10 Jy (below our sensitivity). For the 3 detections, the observed cm flux appears to be too high with respect to the model predictions. This could be explained if the stable cm flux, which we tentatively attribute to free-free emission from photoevaporation, still has contributions from other processes (Section 3.2).
We now compare to the radiative transfer calculations on hydrodynamical simulations presented by Owen13, who use a fiducial X-ray luminosity erg s-1. We note that for a given , Owen13 predicts a larger free-free flux than Pascucci12. The difference could be due to Owen13 using an unattenuated stellar spectrum, which may still contain substantial EUV and soft-Xray emission, but this is not certain. If we scale the frequency and distance of their predictions to 8 GHz and 130 pc444Owen13 provides spectral indices between 8 GHz and their anchor predictions at 15 GHz of for X-ray driven photoevaporation., we find that the expected 3.5 cm flux is Jy (see figure 11 in Owen13). From Table 1 we see that, roughly, the 3 sources with close to erg s-1 have free-free fluxes (V709555Note that the evolutionary stage of V709 is not clear: it is the only source in the sample that could be a debris disk, in which case no photoevaporation signal is expected., R CrA) or upper limits (G-95) consistent with these model predictions. We do not compare the results of Owen13 with the rest of our sources with lower , since it is not clear which fraction of the predicted free-free emission is only due to the X-rays in their input stellar spectrum.
Since photoevaporation driven purely by X-rays would produce lower free-free fluxes, deeper observations are needed to probe this regime. Model predictions spanning parameter space towards lower EUV and X-ray luminosities and different X-ray hardness are also needed.
| Name | ||
|---|---|---|
| [s-1] | [erg s-1] | |
| G-95 | ||
| G-87 | ||
| G-85 | ||
| V709 | ||
| HBC-677 | ||
| IRS 8 | ||
| R CrA | ||
| CrA-465 | ||
| G-32 | ||
| T CrA |
5 Conclusions
With the purpose of constraining models of protoplanetary disk clearing via photoevaporation, we inspect the 8.5 GHz (3.5 cm) continuum emission of disks in the nearby (130 pc) CrA star formation region. We use the deep (noise down to 8 Jy beam-1 in the center of the field of view) maps from our monitoring survey of low mass YSOs (Liu14).
We find that disks are radio faint: 7 out of 10 targets are not detected. 5 of the non-detections have upper limits Jy beam-1, and all of them have Jy beam-1. Furthermore, for the 3 radio detections, their radio variability and X-ray properties indicate that a significant fraction of their radio flux is due to non-thermal processes, rather than due to the putative photoevaporative flow. We measure the stable 3.5 cm flux ( to 507 Jy) of the 3 detections and attribute it to free-free emission. Strictly, these are still upper limits to the fluxes from photoevaporation.
Using the prescription of Pascucci12 for EUV-driven photoevaporation, we derive tight upper limits to the rate of ionizing photons reaching the disk : 9 out of 10 disks in our field of view have s-1. These upper limits discard the higher end of what EUV-driven photoevaporation models require to clear a protoplanetary disk in the observed timescale of a few Myr. Also, the limits we derive from radio observations are lower than the previous estimations of the EUV photons emitted by the star derived by Alexander et al. (2005) and Herczeg (2007). This suggests that a significant fraction of the emitted EUV photons does not reach the disk. Our results, together with those recently reported by Pascucci et al. (2014), show that EUV photons are unlikely to be the main driver in disk dispersal.
We also compare to models of X-ray driven photoevaporation. This comparison is more qualitative because there is more room for variation in the model assumptions. Most of the observed fluxes (upper limits) are roughly consistent with the (scaled) predictions. Some detections appear to be too bright in the radio. However, their stable cm flux could still have some contamination.
Future, deeper maps of this and other star formation regions (including variability information), together with X-ray and near-infrared data (to obtain accretion rates) will help to set tighter constraints on the mechanisms that drive protoplanetary disk photoevaporation. More specific predictions, in particular for lower EUV and X-ray luminosities, are also needed.
Acknowledgements.
This research made use of APLpy, an open-source plotting package for Python hosted at http://aplpy.github.com. R.G.-M. acknowledges funding from the European Community’s Seventh Framework Programme (/FP7/2007-2013/) under grant agreement No. 229517R. I.P. acknowledges support from the NSF Astronomy & Astrophysics Research Grant 1312962. The authors thank the anonymous referee for an insightful report.References
- Acke & van den Ancker (2004) Acke, B. & van den Ancker, M. E. 2004, A&A, 426, 151
- Alexander et al. (2013) Alexander, R., Pascucci, I., Andrews, S., Armitage, P., & Cieza, L. 2013, ArXiv e-prints
- Alexander & Armitage (2009) Alexander, R. D. & Armitage, P. J. 2009, ApJ, 704, 989
- Alexander et al. (2005) Alexander, R. D., Clarke, C. J., & Pringle, J. E. 2005, MNRAS, 358, 283
- Alexander et al. (2006) Alexander, R. D., Clarke, C. J., & Pringle, J. E. 2006, MNRAS, 369, 229
- Anglada et al. (1998) Anglada, G., Villuendas, E., Estalella, R., et al. 1998, AJ, 116, 2953
- Avalos & Lizano (2012) Avalos, M. & Lizano, S. 2012, ApJ, 751, 63
- Choi et al. (2008) Choi, M., Hamaguchi, K., Lee, J.-E., & Tatematsu, K. 2008, ApJ, 687, 406
- Currie & Sicilia-Aguilar (2011) Currie, T. & Sicilia-Aguilar, A. 2011, ApJ, 732, 24
- Font et al. (2004) Font, A. S., McCarthy, I. G., Johnstone, D., & Ballantyne, D. R. 2004, ApJ, 607, 890
- Forbrich & Preibisch (2007) Forbrich, J. & Preibisch, T. 2007, A&A, 475, 959
- Forbrich et al. (2007) Forbrich, J., Preibisch, T., Menten, K. M., et al. 2007, A&A, 464, 1003
- Gibb (1999) Gibb, A. G. 1999, MNRAS, 304, 1
- Gorti & Hollenbach (2009) Gorti, U. & Hollenbach, D. 2009, ApJ, 690, 1539
- Herczeg (2007) Herczeg, G. J. 2007, in IAU Symposium, Vol. 243, IAU Symposium, ed. J. Bouvier & I. Appenzeller, 147–154
- Hernández et al. (2007) Hernández, J., Hartmann, L., Megeath, T., et al. 2007, ApJ, 662, 1067
- Hollenbach & Gorti (2009) Hollenbach, D. & Gorti, U. 2009, ApJ, 703, 1203
- Hollenbach et al. (1994) Hollenbach, D., Johnstone, D., Lizano, S., & Shu, F. 1994, ApJ, 428, 654
- Lindberg et al. (2014) Lindberg, J. E., Jørgensen, J. K., Brinch, C., et al. 2014, A&A, 566, A74
- Liu et al. (2014) Liu, H. B., Galván-Madrid, R., Forbrich, J., et al. 2014, ApJ, 780, 155
- López Martí et al. (2005) López Martí, B., Eislöffel, J., & Mundt, R. 2005, A&A, 444, 175
- McMullin et al. (2007) McMullin, J. P., Waters, B., Schiebel, D., Young, W., & Golap, K. 2007, in Astronomical Society of the Pacific Conference Series, Vol. 376, Astronomical Data Analysis Software and Systems XVI, ed. R. A. Shaw, F. Hill, & D. J. Bell, 127
- Meyer & Wilking (2009) Meyer, M. R. & Wilking, B. A. 2009, PASP, 121, 350
- Neuhäuser & Forbrich (2008) Neuhäuser, R. & Forbrich, J. 2008, The Corona Australis Star Forming Region, ed. B. Reipurth, 735
- Owen et al. (2010) Owen, J. E., Ercolano, B., Clarke, C. J., & Alexander, R. D. 2010, MNRAS, 401, 1415
- Owen et al. (2013) Owen, J. E., Scaife, A. M. M., & Ercolano, B. 2013, MNRAS, 434, 3378
- Pascucci et al. (2012) Pascucci, I., Gorti, U., & Hollenbach, D. 2012, ApJ, 751, L42
- Pascucci et al. (2014) Pascucci, I., Ricci, L., Gorti, U., et al. 2014, ArXiv e-prints
- Pascucci & Sterzik (2009) Pascucci, I. & Sterzik, M. 2009, ApJ, 702, 724
- Peterson et al. (2011) Peterson, D. E., Caratti o Garatti, A., Bourke, T. L., et al. 2011, ApJS, 194, 43
- Reipurth et al. (2004) Reipurth, B., Rodríguez, L. F., Anglada, G., & Bally, J. 2004, AJ, 127, 1736
- Ricci et al. (2010) Ricci, L., Testi, L., Natta, A., et al. 2010, A&A, 512, A15
- Rodmann et al. (2006) Rodmann, J., Henning, T., Chandler, C. J., Mundy, L. G., & Wilner, D. J. 2006, A&A, 446, 211
- Shang et al. (2004) Shang, H., Lizano, S., Glassgold, A., & Shu, F. 2004, ApJ, 612, L69
- Sicilia-Aguilar et al. (2013) Sicilia-Aguilar, A., Henning, T., Linz, H., et al. 2013, A&A, 551, A34
- Wilner et al. (2005) Wilner, D. J., D’Alessio, P., Calvet, N., Claussen, M. J., & Hartmann, L. 2005, ApJ, 626, L109
Appendix A Individual maps of the targets
 |
 |
 |
 |
 |
 |
 |
 |
 |
 |