Structural, elastic, thermal, and electronic response of small-molecule-loaded metal organic framework materials
Abstract
We combine infrared spectroscopy, nano-indentation measurements, and ab initio simulations to study the evolution of structural, elastic, thermal, and electronic responses of the metal organic framework MOF-74-Zn when loaded with H2, CO2, CH4, and H2O. We find that the molecular adsorption in this MOF triggers remarkable responses in all of these properties of the host material, with specific signatures for each of the guest molecules. With this comprehensive study we are able to clarify and correlate the underlying mechanisms regulating these responses with changes of the physical and chemical environment. Our findings suggest that metal organic framework materials in general, and MOF-74-Zn in particular, can be very promising materials for novel transducers and sensor applications, including highly selective small-molecule detection in gas mixtures.
pacs:
68.43.Bc, 68.43.Mn, 84.60.-h, 84.60.VeI Introduction
External stimuli—such as heat, pressure, electric or magnetic fields, or more complex chemical stimuli including interactions with other chemical species—can induce changes in a material’s physical properties. The response of materials to such stimuli is the underlying principle of sensors. The design and improvement of materials in which this response is easy to control, reproducible, or can be related to the interaction with specific molecules, has seen a surge of interest over the last decade in many areas of material science.Perez et al. (2002); Saleh and Sohn (2003); Yogeswaran and Chen (2008); Melde et al. (2008); Tan and Cheetham (2011); Kreno et al. (2012)
Many of the current commercial chemical sensors contain inorganic semiconductor- or polymer-based films sensitive to the adsorption of specific molecular species.Kreno et al. (2012) Despite the tremendous success of such thin-film materials, they also have shortcomings including i) film poisoning (which compromises the sensor lifetime), ii) poor selectivity toward specific molecules, iii) extreme operational conditions (i.e. high temperatures), iv) cross-sensitivity, v) hysteresis (which affects the reliability of the sensor over time), and vi) processing and preparation.Kreno et al. (2012) In the following, we will demonstrate that metal organic framework (MOF) materials can de facto overcome most of these issues with an unprecedented structural diversity, tailorability, and tunability clearly linked to their discrete molecular building-block nature. As a result, MOFs are studied in a large variety of applications such as gas storage and sequestration,Nijem et al. (2012a); Canepa et al. (2013a) catalysis,Lee et al. (2009); Luz et al. (2010) polymerization reactions,Uemura et al. (2009); Vitorino et al. (2009) luminescence,Allendorf et al. (2009); White et al. (2009) non-linear optics,Bordiga et al. (2004) magnetism,Kurmoo (2009) localized drug delivery,Horcajada et al. (2010) multiferroics,Stroppa et al. (2011, 2013); Di Sante et al. (2013) and finally for sensing molecules.Serre et al. (2007); Soo and Goddard (2007); Allendorf et al. (2008); Tan and Cheetham (2011); Kreno et al. (2012); Qiu and Zhu (2009); Xie et al. (2010)
The flexibility of MOFs, imposed by their hybrid metal/linker type structure, makes them very responsive to changes of the external physical and chemical environment.Kreno et al. (2012) For example, Sere et al.Serre et al. (2007) demonstrated that IRMOF-1 displays a change in its flexibility, about 10%, when molecules are adsorbed within its pores. On the other hand, a large part of the MOF literature emphasizes their chemical selectivity towards specific gas-molecule targets to maximize their uptakes. Thus, combining the flexibility of MOFs with their selectivity towards molecules, we can build sensors with tunable specificity.Kreno et al. (2012) At the atomic level this sensing is described as an energy transformation, i.e. the chemical energy released in the adsorption process is fully (or partially) transduced into mechanical energy, affecting the final structural, elastic, thermal, and electronic properties of the MOF. Therefore, in order to elucidate the link between the change of physical properties induced by molecular adsorption in MOFs, it is important to investigate such systems using a bottom-up approach, i.e. from the atomic level to the macroscopic level.
In this work we use DFT-based ab initio simulations to study the structural, elastic, thermal, and electronic response of MOF-74-Zn when loaded with H2, CO2, CH4, and H2O. We show that—while MOF-74-Zn is usually considered a “rigid” MOF compared to more flexible candidates, e.g. MIL53Walker et al. (2010); Ortiz et al. (2012)—a substantial change of its structural, elastic, and thermal properties is observed after molecular adsorption. Our predictions are supported by in-situ IR spectroscopy and nano-indentation measurements. We further show that its electronic properties, and most importantly the electron and hole effective masses, change significantly upon molecule adsorption, with characteristic values for different adsorbates. This opens the door to direct sensing through electrical measurements and leads us to conclude that slightly-doped MOF-74-Zn is a very promising material for sensing applications.
II Technical details
II.1 Computational details
To model the properties presented in this work we use the van der Waals exchange and correlation functional vdW-DF,Dion et al. (2004); Thonhauser et al. (2007); Langreth et al. (2009) as implemented in VASP. Kresse and Furthmüller (1996); Kresse and Joubert (1999a) We have already successfully applied vdW-DF to investigate the adsorption of small molecules in MOFs and nano-structures in numerous other studies.Nijem et al. (2012a); Canepa et al. (2013a); Yao et al. (2012); Canepa et al. (2013b); Lopez et al. (2013); Nijem et al. (2012b, 2013); Tan et al. (2012a, 2013); Zuluaga et al. (2014) Projector augmented-wave theory,Blöchl (1994); Kresse and Joubert (1999b) combined with a well-converged plane-wave cutoff of 600 eV, were used to describe the wave functions. The total energy was sampled on a 222 k-point grid, resulting in four irreducible k-points, necessary to fully converge the stress tensor. The density of states (DOS), band structures, and related properties where calculated on a grid of 172 k-points (equivalent to a -centered 101010 k-point mesh). The convergence threshold for the total energy was set to 110-8 eV, ensuring an accurate sampling of the complex potential energy surface of MOF-74-Zn. The internal geometry and volumeSabatini et al. (2012) of MOF-74-Zn, empty and filled with H2, CO2, CH4, and H2O, were fully relaxed using vdW-DF until the force criterion of 110-4 eV Å-1 was satisfied.
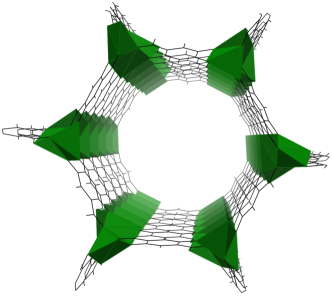
We start from the experimental rhombohedral structure of MOF-74-Zn with 54 atoms in its primitive cell and space group .Rosi et al. (2005) The rhombohedral axes are Å and , but the more convenient description through hexagonal axes is Å, Å, and and . For a graphical representation of the MOF, see Fig. 1. Six H2, CO2, CH4, or H2O molecules are then adsorbed at the uncoordinated zinc metal sites (six per primitive unit cell) in the MOF nano pores, as suggested by previous X-ray and Neutron diffraction experiments.Liu et al. (2008); Dietzel et al. (2008a); Wu et al. (2009); Dietzel et al. (2006)
II.2 Sample preparation
MOF-74-Zn: A mixture of zinc nitrate hexahydrate (0.24g, 0.8mmol), 2,5-dihydroxyterephthalic (0.08 g, 0.4 mmol), 9 ml of DMF and 1 ml of H2O were transferred into a 20 ml vessel. The vessel was then sealed and heated to for 3 days. After filtering and washing with 20 ml of DMF, the product was collected. Successively the product was exchanged with methanol every 12 hours during daytime for one week to extract the DMF solvent trapped within the frameworks. However, several previous studiesMcKinlay et al. (2008); Dzubak et al. (2012) found that the activation of the MOF-74-Zn compound was not as easy as other MOF-74 compounds (Mg, Ni, Co).
II.3 Nano-indentation measurements
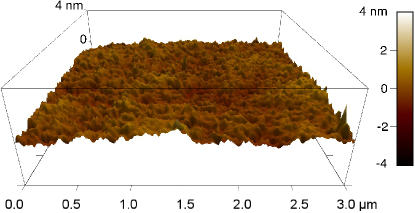
The MOF mono-crystal was larger than 20 m in dimension and was fixed by a 2m epoxy thin film onto the glass slide. Surface roughness is critical in instrumented indentation testing. Atomic force microscope (AFM) measurements on single crystals of MOF-74-Zn showed a surface roughness of less than 2 nm, which is sufficient for nano-indentation tests (see Fig. 2).
An Agilent G200 Nano Indenter was used for the nano-indentation measurements. The indenter can reach a maximum indentation depth of 500 m (resolution: 0.2 nm) and a maximum load of 500 mN (resolution: 50 nN). A Berkovich indenter tip, made of single crystal diamond, was used in this investigation. A maximum load of 20 mN was applied on the indenter tip with a constant loading rate of 4 mN s-1. Nano-indentation tests were first conducted under ambient condition at 30% relative humidity environment at room temperature (). After that, the nano-indenter chamber was sealed and dry air was purged in the chamber continuously. When the measured relative humidity dropped below 1%, the sample was in-situ annealed to for 1 h to be fully dehydrated and successively cooled back to room temperature (). Nano-indentation tests were conducted again to measure the elastic properties of the dehydrated sample. More details about the theory behind nano-indentation experiments are given in the Supplementary Information.
II.4 IR measurements
The IR spectra were taken from the sample (2 mg) pressed on a KBr pellet at room temperature. The pellet was placed on a high-pressure cell purchased from Specac at the focal point of the sample compartment of the IR spectrometer (Nicolet 6700, Thermo Scientific), equipped with a liquid N2-cooled MCT-B detector. The sample was heated at in a vacuum for 3 hours to fully remove the solvent molecules. After cooling the sample back to room temperature, the spectra of the activated MOF-74-Zn were recorded under vacuum in transmission between 4000 and 400 cm-1 (4 cm-1 spectra resolution). 760 Torr of CO2 was introduced into the pressure cell to load CO2 molecules into the MOF sample, occupying all six metal sites of the primitive unit cell.Yazaydin et al. (2009) The high IR absorption of gas-phase CO2 leads to saturation of the signal, therefore the cell was evacuated and the spectra were recorded immediately after evacuation (acquisition time = 16 sec). The adsorbed CO2 can be easily removed in vacuum by heating the sample slightly to . The sample was cooled back to room temperature () for hydration. 8 Torr (relative humidity is 36%) H2O vapor was introduced to the cell to hydrate the MOF-74-Zn sample and the spectrum was recorded after 10 min equilibration. The H2O loading is approximately 2 H2O molecules per Zn sites under this pressure.Glover et al. (2011) A blank KBr pellet was used as reference and for subtraction of gas-phase H2O spectra.
III Results
III.1 Structural response
| MOF | ||||
|---|---|---|---|---|
| empty | vdW-DF | 26.142 | 6.875 | 4068.779 |
| Exp.Rosi et al. (2005) | 25.932 | 6.836 | 3981.114 | |
| +H2 | vdW-DF | 26.108 | 6.816 | 4023.532 |
| Exp.Liu et al. (2008) | 25.887 | 6.912 | 4011.417 | |
| +CO2 | vdW-DF | 26.159 | 6.570 | 3894.077 |
| +CH4 | vdW-DF | 26.177 | 6.472 | 3840.687 |
| +H2O | vdW-DF | 26.769 | 5.841 | 3624.784 |
We begin by considering the structural evolution of MOF-74-Zn when the guest molecules, i.e. H2, CO2, CH4, and H2O, are adsorbed in the structure. Table 1 compares the lattice parameters of these models with previous experimental data. In general, from Table 1 we see that the vdW-DF functional tends to overestimate both lattice parameters, i.e. and , affecting the volume of the MOF, as well as the size of the nano-pores. It is well established that vdW-DF gives slightly too large lattice parameters and distances,Thonhauser et al. (2006) however it does not alter the energy landscape that is most important for our analysis. When molecules are adsorbed into the MOF structure, they produce a change of lattice parameters and volume; the extent of this change is solely related to the physical and chemical properties of each adsorbate. For example, the large dipole moment of H2O is responsible for its strong interaction with the structure (see below), which explains the significant perturbations of phonon modes induced by water adsorption, as shown in Figure S5 in the Supporting Information. In the case of non-polar molecules such as H2, CO2, and CH4 the MOF’s response depends only on the size of the molecule compared to the MOF cavity (13 Å), e.g. CH4 has a large effect on the final lattice constants while the effect of H2 is almost negligible. These considerations are well captured by the evolution of the cavity cross-section when several molecules are adsorbed by MOF-74-Zn.
We now move to the analysis of the adsorption energies, , which are a byproduct of the well relax geometries essential for the calculation of the elastic and thermal properties presented in the next sections. The adsorption energy is defined as
| (1) |
where and are the energies at 0 K of the clean MOF, the molecule M in gas phase, and the adduct MOF+M, i.e. the product of the adsorption. Two interesting deformation contributions and —which are clearly connected to the transduction of chemical energy at the adsorption stage into mechanical energy—are explained in Eq. (2) and Eq. (3):
| (2) | |||||
| (3) |
Here, and are the energies of the molecule and the MOF in their adsorption geometries. and express the cost in energy that both adsorbate and MOF have to pay during the adsorption process. and are obtained by partitioning the adsorption energy, and thus they are naturally enclosed in the definition of .
Table 2 reports , the corresponding corrected by the zero-point energy , the enthalpy at 298 K, , and for H2, CO2, CH4, and H2O in MOF-74-Zn.444The correction to the adsorption energy as well as the were computed on the basis of the harmonic approximation as detailed in Ref. Sholl and Steckel, 2009. Not surprising, from Table 2 we see that water binds much stronger than the other molecules and its presence in the MOF nano-pores thus affects the capability to effectively adsorb H2, CO2, or CH4. We have clarified this important aspect for the iso-structural MOF-74-Mg in previous work.Canepa et al. (2013a) The distinct response of MOF-74-Zn to water molecules was recently also demonstrated by Robinson et al.,Robinson et al. (2012) indicating that MOFs might be ideal to detect humidity even in small traces.
The effect of the ZPE and thermal corrections on the energy range is only within a few kJ mol-1 and does not alter the final adsorption picture. More interesting is the effect of the deformation contributions to the adsorption energies. and in Table 2 show that both molecules and structures undergo a geometry reconstruction during the adsorption. The negative sign of is simply due to the attractive intermolecular interactions; their magnitudes only depend on the molecular size and the extent of pore reconstruction, the latter being connected to the nature of the metal ions. In general, we find that the MOF structure is subjected to a larger structural reconstruction after molecular adsorption—a clear indication that the MOF structure and its elastic properties are altered.
From this preliminary analysis of the adsorption and deformation energies we gain a qualitative picture of how the molecule-specific adsorption process induces mechanical changes at the structural level of the guest molecules and the MOF (see Table 1 and 2). This has important implications for the elastic, thermal, and electronic properties of the MOF, which, in turn, are crucial for the development of new generation sensors.
| Model | |||||
|---|---|---|---|---|---|
| +H2 | –20.9 | –20.3 | –19.8 | 0.9 | –1.5 |
| +CO2 | –52.4 | –50.4 | –49.8 | 0.7 | –3.1 |
| +CH4 | –40.1 | –38.9 | –39.3 | 0.6 | –3.3 |
| +H2O | –73.9 | –72.4 | –72.2 | 3.4 | –3.8 |
III.2 Elastic response
| Prop. | MOF | +H2 | +CO2 | +CH4 | +H2O |
|---|---|---|---|---|---|
| 14.84 | 17.00 | 19.29 | 24.16 | 31.52 | |
| 15.34 | 17.83 | 19.86 | 25.96 | 33.25 | |
| 13.03 | 12.25 | 12.68 | 12.75 | 13.47 | |
| 5.60 | 5.31 | 4.41 | 6.07 | 10.09 | |
| 8.64 | 13.38 | 14.04 | 19.84 | 9.85 | |
| 4.89 | 2.87 | 3.66 | 1.74 | 5.17 | |
| 9.91 | 13.54 | 10.05 | 13.34 | 17.57 | |
| 4.66 | 6.48 | 7.20 | 6.90 | 12.04 | |
| 2.12 | 2.09 | 1.40 | 1.93 | 1.46 | |
| 3.44 | 8.60 | 1.49 | 2.19 | 26.45 | |
| 6.44 | 9.80 | 9.87 | 8.44 | 33.28 | |
| 3.72 | 8.10 | 1.58 | 2.58 | 28.99 |
We now move to the analysis of the elastic properties of loaded MOF-74-Zn. Table 3 reports the elastic constants and the bulk, shear, and Young’s moduli of MOF-74-Zn (see the Supplementary Information for more details). From this table we see that the elastic constants and derived moduli are generally small, which is to be expected due to the soft nature of MOFs.Tan and Cheetham (2011); Tan et al. (2012b); Ortiz et al. (2012) We find that the rhombohedral structure of MOF-74-Zn is stable according to the BornBorn and Huang (1988) stability criteria:
| (4) |
The collective physical quantities (such as bulk, shear, and Young’s moduli) indicate the flexibility of the material in agreement with previous literature on MOFs.Tan and Cheetham (2011); Tan et al. (2012b); Ortiz et al. (2012) For almost all adsorbates, the molecular adsorption in the MOF pores induces a substantial increase of the elastic constants—i.e. the MOF looses some of its flexibility—suggesting an underlying correlation between the MOF elastic constants and its density (see below). The bulk modulus also increases after molecular adsorption, demonstrating that the material is less prone to compression. Remarkable are the changes in elastic constants due to water adsorption, almost 50% (see Table 3)—again demonstrating that the MOFs’ initial flexibility is strongly altered by the nature of the adsorbing molecules.
An important quantity that tells us about the ductility of the MOF is the ratio between the bulk and the shear moduli . Note that the bulk modulus is generally connected to the resistance to fracture of the material, while the shear modulus is related to the resistance to plastic deformation; the threshold between brittle and ductile is a value of approximatively 1.75. The values of in Table 3 demonstrate that the empty MOF-74 is a rather brittle material, but its brittleness decreases after molecular adsorption. A measure of the stiffness of the MOF-scaffold is given by the Young’s modulus. The small values computed for the Young’s moduli are the clear indication of the flexible nature of MOF-74-Zn. In order to confirm our theoretically predicted trend, in-situ nano-indentation measurements are performed on MOF-74-Zn sample in the hydrated state (under ambient condition and relative humidity 30%) and dehydrated state, which was achieved by in-situ heating up to under dry air flow. Figure 3a shows the load-displacement data collected on the MOF-74-Zn crystal surface with a penetration depth over 1000 nm. Note that the hydrated MOF-74-Zn sample is measured under 30% humidity at ambient condition.
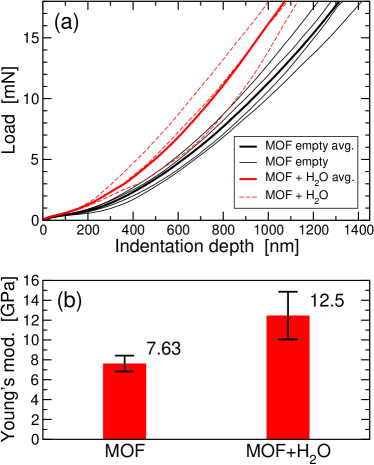
From these measurements the elastic modulus was extracted using Oliver Pharr’s method as detailed in Sec. II.3 and in the Supplementary Information. The measured averages of Young’s modulus for the empty MOF-74-Zn sample in dry air and the sample in a 30% relative-humidity environment are 7.63 GPa and 12.46 GPa respectively. Although the Young’s modulus of the epoxy support (5.00 GPa) can—in theory—interfere with the elastic measurements, the MOF’s thickness-to-indentation depth ratio is more than 30, guaranteeing that the overall effect of the epoxy substrate is negligible. In Figure 3b, the experimental nano-indentation results (especially for dehydrated condition) are in good agreement with calculated Young’s modulus components, as shown in Table 3. Again, the Young’s moduli, similar and , are subject to change during molecular adsorption, causing an overall stiffening of the MOF itself. Experimental and calculated Young’s moduli of MOF-74-Zn range between 6.0 – 12.5 GPa, characteristic of wood along the grain (11 GPa) or human cortical bone (14 GPa). Although our DFT calculations overestimate the Young’s modulus for the case of H2O in MOF-74-Zn, the agreement between experiment and theory is still remarkable, considering the complexity of the system and the measurement. The difference between the experimental data and theoretical values of the hydrated MOF can—at least in part—be attributed to the difficulty of fully loading the sample and thus saturating all metal sites with water molecules.Dietzel et al. (2008b); McKinlay et al. (2008); Dzubak et al. (2012)
Note that the measured results under ambient onditions (relative humidity 30%) and dry air flow follow the trend of the theoretical prediction, i.e. the Young’s modulus increases upon water adsorption. Unfortunately, while the elastic measurements in presence of H2, CO2, and CH4 have been planned, this task is not trivial, requiring a complex setup that includes building an in-situ chamber around the nano-indentation head. Thus, at the moment we cannot report measurements for those molecules.
| Prop. | MOF | +H2 | +CO2 | +CH4 | +H2O |
|---|---|---|---|---|---|
| 1.25 | 1.21 | 1.58 | 1.77 | 1.34 | |
| 0.45 | 0.25 | 0.33 | 0.40 | 0.27 | |
| 0.32 | 0.93 | 0.33 | 0.31 | 0.27 | |
| 0.11 | 0.05 | 0.12 | 0.01 | 0.14 | |
| 0.30 | 0.41 | 0.26 | 0.24 | 0.23 | |
| 3.11 | 4.28 | 3.59 | 4.28 | 5.01 | |
| 1.59 | 2.07 | 1.93 | 2.31 | 2.99 | |
| 1.78 | 2.33 | 2.16 | 2.58 | 3.31 | |
| 170 | 215 | 188 | 226 | 296 |
The stiffness of the MOF is pertinent in the uniaxial deformation of the material defined by Poisson’s ratio (Eq. (4) in the Supplementary Information), which we report in Table 4. When the MOF structure is deformed axially, the lateral deformation is given by the Poisson’s ratio . Usually, the lower bound of is , meaning that the material does not undergo lateral deformation and maintains its original volume; while the upper bound of 0.5 corresponds to situations where the shape of the material does not change after deformation. Note that Poisson’s ratio is related to the type of bonding interactions holding the material in place; for materials that show primarily non-directional van der Waals and ionic forces, the Poisson’s ratio is on average 0.25, in agreement with the values in Table 4.
Also relevant is the increase in the density , occurring when molecules bind to the MOF’s structure, indicating that the volume of the nano-pores is decreasing (see Table 1 and 4). Hence, the denser the material, the larger the bulk modulus, in agreement with the trend of the bulk modulus observed when the molecule is adsorbed in the MOF nano-pores.
From the above quantities we can also calculate the sound velocities (see Table 4). Overall, the sound velocities for MOF-74-Zn fall in the range of other MOFs.Allendorf et al. (2008); Mattesini et al. (2006); Tan et al. (2012b); Ortiz et al. (2012); Tan and Cheetham (2011) As expected, the longitudinal sound velocities are smaller than the transversal ones , and both increase during the molecular adsorption—again related to the increase in density after molecular adsorption (see Eq. (5) and (6) in the Supplementary Information).
Finally, we analyze the Debye temperature , which is related to the rigidity of the MOF and represents the highest temperature that can be achieved due to a single normal vibration. Note that is closely connected to the thermal analysis in Sec. III.3. In fact, by knowing the Debye temperature one can recompute the heat capacity at constant volume according to the Debye model, which is in good agreement with those presented in Fig. 4, based on Einstein’s model. The calculated for these models grows whenever a molecule is adsorbed in the MOF cages, reflecting the molecular nature of the adsorbate. From a qualitative point of view, when water molecules are introduced in the MOF structure, the high-energy frequencies—i.e. the water asymmetric stretch mode—triggers the increase of the Debye temperature. The estimated falls at lower values for more weakly bound molecules such as H2, CO2, and CH4. Overall, the rather small Debye temperatures indicate that MOF-74-Zn presents a relatively flexible structure, even when molecules are adsorbed in it.
III.3 Thermal response
We begin by comparing the computed heat capacities at constant volume from theoretical and experimental IR data, (Eq. (1) in the Supplementary Information) for MOF-74-Zn—empty and with adsorbates H2, CO2, CH4, and H2O.
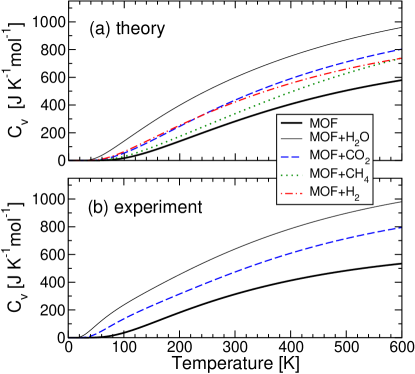
Figure 4a shows the change in heat capacity computed from the ab initio phonon frequencies when the MOF comes in contact with different gas molecules. Similarly, from our experimentally observed IR frequencies of the MOF (see Figure S5 and S6 in the Supplementary information) we can estimate the same heat capacity at constant volume, as depicted in Fig. 4b. Note that the experimental IR data is only accessible in a limited spectral window (5003800 cm-1), affecting the shape of Cv in its tail at low temperatures, i.e. 0 – 100 K, as well as the magnitude at high temperatures, i.e. 600 K. For a better comparison between theory and experiment, we thus limit the ab initio frequencies included in to the same spectral window, recovering excellent agreement between theory and experiment. In general, the heat capacity increases when molecules adsorb in the MOF nano-pores. As with all the other responses already discussed, the changes in the heat capacity upon loading are substantial and specific for each adsorbate. A clear relationship can be drawn between adsorption energy and the trend assumed by the heat capacities—for increasing we observe an increase of .
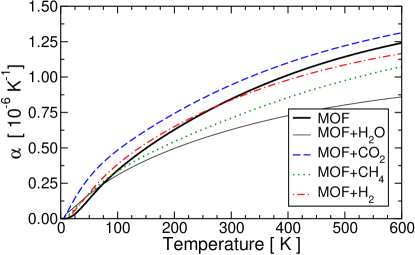
is the main ingredient to calculate the thermal expansion from Eq. (2) in the Supplementary Information, and Fig. 5 plots the variation of this quantity when molecules are adsorbed in the MOF structure. From this figure we can see that is greatly affected by the presence of molecules in the MOF. The extent of the thermal expansion is changed by the nature of the guest molecule, which is related to the nature of the interaction that occurs at the adsorption stage.
Our finding suggests that the thermal expansion of the loaded MOF-74 slowly increases with temperature compared to the empty MOF. We also find qualitative agreement with a recent study from Queen et al.,Queen et al. (2011) who demonstrated that the adsorption of CO2 in MOF-74-Mg only induces small changes in the thermal expansion (see Fig. 5). This supports that both MOF and MOF+CO2 have similar thermal expansions. Electrostatically driven adsorptions, such as for water, introduce large changes of and , while the adsorption of H2, CO2, and CH4, emerging from weak van der Waals forces, have smaller effects, though still measurable. Note that the magnitude of also depends on the bulk modulus (see Eq. (2) in Supplementary Information), which is ultimately connected to the MOF volume. This suggests a strong correlation between and the change in volume, modulated by the magnitude of the adsorption energies (i.e. the electronic characteristics of the guest molecule). The presence of the adsorbed molecules in the MOF cavities helps in reducing the pore volume and thus increasing the density of the material, resulting in a larger and .
III.4 Electronic response
We finally come to the analysis of the electronic response of the MOF due to molecular adsorption. Our discussion starts by considering the alterations of the density of states (DOS) of the MOF-74-Zn after the adsorption of the guest molecules H2, CO2, CH4, and H2O. Figure 6 shows the MOF and adsorbate contributions to the total DOS.
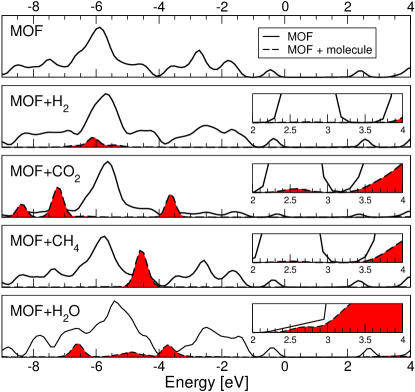
As anticipated, some molecular states (of the adsorbates) are injected into the valence and conduction band of the MOF after the guest molecules are adsorbed (see Fig. 6). As such, the initial DOS of the MOF is subjected to different changes depending on the magnitude of the molecular interaction with the MOF scaffold; for example, the adsorption of CO2 and H2O introduces changes to the DOS of the MOF between –8 eV and –4 eV, while this is not the case of CH4 and H2, which are only weakly bound to the metal sites (see Table 2). As already suggested by the other properties investigated above, CO2 and H2O introduce larger perturbations on the MOF electronic structure.
In general, both edges of the valence and conduction bands are dominated by the MOF states, while the molecular states lie at slightly lower and higher energies, respectively. The small alteration of the electronic structure introduced by H2, CO2, and CH4 confirms that weak van der Waals type forces hold the adsorbate to the MOF-74-Zn structure. As shown in Fig. 6, the molecular orbitals of H2O hybridize with the conduction bands at the edge of the band gap, slightly affecting its magnitude. The changes of the DOS in the conduction band for H2O (and to some extent also for CO2) suggest that also the optical properties of the MOF are strongly altered upon adsorption.
The maximum of the valence band is at the same position for the empty MOF and for the MOF loaded with the adsorbates considered; the same is true for the bottom of the conduction band. In the Brillouin zone of the rhombohedral unit cell,555See http://www.cryst.ehu.es/cgi-bin/cryst/programs/nph-kv-list?gnum=148&fig=f3qra. the maximum of the valence band is located at the special k-point and the bottom of the conduction band is along the direction and we will refer to it as . A careful analysis of the Brillouin zone of the MOF indicates that the vector is parallel to the MOF channel, i.e. the c axis of the corresponding hexagonal lattice.666Note that the overall symmetry (also the Brillouin zone) of the MOF remains the same even after the six molecules are adsorbed.
Although DFT is not the adequate level of theory for the quantitative prediction of electronic band gaps, our calculations suggest that MOF-74-Zn has an indirect band gap of 2.00 eV, clearly underestimating the experimental value of 2.83 eV by almost 30%.Botas et al. (2011) We did perform GW calculations to obtain a better guess for the band gap, but those results overestimated the experimental band gap, suggesting that exciton effects play an important role in the optical properties of MOFs—as is not uncommon for organic materials. Solving the Bethe–Salpeter equation is beyond the scope of this study and we thus use our DFT results to express simple trends. The perturbation of the electronic structure induces minor changes in the band gap magnitude after the molecular adsorption (see Fig. 6). Our calculated indirect band gaps follow the trend CH4 (1.99 eV) CO2 (2.10 eV) H2O (2.30 eV), suggesting that the stronger the adsorption, the larger the perturbation of the MOF electronic structure with the effect of slightly opening up the band gap. One inexplicable exception to this trend is H2, for which we find a slightly larger band gap of 2.22 eV, nonetheless preserving most of the electronic structure of the MOF. Finally, from the MOF+CH4 DOS in Fig. 6 we see that the electronic structure of the MOF itself is almost unaltered upon adsorption of CH4.
While all the above discussed responses of the MOF due to small molecule adsorption are intriguing and useful for transducers and sensors, the final property we discuss is probably the most relevant one. In the remaining part we will describe how small molecule adsorption influences the electronic conductivity, with important practical and direct implications for sensing applications, as changes in conductivity are easily measurable. To this end, from the calculated band structures above, we compute the effective masses of electrons and holes , which are inversely proportional to the corresponding conductivities. The effective masses are defined as the following tensors:
| (5) |
where is the curvature in the directions of the lowest and highest-lying conduction and valence bands, respectively. These curvatures, as function of the k-direction, were calculated on a fine grid with a finite-different approach (5 point sampling) employing the code by Fonari et al.,Fonari with a well converged grid-spacing of 0.025 Bohr-1. We have further diagonalized the effective mass tensors, in order to get their principal-axes components. While all calculations are performed in the rhombohedral MOF-74 unit cell, it is more intuitive to describe the effective masses with respect to the corresponding hexagonal representation, where the channel of the MOF is clearly visible (see Fig. 1). In this framework, we can identify an effective mass parallel to the MOF-74-Zn channel direction, as well as two other mutually orthogonal components , which are perpendicular to the channel direction. Results for the effective masses in this framework are reported in Table 5.
| MOF | 214.08 | 172.30 | 2.34 |
|---|---|---|---|
| +H2 | 170.74 | 170.10 | 4.61 |
| +CO2 | 56.00 | 48.61 | 2.69 |
| +CH4 | 250.35 | 198.53 | 2.16 |
| +H2O | 7.00 | 6.94 | 5.58 |
| MOF | 2.93 | 2.93 | 5.42 |
| +H2 | 3.08 | 3.08 | 9.18 |
| +CO2 | 3.12 | 3.10 | 5.97 |
| +CH4 | 2.63 | 2.63 | 5.27 |
| +H2O | 2.29 | 2.29 | 4.56 |
The components of both and in Table 5 confirm the presence of a rather large anisotropy, suggesting the existence of more than one pathway for charge transport in the MOF lattice, a property that is observed in many organic-based semiconductors.Yi et al. (2012) It is interesting to see that for the electron effective masses, the lowest value is consistently parallel to the channel direction, while the two perpendicular components are very similar. On the other hand, for the hole effective masses, the lowest value is consistently perpendicular to the channel direction, and again the two perpendicular directions are either identical or at least very similar.
and also vary significantly depending on the adsorbed molecule, quantitatively supporting the picture given by the DOS of Fig. 6. and also reveal that H2 and CH4 adsorption has a small effect on the electronic properties of the solid, while the adsorption of H2O and CO2 improves overall the electronic transport in MOF-74-Zn. Effective hole masses at are generally smaller than the at the bottom of the conduction band at . A practical guidanceFleming (1972) for the manufacturing of organic semiconductors suggests that the upper useful limit for effective masses is 25 (with the mass of the electron at rest), suggesting that MOF-74 is of potential interest in this area.
This brings us to the question of how these important and selective changes in conductivities can be made accessible for sensing applications. Thermal excitement of electrons to the conduction band is unlikely due to the large gap as well as the small changes of the MOF electronic structure of MOF-74 upon molecular adsorption. Optical excitations will not work either due to the indirect band gap. However, as we will describe below, the MOF-74 material readily lends itself to doping with other metal ions. We are not aware of any elements that could be used for electron doping and thus making the conduction band available, while retaining the channel-like structure of MOF-74. However, a whole list of transition metal such as Cu, Ni, Mn, or Co can be used for hole doping in MOF-74-Zn, with the advantage that MOFs built with these ions are all isostructural and already exist. In particular, experimentsBotas et al. (2011) have confirmed that Cu and Co doping is possible and our preliminary calculations suggest that Cu can be doped into MOF-74-Zn at any level, until we arrive at MOF-74-Cu. The hole dopant will then create states in the gap just slightly above the valence band maximum. In turn, thermal excitement creates the desired holes at , making the adsorbate-specific hole conductivities from Table 5 easily accessible through electrical measurements in novel sensor applications.
IV Conclusions
In summary, we elucidate the connection between the molecular adsorption of four important molecules, i.e. H2, CO2, CH4, and H2O in MOF-74-Zn and its structural, elastic, thermal, and electronic responses. Our vdW-DF calculations demonstrate that the chemical energy involved in the molecular adsorption is efficiently transduced in mechanical and thermal energy, altering the MOF properties. We further demonstrate that the molecular adsorption induces remarkable and adsorbate-specific changes in the MOF scaffold structure, its electronic structure, and in its elastic and thermal properties. While MOF-74-Zn is considered a “rigid” MOF, our findings attest that such a MOF can be used for sensing a variety of important molecules with high specificity and high molecular recognition. This study shows that by knowing the structural, elastic, thermal, and electronic of the MOF, we can determine the nature of the adsorbing interaction (and the molecule), i.e. electrostatic or van der Waals, making MOF-74-Zn a promising candidate for the engineering of innovative and selective sensors.
This theoretical and spectroscopic work led by TT, PC, KT, and YC was entirely supported by the Department of Energy Grant No. DE-FG02-08ER46491. The nano-indentation measurements led by HL and YD were supported by the Department of Energy Nuclear Energy University Program (NEUP) Grant No. 09-416 and NSF ECCS-1307997.
References
- Perez et al. (2002) J. M. Perez, L. Josephson, T. O. Ĺoughlin, D. Högemann, and R. Weissleder, Nat. Biotehcnol. 20, 816 (2002).
- Saleh and Sohn (2003) O. A. Saleh and L. L. Sohn, Nano Lett. 3, 37 (2003).
- Yogeswaran and Chen (2008) U. Yogeswaran and S.-M. Chen, A Review on the Electrochemical Sensors and Biosensors Composed of Nanowires as Sensing Material Sensors, 290 (2008).
- Melde et al. (2008) B. J. Melde, B. J. Johnson, and P. T. Charles, Sensors 8, 5202 (2008).
- Tan and Cheetham (2011) J.-C. Tan and A. K. Cheetham, Chem. Soc. Rev. 40, 1059 (2011).
- Kreno et al. (2012) L. Kreno, K. Leong, O. Farha, M. Allendorf, R. Van Duyne, and J. Hupp, Chem. Rev. 112, 1105 (2012).
- Nijem et al. (2012a) N. Nijem, H. Wu, P. Canepa, A. Marti, K. Balkus Jr, T. Thonhauser, and Y. J. Chabal, J. Am. Chem. Soc. 134, 15201 (2012a).
- Canepa et al. (2013a) P. Canepa, N. Nijem, Y. J. Chabal, and T. Thonhauser, Phys. Rev. Lett. 110, 026102 (2013a).
- Lee et al. (2009) J. Y. Lee, O. Farha, J. Roberts, K. A. Scheidt, S. T. Nguyen, and J. T. Hupp, Chem. Soc. Rev. 38, 1450 (2009).
- Luz et al. (2010) I. Luz, F. X. Llabrés i Xamena, and C. A., J. Catal. 276, 134 (2010).
- Uemura et al. (2009) T. Uemura, N. Yanai, and S. Kitagawa, Chem. Soc. Rev. 38, 1228 (2009).
- Vitorino et al. (2009) M. J. Vitorino, T. Devic, M. Tromp, G. Férey, and M. Visseaux, Macromol. Chem. Phys. 210, 1923 (2009).
- Allendorf et al. (2009) M. D. Allendorf, C. A. Bauer, R. K. Bhakta, and R. Houk, Chem. Soc. Rev. 1330, 38 (2009).
- White et al. (2009) K. A. White, D. A. Chengelis, K. A. Gogick, J. Stehman, N. L. Rosi, and S. Petoud, J. Am. Chem. Soc. 131, 18069 (2009).
- Bordiga et al. (2004) S. Bordiga, C. Lamberti, G. Ricchiardi, L. Regli, F. Bonino, A. Damin, K.-P. Lillerud, M. Bjorgen, and A. Zecchina, Chem. Commun. , 2300 (2004).
- Kurmoo (2009) M. Kurmoo, Chem. Soc. Rev. 38, 1353 (2009).
- Horcajada et al. (2010) P. Horcajada, T. Chalati, C. Serre, B. Gillet, C. Sebrie, T. Baati, J. Eubank, D. Heurtaux, P. Clayette, C. Kreuz, J.-S. Chang, Y. Hwang, V. Marsaud, P.-N. Bories, L. Cynober, S. Gil, G. Férey, P. Couvreur, and G. R., Nat. Mater. 9, 172 (2010).
- Stroppa et al. (2011) A. Stroppa, P. Jain, P. Barone, M. Marsman, J. M. Perez-Mato, A. K. Cheetham, H. W. Kroto, and S. Picozzi, Angew. Chem., Int. Ed. 50, 5847 (2011).
- Stroppa et al. (2013) A. Stroppa, P. Barone, P. Jain, J. M. Perez-Mato, and S. Picozzi, Adv. Mater. 25, 2284 (2013).
- Di Sante et al. (2013) D. Di Sante, A. Stroppa, P. Jain, and S. Picozzi, J. Am. Chem. Soc. 135, 18126 (2013).
- Serre et al. (2007) C. Serre, C. Mellot-Draznieks, S. Surblé, N. Audebrand, Y. Filinchuck, and G. Férey, Science 315, 1828 (2007).
- Soo and Goddard (2007) H.-S. Soo and W. Goddard, J. Phys. Chem. C 111, 15185 (2007).
- Allendorf et al. (2008) M. D. Allendorf, R. J. T. Houk, L. Andruskiewicz, A. A. Talin, J. Pikarsky, A. Choundhury, K. A. Gall, and P. J. Hensketh, J. Am. Chem. Soc. 130, 14404 (2008).
- Qiu and Zhu (2009) S. L. Qiu and G. S. Zhu, Coord. Chem. Rev. 253, 2891 (2009).
- Xie et al. (2010) Z. G. Xie, L. Q. Ma, K. E. deKrafft, A. Jin, and W. B. Lin, J. Am. Chem. Soc. 922, 132 (2010).
- Walker et al. (2010) A. M. Walker, B. Civalleri, B. Slater, C. Mellot-Draznieks, F. Corá, C. M. Zicovich-Wilson, G. Román-Pérez, J. M. Soler, and J. D. G. Gale, Angew. Chem., Int. Ed. 49, 7501 (2010).
- Ortiz et al. (2012) A. U. Ortiz, A. Boutin, A. H. Fuchs, and F.-X. Coudert, Phys. Rev. Lett. 109, 195502 (2012).
- Dion et al. (2004) M. Dion, H. Rydberg, E. Schröder, D. C. Langreth, and B. Lundqvist, Phys. Rev. Lett. 92, 246401 (2004).
- Thonhauser et al. (2007) T. Thonhauser, V. R. Cooper, S. Li., A. Puzder, P. Hyldgaard, and D. C. Langreth, Phys. Rev. B 76, 125112 (2007).
- Langreth et al. (2009) D. Langreth, B. I. Lundqvist, S. D. Chakarova-Käck, V. R. Cooper, M. Dion, P. Hyldgaard, A. Kelkkanen, J. Kleis, L. Kong, S. Li, P. G. Moses, E. Murray, A. Puzder, H. Rydberg, E. Schröder, and T. Thonhauser, J. Phys.: Condens. Matter 21, 084203 (2009).
- Kresse and Furthmüller (1996) G. Kresse and J. Furthmüller, Phys. Rev. B 54, 11169 (1996).
- Kresse and Joubert (1999a) G. Kresse and D. Joubert, Phys. Rev. B 59, 1758 (1999a).
- Yao et al. (2012) Y. Yao, N. Nijem, J. Li, Y. J. Chabal, D. C. Langreth, and T. Thonhauser, Phys. Rev. B 85, 064302 (2012).
- Canepa et al. (2013b) P. Canepa, C. A. Arter, E. M. Conwill, D. H. Johnson, B. A. Shoemaker, K. Z. Soliman, and T. Thonhauser, J. Mater. Chem. A 1, 13597 (2013b).
- Lopez et al. (2013) M. G. Lopez, P. Canepa, and T. Thonhauser, J. Chem. Phys. 138, 154704 (2013).
- Nijem et al. (2012b) N. Nijem, P. Canepa, L. Kong, H. Wu, J. Li, T. Thonhauser, and Y. J. Chabal, J. Phys. Condens. Matter 24, 424203 (2012b).
- Nijem et al. (2013) N. Nijem, P. Canepa, U. Kaipa, K. Tan, K. Roodenko, S. Tekarli, J. Halbert, I. W. H. Oswald, R. K. Arvapally, C. Yang, T. Thonhauser, M. A. Omary, and Y. J. Chabal, J. Am. Chem. Soc. 135, 12615 (2013).
- Tan et al. (2012a) K. Tan, N. Nijem, P. Canepa, Q. Gong, J. Li, T. Thonhauser, and Y. J. Chabal, Chem. Mater. 24, 3153 (2012a).
- Tan et al. (2013) K. Tan, P. Canepa, Q. Gong, J. Liu, D. H. Johnson, A. Dyevoich, P. K. Thallapally, T. Thonhauser, J. Li, and Y. J. Chabal, Chem. Mater. 25, 4653 (2013).
- Zuluaga et al. (2014) S. Zuluaga, P. Canepa, K. Tan, Y. J. Chabal, and T. Thonhauser, J. Phys. Condens. Matter 26, 133002 (2014).
- Blöchl (1994) P. E. Blöchl, Phys. Rev. B 50, 17953 (1994).
- Kresse and Joubert (1999b) G. Kresse and D. Joubert, Phys. Rev. B 59, 1758 (1999b).
- Sabatini et al. (2012) R. Sabatini, E. Küçükbenli, B. Kolb, T. Thonhauser, and S. de Gironcoli, J. Phys.: Condens. Matter 24, 424209 (2012).
- Rosi et al. (2005) N. L. Rosi, J. Kim, C. B. Eddaoudi, M. O‘Keeffe, and O. M. Yaghi, J. Am. Chem. Soc. 1504, 127 (2005).
- Liu et al. (2008) Y. Liu, C. Kabbour, C. Brown, D. A. Neumann, and C. C. Ahn, Langmuir 24, 4772 (2008).
- Dietzel et al. (2008a) P. D. C. Dietzel, R. E. Johnsen, H. Fjellvåg, S. Bordiga, E. Groppo, S. Chavan, and R. Blom, Chem. Commun. 46, 5125 (2008a).
- Wu et al. (2009) H. Wu, W. Zhou, and T. Yildirim, J. Am. Chem. Soc. 131, 4995 (2009).
- Dietzel et al. (2006) P. D. C. Dietzel, B. Panella, M. Hirsher, R. Blom, and H. Fjellvåg, Chem. Commun. 9, 959 (2006).
- McKinlay et al. (2008) A. C. McKinlay, B. Xiao, D. S. Wragg, P. S. Wheatley, I. L. Megson, and R. E. Morris, J. Am. Chem. Soc. 130, 10440 (2008).
- Dzubak et al. (2012) A. L. Dzubak, L.-C. Lin, K. Jihan, J. A. Swisher, R. Poloni, S. N. Maximoff, B. Smit, and L. Gagliardi, Nat. Chem. 4, 810 (2012).
- Yazaydin et al. (2009) A. O. Yazaydin, R. Q. Snurr, T.-H. Park, K. Koh, J. Liu, M. D. Levan, A. Benin, P. Jakubczak, M. Lanuza, D. B. Galloway, J. J. Low, and R. R. Willis, J. Am. Chem. Soc. 131, 18198 (2009).
- Glover et al. (2011) T. G. Glover, G. W. Peterson, B. J. Shindler, D. K. Britt, and O. M. Yaghi, Chem. Eng. Sci. 66, 163 (2011).
- Thonhauser et al. (2006) T. Thonhauser, A. Puzder, and D. C. Langreth, J. Chem. Phys. 124, 164106 (2006).
- Note (4) The correction to the adsorption energy as well as the were computed on the basis of the harmonic approximation as detailed in Ref. \rev@citealpnumSholl2009.
- Robinson et al. (2012) A. L. Robinson, V. Stavila, T. R. Zeitler, M. I. White, S. M. Thornberg, J. A. Greathouse, and M. Allendorf, Anal. Chem. 86, 7043 (2012).
- Tan et al. (2012b) J.-C. Tan, B. Civalleri, C.-C. Lin, L. Valenzano, R. Galvelis, P.-F. Chen, T. D. Bennet, C. Mellot-Draznieks, C. M. Zicovich-Wilson, and A. K. Cheetham, Phys. Rev. Lett. 108, 095502 (2012b).
- Born and Huang (1988) M. Born and K. Huang, Dynamical Theory of Crystal Lattices (Oxford University Press, New York, 1988).
- Dietzel et al. (2008b) P. D. C. Dietzel, R. E. Johnsen, R. Blom, and H. Fjellvåg, Chem. Eur. J. 14, 2389 (2008b).
- Mattesini et al. (2006) M. Mattesini, J. M. Soler, and F. Ynduráin, Phys. Rev. B 73, 09411 (2006).
- Queen et al. (2011) E. L. Queen, C. M. Brown, D. K. Britt, P. Zajdel, M. R. Hudson, and O. M. Yaghi, J. Phys. Chem. C 115, 24915 (2011).
- Note (5) See http://www.cryst.ehu.es/cgi-bin/cryst/programs/nph-kv-list?gnum=148&fig=f3qra.
- Note (6) Note that the overall symmetry (also the Brillouin zone) of the MOF remains the same even after the six molecules are adsorbed.
- Botas et al. (2011) J. A. Botas, G. Calleja, M. Sánchez-Sánchez, and M. G. Orcajo, Int. J. Hydrogen Energ. 26, 10834 (2011).
- (64) A. Fonari, “Effective mass calculator: https://github.com/alexandr-fonari/emc,” .
- Yi et al. (2012) Y. Yi, L. Zhu, and B. J.-L., J. Phys. Chem. C 116, 5215 (2012).
- Fleming (1972) R. J. Fleming, J. Chem. Phys. 56, 4911 (1972).
- Sholl and Steckel (2009) D. S. Sholl and J. A. Steckel, Density functional theory: a practical introduction (John Wiley & Sons, Inc., Hoboken, New Jersey, 2009).