FIXED TARGET EXPERIMENTS AT THE FERMILAB TEVATRON
Abstract
This paper presents a review of the study of Exclusive Central Production at a Center of Mass energy of GeV at the Fermilab Fixed Target program. In all reactions reviewed in this paper, protons with an energy of 800 GeV were extracted from the Tevatron accelerator at Fermilab and directed to a Liquid Hydrogen target. The states reviewed include , , , and . Partial Wave Analysis results will be presented on the light states but only the cross section will be reviewed in the diffractive production of .
keywords:
Glueballs; Exotics; Double Pomeron Exchange.PACS numbers: 12.39.Mk, 14.40.Rt, 11.80.Et, 14.40.Be, 14.40.Lb, 13.85.Ni
1 Introduction
The Double Pomeron Exchange (DPE) process was first observed at the CERN-ISR.[1] Since then it is generally accepted that Central Production in hadron-hadron reactions at high center of mass and low momentum transfers proceeds through Double Pomeron Exchange. It is also generally accepted that with its vacuum quantum numbers, the Pomeron is largely gluonic in nature. Then proton-proton reactions, where the central object under study is well separated in rapidity from the protons, could be a good place to search for gluonium states. In this article we review reactions of the type:
| (1) |
where the subscripts and refer to the slowest and fastest protons in the Laboratory reference frame.
The Fixed Target (FT) program at the Fermilab Tevatron has produced a wealth of results,[2] but only experiment E690 used an 800 GeV/c proton beam on a Liquid Hydrogen target and had a beam spectrometer capable of a precise measurement of the forward proton, making this the only experiment in the Fermilab FT program that studied reactions of the type (1) above. In this article we review the main results of experiment E690 in the production of , , , , and the diffractive production of .
2 The E690 experiment
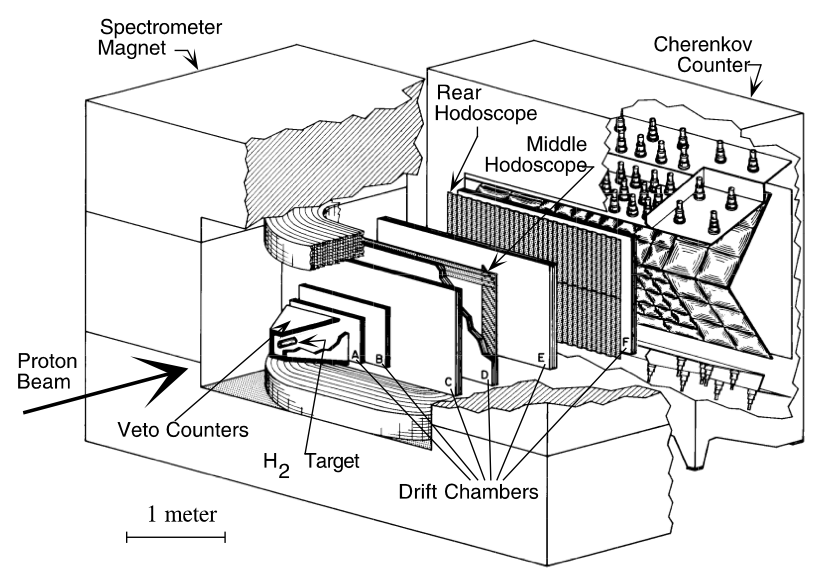
The E690 experiment consisted of an 800 GeV/c proton beam hitting a liquid hydrogen (LH2) target. A high rate, open geometry multiparticle spectrometer, shown in Fig. 1, followed the hydrogen target. A beam spectrometer was used to accurately measure the 800 GeV/c beam and the scattered proton. Details of the spectrometer can be found in Ref. 3.
All final states reviewed in this article were subject to the following event selection:
-
•
a primary interaction vertex within the fiducial region of the LH2 target,
-
•
a number of charged tracks consistent with the desired topology,
-
•
a number of secondary vertexes also consistent with the desired topology,
-
•
a fast proton, , measured in the forward spectrometer.
For Central Production and low the slow proton often stays within the LH2 target. Therefore E690 required that would not be reconstructed in the main spectrometer and the missing mass squared of the event () was used to identify this proton by requiring that would agree with the mass squared of the proton. Other selection criteria pertinent to particular final states are discussed in each section below.
3 Central production of the system
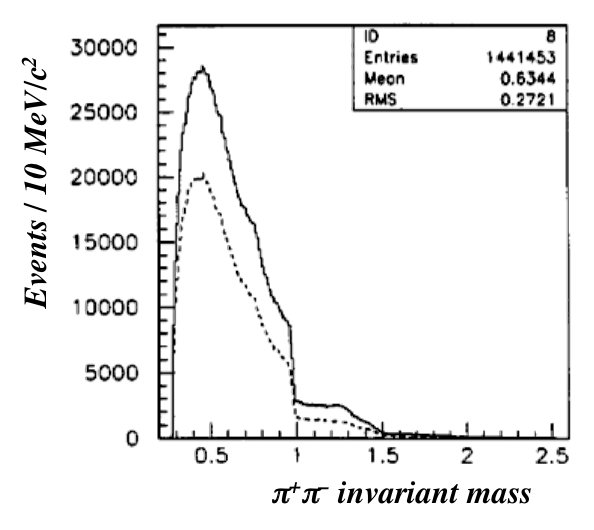
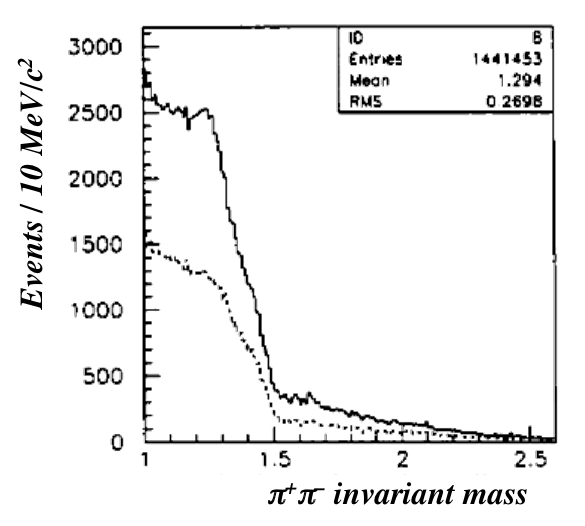
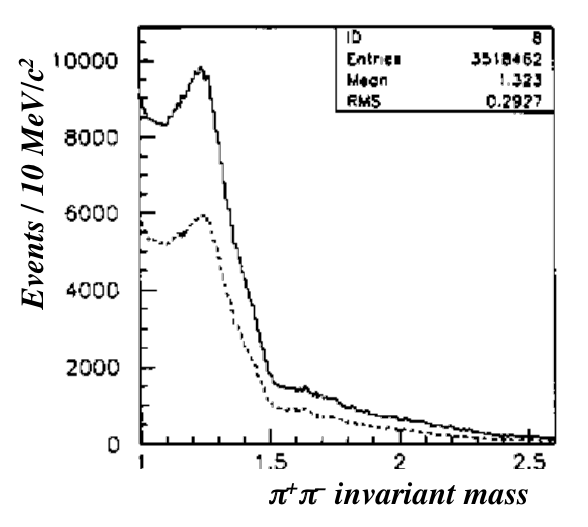
In order to select events according to reaction 1 with , experiment E690 required [4, 5], in addition to the protons, two charged tracks attached to the primary vertex, both of them with Čerenkov identities compatible with being pions; the missing proton longitudinal momentum was required to be GeV/c, and a rapidity difference between the missing proton and either pion greater than 1.8 rapidity units to avoid contamination. To select centrally produced events, the Feynman of the system was required to be between . The transverse momentum of both scattered protons was required to be (GeV/c)2, to enhance -wave dominance in the selected events. The invariant mass distribution for the selected events is shown in Fig. 2.
A Partial Wave Analysis (PWA) was performed following the method described by Chung and Trueman[6]. The reflectivity basis was used for the analysis, with eigenvectors defined in the Gottfried-Jackson (GJ) frame. In the rest frame of the system, E690 defined the GJ frame with the -axis in the direction of the momentum transfer of the beam proton, with the -axis perpendicular to the plane defined by the momentum transfers in the overall centre of mass (CM), and the -axis defined as in a right handed coordinate system. Only the amplitudes with and were used in the analysis:
| (4) |
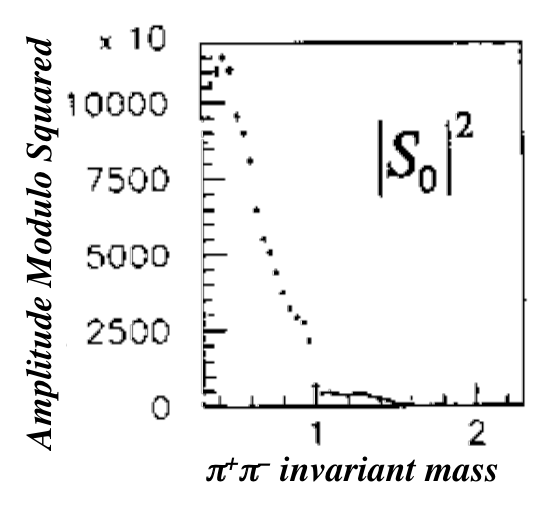
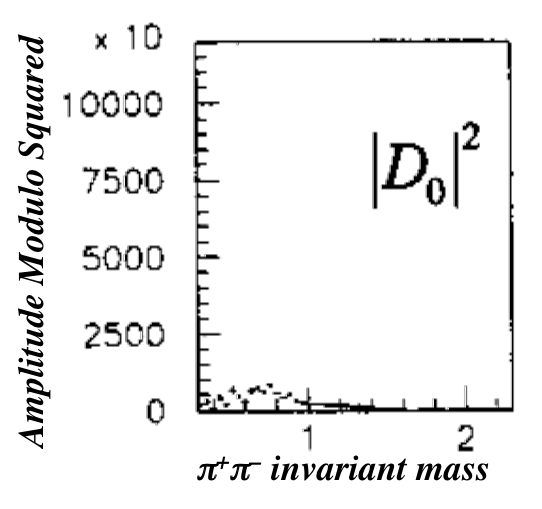
The assumption of -wave dominance near threshold is sufficient to select a single, continuous solution throughout the considered mass spectrum, from threshold to 1.5 GeV/c2, for events with both (GeV/c)2. The and waves are plotted in Fig.3. The -wave contribution is about the same as the one, and the -wave contribution is essentially zero. All -wave contributions are negligible, as expected from double Pomeron exchange. When the low transverse momentum selection on the fast proton is removed a significant -wave contribution is observed above 1 GeV/c2 due to the production of the (see Right panel in Figure 2).
The dotted lines on the left and center plots in Figure 2 and the data points on the left plot in Figure 3 show two prominent drops in the invariant mass spectrum. The sharp drop at 1 GeV was first explained by Morgan and Pennington [7] as the interference of the with a background that has a phase of about 90 degrees at 1 GeV. The second drop at 1.5 GeV is due to the interference of the same background with the . These same interference effects are observed in elastic scattering (for a review see the scattering section in W. Ochs[8]). No other features are observed in the -wave spectrum, for example there is essentially no evidence for the or the .
4 Central production of the system
The event selection for the decay included two secondary vertices with a tight invariant mass. The background under the invariant mass peak was so small that no direct particle identification was needed.[9] For every event the difference in rapidity between and the system was required to be larger than 1.2 units. For this difference was larger that 3.7 units.
The left panel in Figure 4 shows the invariant mass between threshold and 3 GeV/c2. This mass distribution is smooth beyond 2 GeV/c2, with no evidence of the narrow state seen by the BES Collaboration.[10, 11] The right panel in the same figure shows the rapidity distributions for , and .
A PWA analysis of the 11182 selected events was performed in bins of the invariant mass for events in the range , integrating over , , and , the angle between the scattered protons in the center of mass. Using the reflectivity basis for this parity conserving system, the wave amplitudes used were , , and (see Eq. 4). Only (even)++ waves are allowed in the system.[12] E690 performed the partial wave analysis maximizing the extended likelihood with respect to the four wave moduli and the two relative phases and .
Using the above four waves there are two solutions for every mass bin. These solutions can be continued from one bin to the next as long as they do not cross. This problem can be expressed in terms of Barrelet zeros[13], when a zero crosses the real axis the solution bifurcates. In the E690 analysis one of the two Barrelet zeros becomes real at 1.55 GeV/c2 producing a bifurcation point. At threshold the cross section is dominated by the resonance, so before the bifurcation point E690 eliminated the solution with a small contribution of wave near threshold. Of the two solutions after the bifurcation point, one is mainly wave and the other mainly wave. These two solutions are shown in Figure 5.
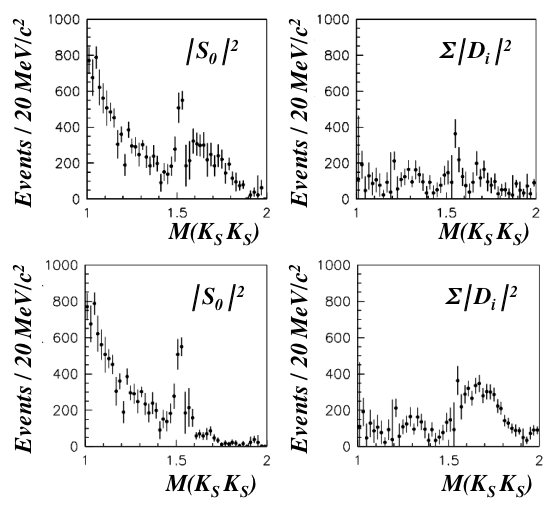
Three main features are observed before the bifurcation point: (i) the well established is clearly seen, (ii) the is observed in the wave amplitude, and (iii) there is no evidence of the . After the bifurcation point E690 could not determine the spin of the so-called . In a similar PWA analysis in and , WA102 later favored the spin-0 interpretation of the .[14]
The classification of the scalar mesons has not yet been resolved. The most commonly accepted interpretation is that there are two meson resonances in the region between 1300 and 1900 GeV/c2, and that the three observed states , and are a mixture of those two states and the lowest mass scalar glueball.[8, 14] However, E690 did not find evidence of a scalar resonance in the region of the in either the or the systems. This result is in agreement with the absence of the in elastic scattering.[8]
5 Central production of the system
In order to study reaction 1 with , experiment E690 selected events where the central cluster consisted of one positive track, one negative track, and a .[17] At least one of the two charged tracks was required to be identified by the Čerenkov counter as either a , or an ambiguous , and the other track was required to have an identity compatible with the final state. In all selected events, the forward proton, , was separated from the central mesons by at least 3.5 units of rapidity. A minimum gap of 1.8 units of rapidity was required between each individual meson and to ensure that there was no contamination of the final state from reactions in which would be a decay product of a baryon resonance, such as or . Finally, in order to ensure near uniform acceptance, the of the meson system was required to be in the range [0.15, 0.02͔].
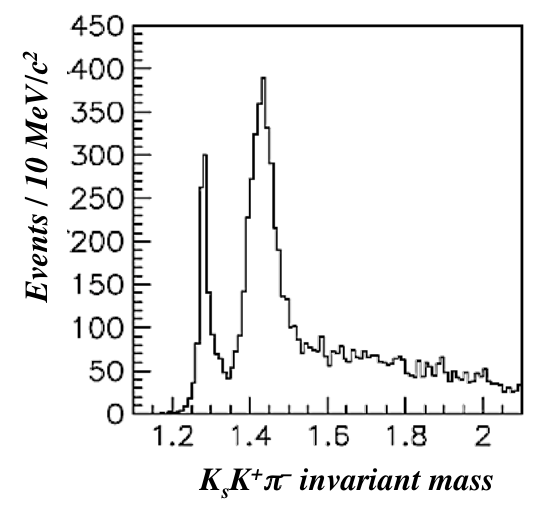
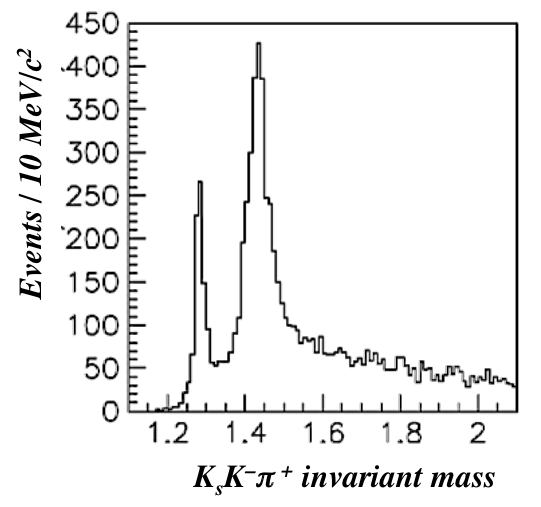
The invariant mass distribution for both charge states is shown in (Fig. 6). The first peak is easily identified by its mass and width as the , and the second peak is nowadays identified as the meson. At the time of the E690 publication[17] there were disagreements as to whether this second peak corresponded to the state,[18, 19, 20] or to a state decaying to that had been seen in interactions[21]. This ambiguity was known as the puzzle.[22]
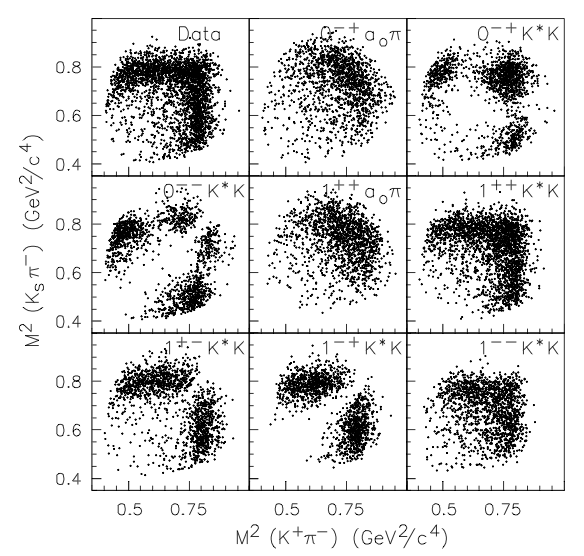
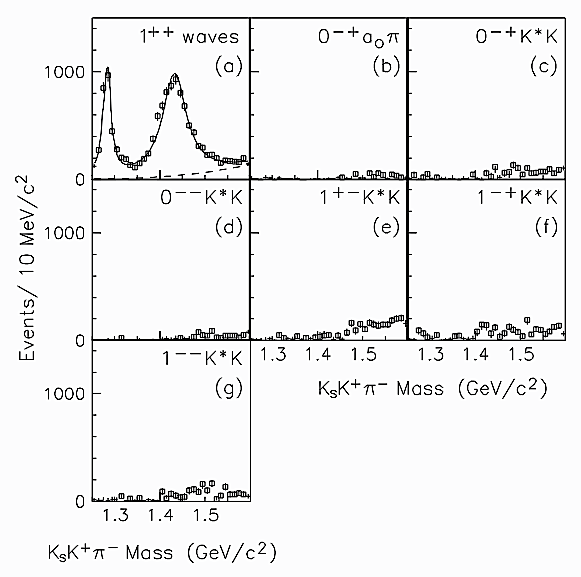
The Dalitz plots in the region are shown in the left panel of Figure 7 for the data, and the Monte Carlo for several different waves. Just by inspection of these plots it is easy to see that the data matches the simulation very well. To assess if there are small amounts of other waves, E690 performed a PWA analysis between threshold and 1.6 GeV.[17] The results, shown in the right panel in Figure 7, clearly demonstrated that only waves were needed to describe the data, confirming that pseudoscalar states were not seen in central production,[18] and solving the puzzle.
6 Central production of the system
The first observation of the OZI [23] suppressed reaction , was made using the BNLMPS spectrometer.[24] A subsequent PWA analysis on a larger data sample showed that three states were necessary to fit the data.[25] Fermilab FT experiment E623 measured the cross section in the reaction but did not perform a PWA analysis.[26] Given the OZI suppression the channel is believed to be a good place to look for the production of glueballs.
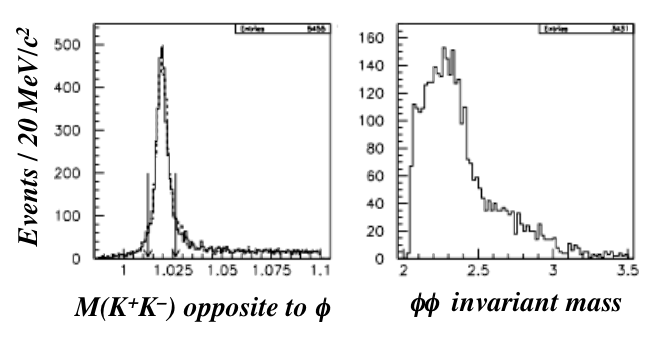
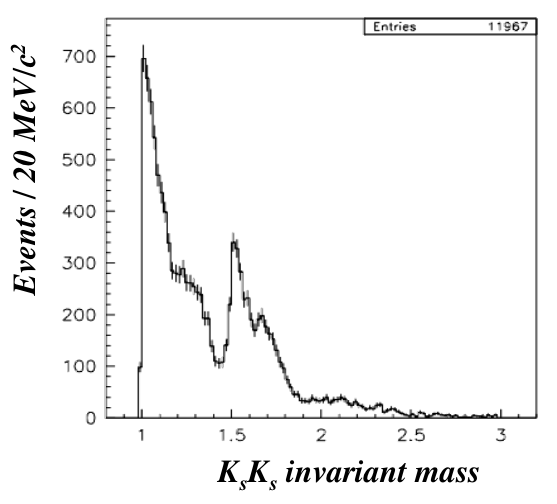
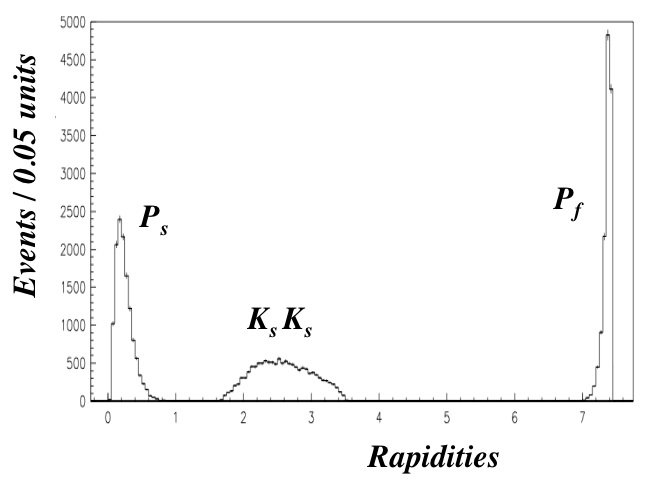
E690 measured the Central Production of in reaction 1 with and ,[27] selecting events with four charged tracks coming from the primary vertex, in addition to the diffracted proton. The tracks were required to have Čerenkov information compatible with being kaons, and at least one of them identified as not being a pion. A kinematic cut on the missing momentum MeV or arctan(45 degrees ensured that the missing proton was outside of the detector’s geometrical acceptance. The mass region was defined as GeV/c2. The and invariant mass distributions for the selected events are shown in Fig. 8.
E690 performed a PWA analysis of the system using states defined in terms of the total angular momentum , orbital angular momentum , parity and exchange reflectivity :
| (5) |
where . and are defined as the GJ angles of one of the mesons in the rest frame of the system, with the -axis in the direction of , and the -axis in the direction of the cross product, measured in the CM system. The other angles () are the two pairs of GJ angles of the ’s in their parent rest frames, with the -axis in the direction of , and . This system has , , and even number.
The analysis was performed in twelve bins of 50 MeV/c2 between 2.04 and 2.64 GeV/c2. The result of the analysis is shown by the symbols with error bars in Figure 9. Only three waves were necessary to describe the data. All waves have quantum numbers , with for the upper/lower symbols in Fig. 9.a, and for the circles in Fig. 9.c. The phase between the interfering waves is shown in Fig. 9.b.
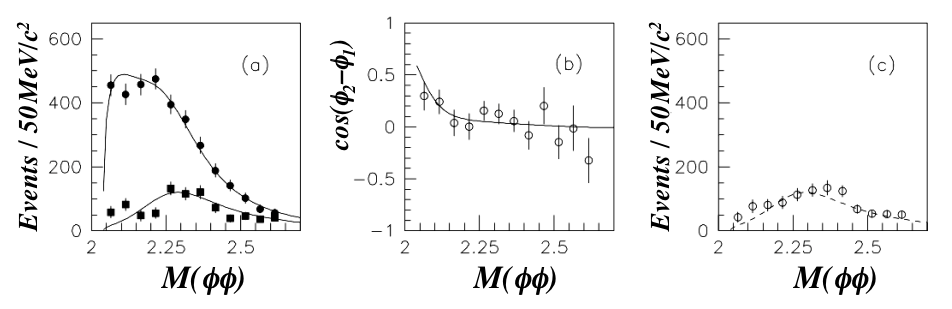
The cross section opens at threshold very fast, reminiscent of the fast opening of the cross section due to the presence on the just below threshold. This can be taken as an indication of a state right below threshold waiting to go into . E690 performed a fit to the result of the PWA analysis using a resonance below threshold produced as and another resonance above threshold produced in all states. The results of the fit are shown by the lines in Fig. 9. The extracted parameters for the resonance above threshold are:
| (8) |
With the available statistics, and only fitting to the channel, the parameters for the resonance below threshold could only be determined approximately, giving GeV/c2 and GeV/c2. These values are consistent with either the or the .[29]
7 Diffractive production of charm
To search for intrinsic charm states within the proton that could be excited diffractively,[30] E690 selected inclusive events with a meson decaying to :[31]
| (9) |
with being an unidentified recoil system. Even though the is centrally produced and the forward proton is clearly diffractive this reaction does not qualify as exclusive, but we decided to include it in this review because it constitutes the first measurement of the diffractive charm cross section.
The events were selected requiring at least four charged tracks (including the scattered beam proton) with the correct charge assignments coming from the primary vertex. The two tracks from the decay were required to be identified by the Čerenkov counter as a kaon and a pion, the slow from the decay was identified by the time-of-flight system. The identification of the slow from the decay was not required since this background is composed mostly of . The was selected requiring that MeV/c2, where . The of the diffractive proton was required to be larger than .[32] Figure 10 shows the and the mass distributions for the selected events.
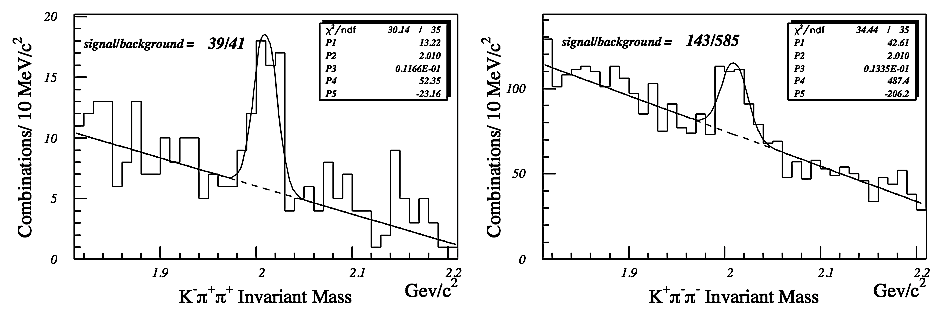
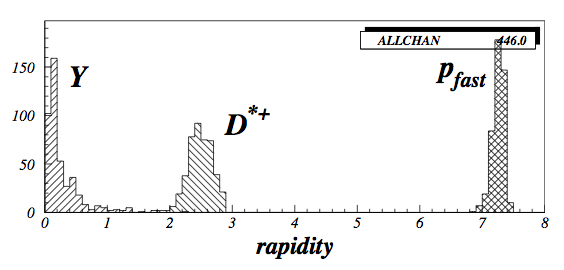
Figure 11 shows the rapidity distribution for the , the diffractive proton and the recoil system .[33] We can see a clear gap between the central and the rest of the system.
The values of the measured diffractive cross sections are:
| (12) |
These cross sections are compatible with previous limits and predict a total charm diffractive cross section of 0.66 b. This gives a ratio of the diffractive charm to the total diffractive cross section of , which is 10 times smaller than the ratio of the inelastic charm to the inelastic cross section.[31]
8 Conclusions
In this paper we reviewed the Exclusive Central Production of , , and and the diffractive production of charm at the Fermilab Fixed Target program. All these reactions were produced with an 800 GeV/c proton beam hitting a LH2 target. A Partial Wave Analysis was performed in all light meson production reactions, only the cross section was measured in the diffractive production of charm. The scalar mesons and are clearly seen both in and . There is no clear evidence of the in either reaction, a result that is in agreement with elastic scattering. The spin of the could not be determined with this data alone. Only two resonances, the and the , are seen in the PWA analysis of . The existence of a state decaying to in this reaction is completely ruled out. The Central Production of is clearly seen. Two resonances, one below and another one above threshold, are needed to explain the data. The measurement of the diffractive cross section shows that the ratio of the diffractive charm to the diffractive cross section is ten times smaller than the ratio of the inelastic charm to the inelastic cross section.
Acknowledgments
We would like to thank the many people that provided information about the Fermilab Fixed Target program. This work was funded by the US Department of Energy and CONACYT Mexico. M. A. Reyes would like to thank CONACYT for supporting a sabbatical stay at Femilab while this paper was being written.
References
- [1] CERN-ISR Collaboration (L. Baksay et al.), Phys. Lett. B61, 89 (1976).
- [2] For a list of FNAL Fixed Target experiments see http://www.fnal.gov/faw/fermilab_at_work.html#faw-experiments-and-projects.
- [3] E690 Collaboration (E. P. Hartouni et al.), Nucl. Instrum. Methods Phys. Res. A 317, 161 (1992); E690 Collaboration (D. C. Christian et al.), Nucl. Instrum. Methods Phys. Res. A 345, 62 (1994).
- [4] E690 Collaboration (K. Markianos et al.), in Proc. 14th Int. Conf. on Particles and Nuclei ’96, eds. C. A. Carlson and J. J. Domingo (World Scientific, 1996), p. 543.
- [5] K. Markianos, Fermilab-Thesis-1998-57.
- [6] S. U. Chung and T.L. Trueman, Phys. Rev. D 11, 633 (1975); S. U. Chung, BNL Preprint BNL-QGS94-23; S. U. Chung, BNL Preprint BNL-QGS95-41.
- [7] K. L. Au, D. Morgan and M. R. Pennington, Phys. Lett. B167, 229 (1986).
- [8] W. Ochs J. Phys. G: Nucl. Part. Phys. 40, 043001 (2013).
- [9] E690 Collaboration (M. A. Reyes et al.), Phys. Rev. Lett. 81, 4079 (1998). Details of this analysis may be found in M. A. Reyes, Ph.D. thesis, CINVESTAV, Mexico, 1996.
- [10] BES Collaboration (J. Z. Bai et al.), Phys. Rev. Lett. 76, 3502 (1996).
- [11] Particle Data Group, Phys. Rev. D 54, 1 (1996).
- [12] S. U. Chung, Phys. Rev. D 56, 7299 (1997); also in BNL Preprint BNL-QGS-97-041.
- [13] E. Barrelet, Nuovo Cimento Soc. Ital. Fis. 8A, 331 (1972). S. U. Chung, Phys. Rev. D 56, 7299 (1997).
- [14] WA76 Colaboration (T. A. Armstrong et al.), Phys. Lett. B 227, 186 (1989).
- [15] Crystal Barrel Collaboration (C. Amsler et al.), Phys. Lett. B 342, 433 (1995).
- [16] WA76 Colaboration (T. A. Armstrong et al.), Phys. Lett. B 227, 186 (1989).
- [17] E690 Collaboration (M. Sosa et al.), Phys. Rev. Lett. 83, 913 (1999).
- [18] T. A. Armstrong et al., Phys. Lett. B 146, 273 (1984); Z. Phys. C 34, 23 (1987); Phys. Lett. B 221, 216 (1989); Z. Phys. C 56, 29 (1992).
- [19] (D. Barberis et al.), Phys. Lett. B 440, 225 (1998).
- [20] (H. Aihara et al.), Phys. Rev. Lett. 57, 2500 (1986); G. Gidal et al., Phys. Rev. Lett. 59, 2016 (1987).
- [21] LASS Collaboration (D. Aston et al.), Phys. Lett. B 201, 573 (1988); P. Gavilet et al., Z. Phys. C 16, 119 (1982).
- [22] Particle Data Group (R. M. Barnett et al.), Phys. Rev. D 54, 1 (1996); Particle Data Group (C. Caso et al.), Eur. Phys. J. C 3, 1 (1998).
- [23] S. Okubo, Phys. Lett. 5, 165 (1963); G. Z. Zweig, CERN Report No. TH-401 and TH-412, 1964 (unpublished); J. Iizuka, Prog. Theor. Phys. Suppl.37-38, 21 (1966).
- [24] A. Etkin et al., Phys. Rev. Lett. 40, 422 (1978).
- [25] A. Etkin et al., Phys. Lett B 201, 568 (1988).
- [26] D. R. Green et al.),Phys. Rev. Lett. 56, 1639 (1986). T. F. Davenport et al.),Phys. Rev. D33, 2519 (1986)
- [27] Fermilab E690 Collaboration (M. A. Reyes et al.), in Proc. 10th Int. Conf. on Hadron Spectroscopy 2003, eds. E. Klempt, H. Koch and H. Orth (AIP Conf. Proc. 717, 2004), p. 135.
- [28] A. V. Anisovich et al., Phys. Lett B 491, 47 (2000). A. V. Anisovich et al., Phys. Rev. D85, 014001 (2012).
- [29] J. Beringer et al. (Particle Data Group), Phys. Rev. D86, 010001 (2012).
- [30] S. J. Brodsky, P. Hoyer, C. Peterson, and N. Sakai, Phys. Lett. 93 B, 451 (1980); S. J. Brodsky, C. Peterson, and N. Sakai, Phys. Rev. D 23, 2745 (1981).
- [31] E690 Collaboration (M. H. L. S. Wang et al.), Phys. Rev. Lett. 87, 082002 (2001).
- [32] K. Goulianos, Phys. Rep. 101, 169 (1983).
- [33] M. H. L. S. Wang et al, in QCD and Weak Boson Physics in Run II, Fermilab-Pub-00/297 (2000), page 235, Editors: U. Baur, R.K. Ellis and D. Zeppenfeld.